Solana (SOL): Heading For $280 Resistance | BullishCRYPTOCAP:SOL finally broke out of local resistance around $210 and is now pushing higher with strong bullish momentum. Buyers continue to respect the ascending trendline, confirming the structure.
As long as this momentum holds, the next major target remains at $280.
Swallow Academy
USDTSOL.P trade ideas

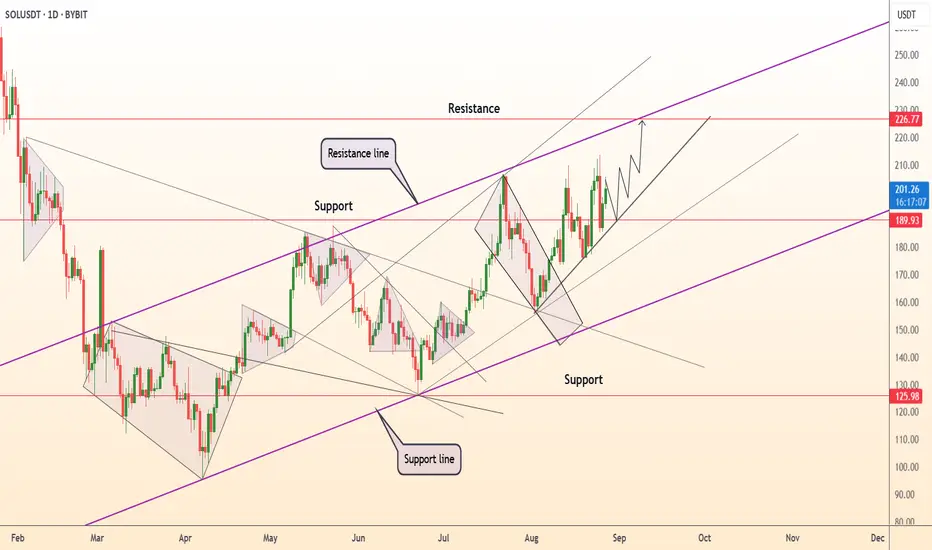
DeGRAM | SOLUSD above the $200 level📊 Technical Analysis
● SOL/USD is trading within a well-defined ascending channel, holding above the 189–190 support zone and building higher lows that reinforce bullish structure.
● The current move targets the 226–230 resistance, with the rising parallel channel supporting further gains as long as price remains above 189.
💡 Fundamental Analysis
● Solana’s DeFi TVL has grown over 20% in August, driven by fresh institutional inflows, while its ecosystem expansion (notably in gaming and payments) strengthens adoption.
✨ Summary
Bullish above 189; breakout continuation eyes 226 → 230. Invalidation below 189.
-------------------
Share your opinion in the comments and support the idea with a like. Thanks for your support!
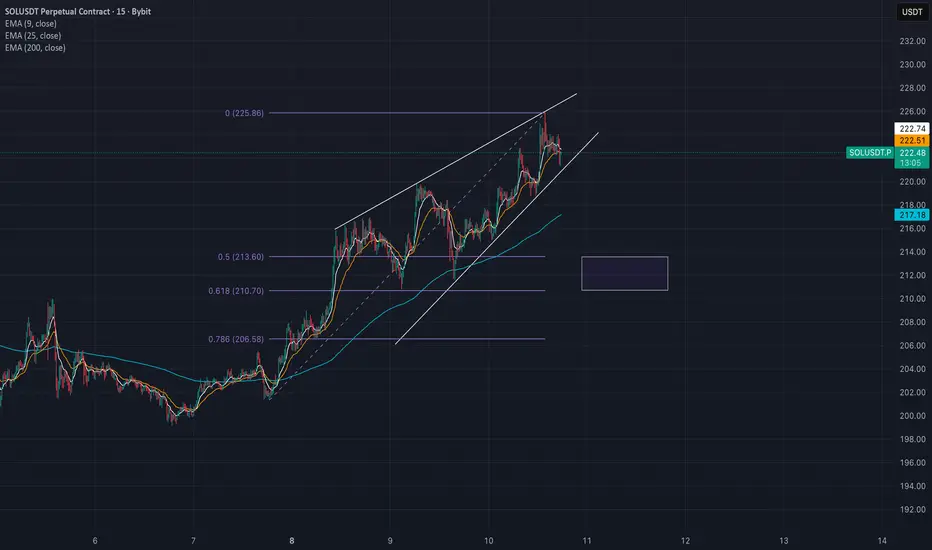
SOL: Eyeing the 210 Level – Waiting for the Green LightHello everyone, this week SOL is trading in a tight band around 203–205, with the spotlight firmly on US NFP data and the potential Spot SOL ETF. On the H4 chart, the decisive level remains 210: just above, a supply FVG stretches from 207.5–210, while below we only see support steps at 201–199 and deeper at 196–193.
My bias leans bullish. Should the data turn risk-friendly (soft NFP, cooler USD, steady BTC, positive ETF headlines), the odds of SOL clearing 210 rise considerably. A breakout could naturally extend towards 214–216 and even 219–221. On the flip side, only a close below 199 on H4 would invalidate this view, signalling a possible retreat to 196–193.
For now, I favour the scenario of a post-NFP breakout above 210 leading to further upside. As long as price holds above 199, this bullish tilt stays intact.
Do you believe SOL can finally push through 210 and target 219+, or will resistance hold firm once again?

Solana Wave Analysis – 10 September 2025
- Solana broke the resistance area
- Likely to rise to next resistance level 230.00
Solana cryptocurrency recently broke the resistance area between the resistance level 214.5 (which has been steadily reversing the price from February) and the resistance trendline of the daily up channel from April.
The breakout of this resistance area accelerated the active impulse waves iii and 3 of the higher impulse wave (3) from June.
Given the clear daily uptrend, Solana cryptocurrency can be expected to rise to the next resistance level 230.00.

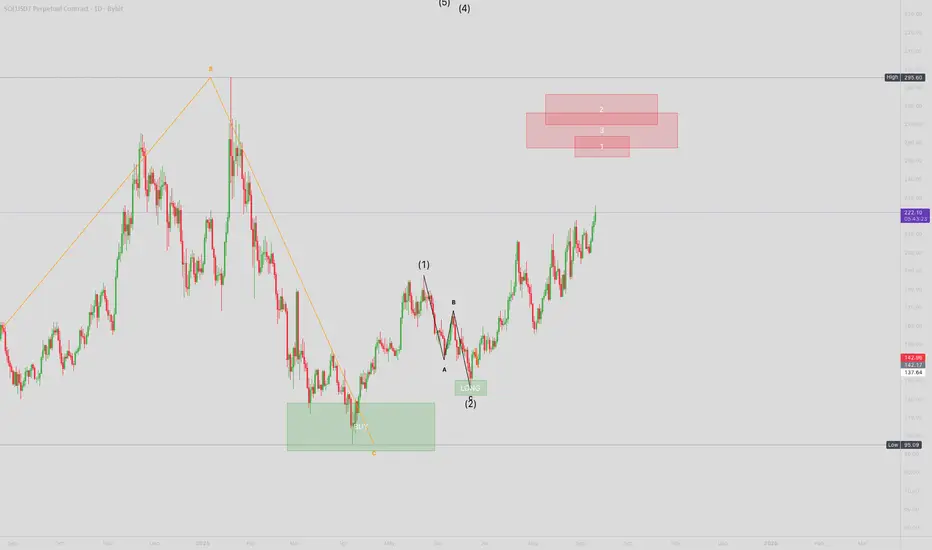
Bullish Scenerio SOL - 1D Time FrameAfter ending global 1-2 I'am expecting the 3rd. We are in this 3rd right now building lower degree structures like this 1-2 shown above. The target of internal third are shown as a red boxes.
SOLLocally we must see the correction, I`ve mentioned area where I expect to see Sol by tomorrow. NFA - DYOR
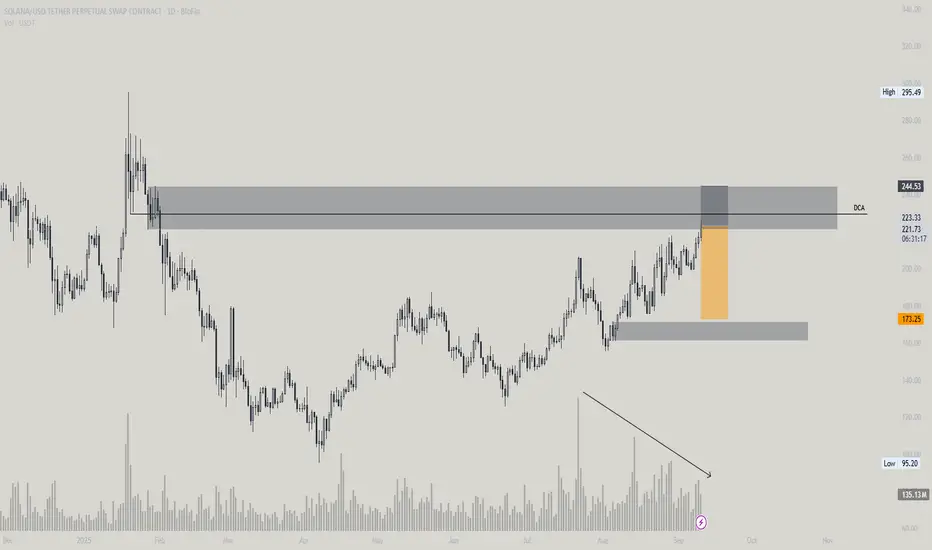
Swing Shorting SolanaShorting BLOFIN:SOLUSDT.P at $220.72 with one DCA limit order at $229.65.
Price is approaching resistance with declining volume, which is usually not a good sign.
I am targeting the liquidity zone in the low $170s.
SOL Ready to RIPSolana has been demonstrating notable resilience in recent sessions, consistently finding support along a well-defined local uptrend visible on the 1H, 2H, and even 4H timeframes. The $200 level continues to serve as a critical inflection point, acting as both historical support and resistance, with price repeatedly testing but struggling to establish firm acceptance above this zone.
That said, with Ethereum showing renewed strength and capturing market attention, we could begin to see capital rotation into other leading altcoins as investors look for relative value and potential catch-up plays. This type of market dynamic often precedes what many refer to as “alt season,” when capital flow broadens beyond Ethereum and Bitcoin, sparking accelerated moves across the broader crypto market.
Whether this backdrop evolves into the explosive breakout traders are anticipating remains uncertain—but the stage appears to be set. As always in these markets, conviction must be balanced with patience, as only time will ultimately reveal whether the momentum materializes into the massive move so many are hoping for.

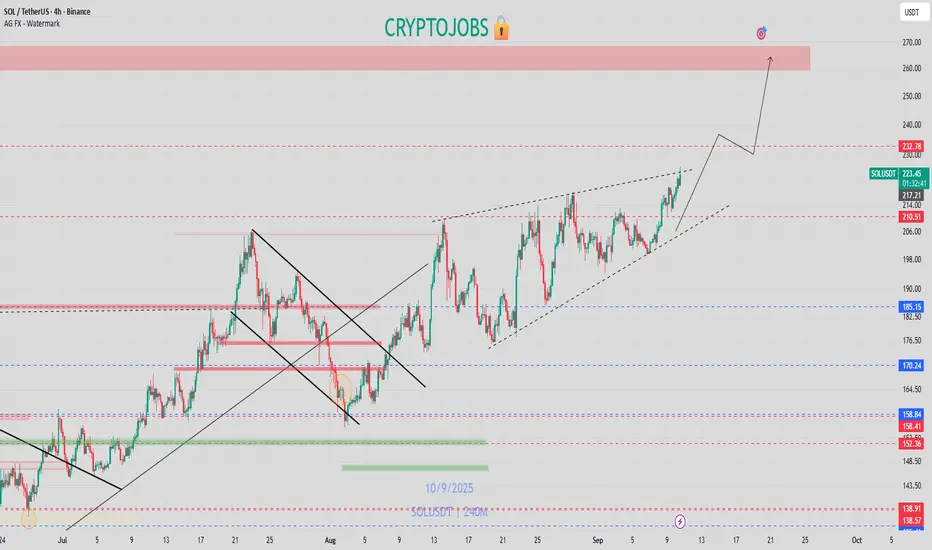
$SOL - ASCENDING ACCUMULATIONCRYPTOCAP:SOL - Ascending accumulation!
Strong uptrend daily; Bullish breakout awaited! 📈
Upper key resistance: 266 - 270$
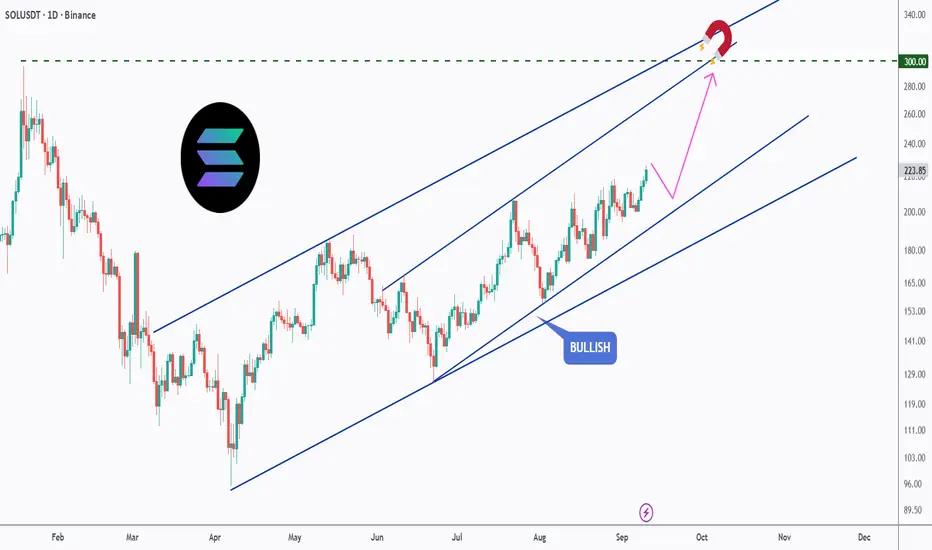
SOL’s Magnetic Path to $300!Solana has been steadily climbing inside a clean bullish channel, and the momentum is showing no signs of slowing down. The price action continues to respect higher highs and higher lows, keeping the bullish structure intact.
🟢 Bullish Channel: SOL is trading neatly within an ascending channel, confirming the trend’s strength.
🎯 Key Target: The $300 level acts as a magnet — a psychological resistance aligning with the channel’s upper boundary.
🔄 Healthy Pullbacks: Any short-term dips within the channel are being absorbed quickly, signaling strong buyer interest.
🚀 Upside Outlook: As long as SOL holds within the channel, the path of least resistance remains to the upside, with $300 as the next major milestone.
📌 Eyes remain on whether Solana can reach the $300 mark before the year’s end.
This is for educational purposes only, not financial advice. Always manage risk properly before trading.
📚 Stick to your trading plan regarding entries, risk management, and trade execution.
Good luck!
All Strategies Are Good; If Managed Properly!
~Richard Nasr
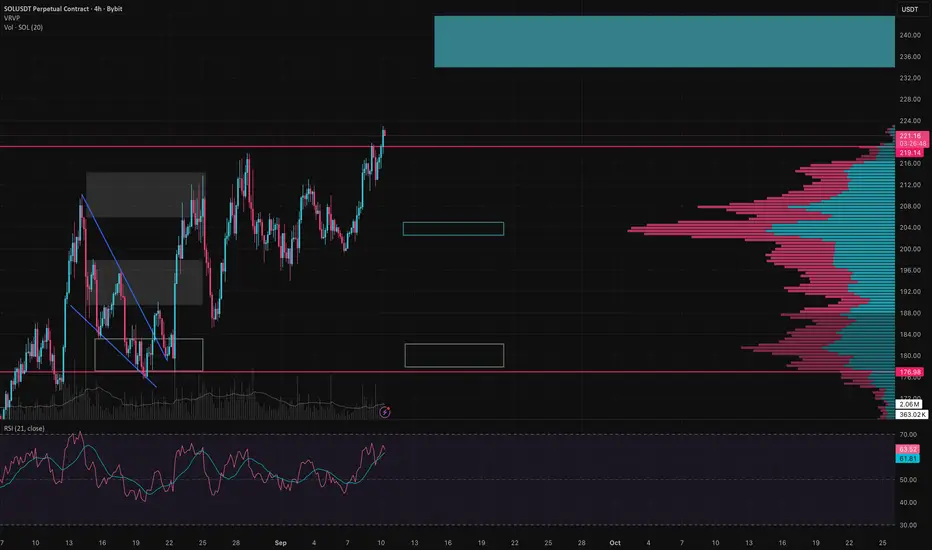
SOL Weekly Update – Bulls Losing Steam?SOL is testing a strong resistance zone right now. The problem I see is that RSI is already running hot and the volume keeps dropping. Price is pushing up, but buyers aren’t showing real conviction. That’s why I’m leaning toward a correction into the 202–204 range. This level looks like a good spot to start looking for long entries if the reaction is strong enough.
🔹 Bullish scenario: if we get a confirmed daily close above 222 with higher volume, the next target zone sits at 234–242. From there, bulls will need to prove they still have momentum, otherwise we could see another local correction.
🔹 Bearish scenario: a break and close below 201 opens the way for a move into 178–182, which is the POC zone with the heaviest traded volume. That level should act as major support if the correction deepens.
RSI is showing that the market is overheated, but it doesn’t mean the rally is over. If buyers suddenly show strength and step in with volume, we could still get another impulsive leg higher before any pullback.
My view: while price is grinding higher on weak volume, the risk of a drawdown into 202–204 is much higher than a clean breakout. That’s the zone I’ll be watching closely for long setups.
Disclaimer: The author’s opinion may not align with yours

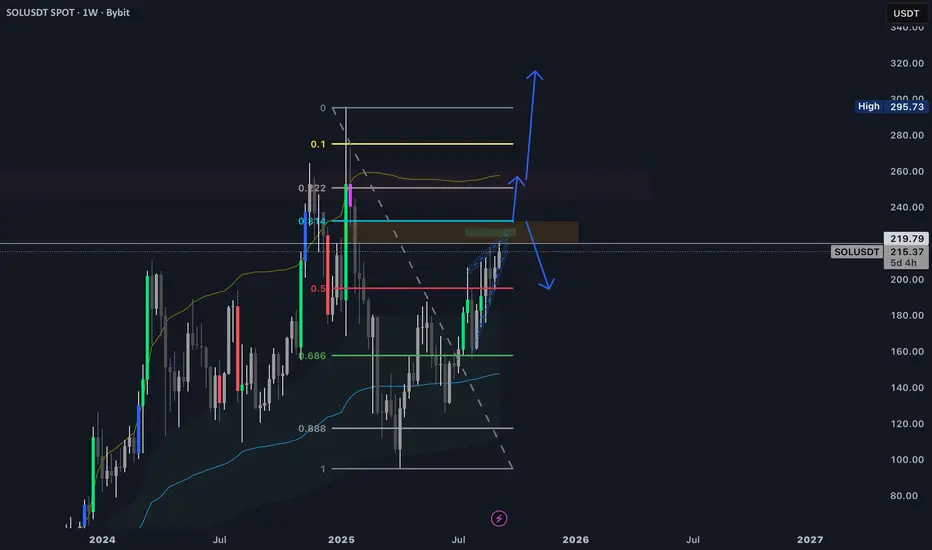
SOL won’t make it to the new ATH??We see this bullish novel on the 1D timeframe, which is a strong formation in this kind of trend.
Next, one of the most important Fibonacci levels in my opinion is 0.314, which is closing our volume gap (visible more clearly on the 1W timeframe). These two confluences, plus the divergence seen from the 1D TF downward, make me think of a possible slight downtrend from the 223–229 area, with potential liquidity grabs up to 232. In that case, we could be back at 193 and then continue the ride toward a new ATH.
One thing we need to keep in mind (but just as a possibility) is the Head & Shoulders formation from March 2024, with the head at the ATH and a potential right shoulder forming right now. It’s a darker scenario, but we shouldn’t forget about it.
So, I remain bearish until we break above $240.
Let’s see what the market gives us.
SOL NEW ATH SOON?We see this bullish novel on 1d timeframe which is strong formation in that kind of trend.
Next one of the most important levels of fibonacci imo ofc 0.314 which is closing our volume gap seeable better at 1w timeframe. So this 2 confluences plus divergence seeable from 1d TF down makes me thinking of possible slight downtrend from area 223-229. Possible lq till 232. In that case we could be back at 193 and then continue ride for ATH
Thing we need to concentrate our attention but just a little lets keep it possible is head n shoulders formation from march 2024 with head on ATH and possible right shoulder forming right now. Its dark scenario but lets not forget about it.
So im bearish until we break 240 $
Lets see what market will give us

SOL 1D – Holding Trend, Eyes on $244 While Fib Zone Sits BelowSolana continues to respect its rising trendline while trading well above the 50 EMA ($191) and 200 EMA ($172). Bulls have maintained momentum after reclaiming the Fib retracement zone between $121–157, where the 0.5, 0.618, and 0.786 levels cluster.
Immediate upside targets:
$244.21 = key daily resistance.
$296.04 = macro resistance above.
If SOL loses the trendline or EMA cluster around $190, a deeper pullback toward the Fib retracement levels ($142–157, $121) remains possible.
Stoch RSI shows overbought conditions, but structure stays bullish unless trendline support breaks.
📊 Key focus: Can SOL sustain this breakout to challenge $244, or will sellers force a retest of the Fib zone below?

SOL SHORT TERMResistance rejected again... guess what? Resistance to support... of course we're going back down.

Solana Bearish outlookIt takes a short liquidity from short traders in a daily timeframe,so I am expecting a heavy dump from here

Weekly trading plan for SolanaLast week, Solana showed growth and continues to rise now. At the moment, a wedge pattern is visible on the chart, with the next upside target at 223 and the upper boundary of the wedge.
A local trendline can also be drawn — if it breaks along with the 211 level, the price may enter a correction phase. The first target would be 204 ; if the price holds above it, I’ll provide an update with new plans. If it breaks and fails to reclaim the level, the correction could extend toward 191 .

Solana Price Hits 7-Month High But Caution Awaits SOL HoldersAt the time of writing, Solana trades at $219, holding firm above its $214 support floor. This represents a seven-month high, with the token facing resistance at $221. Sustaining this level will be crucial in shaping short-term direction.
Should momentum fade, Solana’s price could retrace to $206 or even lower, testing $195 as support. Such a correction would align with the RSI and address data signals pointing to short-term cooling.
Conversely, if existing SOL holders increase demand, the altcoin could defy bearish signals. A breakout above $221 would strengthen the bullish case, potentially driving Solana toward $232 and invalidating expectations of an imminent decline.

SOLUSDT – Bullish Momentum in Upward Channel | Breakout WatchSolana (SOL/USDT) is respecting an upward channel on the 4H chart, showing steady bullish structure.
✅ Multiple Break of Structure (BOS) confirms ongoing uptrend
✅ Price is currently rebounding from the channel support
✅ A clean breakout above 210 – 220 resistance zone could fuel a rally toward 230+
✅ Demand remains strong with supply zones near 190 – 200 providing key support
Key Zones:
📍 Support: 190 – 200 (Supply Zone), 170 (Major Support Level)
📍 Resistance: 220 – 230 (Channel Top)
📍 Next Target: 225 – 230
Watch for channel breakout confirmation and manage risk with stop loss below recent structure support

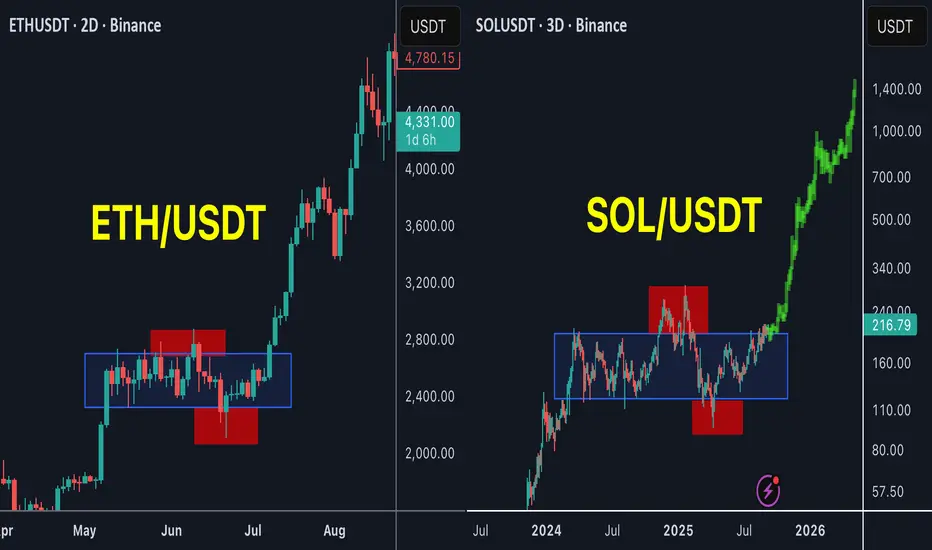
SOL is the next ETH !SOL / USDT
SOL is forming the same pattern as ETH before the huge breakout in past few weeks
Accumulation with 2 major stoploss hunt for bulls and bears and now is trying to breakout the accumulation zone
History show high success rate of this pattern
Will SOL be the next ETH ?
Best of wishes
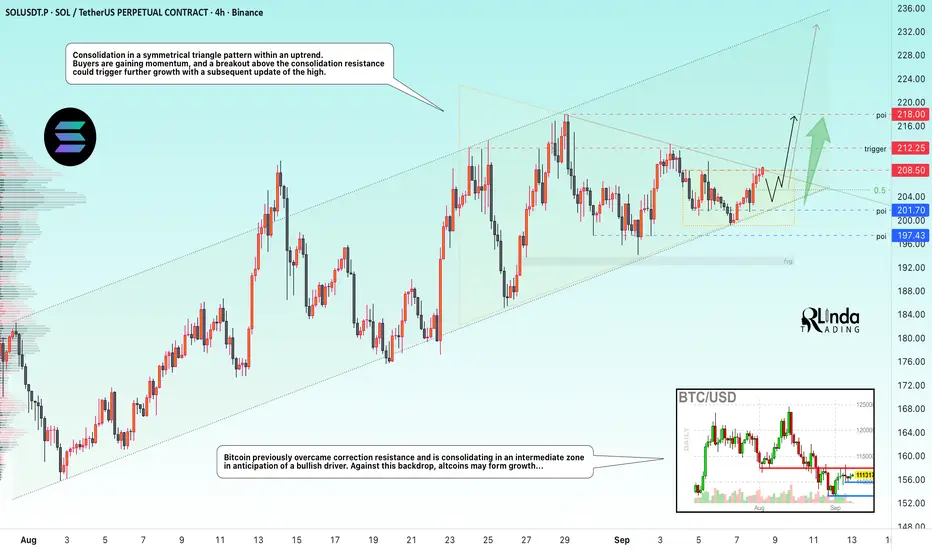
SOLUSDT → Consolidation before the rally. New high?BINANCE:SOLUSDT continues to form a bullish trend without reacting to market noise. The price is consolidating before a possible rise. Focus on the trigger...
Bitcoin previously overcame correction resistance and is consolidating in an intermediate zone in anticipation of a bullish driver, which could generally strengthen positive sentiment in strong altcoins. Against this backdrop, the market may form growth...
SOL is consolidating in a symmetrical triangle pattern within an uptrend. Buyers are gaining momentum, and a breakout of the consolidation resistance could trigger continued growth with a subsequent update of the maximum.
Resistance levels: 208.5, 212.25, 218.0
Support levels: 201.7, 197.4
Before the breakout and growth, a retest of the 205.0 - 201.7 zone may form, however, a breakout beyond the symmetrical triangle may trigger a spread. Growth targets may be 220, 245.
Best regards, R. Linda!
SOL/USDT LPL trade on the 4hr time-frameLPL trade
Price failed to create new FVG off previous FVG and instead a LOW PROBABILITY LEG (LPL) was formed ON 4HR time-frame. Price may possibly use this LPL as a new discount array to move higher from. All the best
