XRPUSDT - Time to be bearish!!Did you know that the XRP chart has turned bearish and is looking pretty grim?
A lot of indicators are pointing in that direction right now.
It recently formed a triangle pattern, broke out, rallied, and hit a new ATH — which coincided with the fifth and final wave of the Elliott Wave impulse.
Now it has shifted into an ABC corrective structure, and wave B seems to have completed, setting the stage for the main corrective move with wave C, which is expected to deliver around a 30% pullback from this point.
Another red flag for me is that XRP barely managed to break into a new ATH, only to quickly reverse and is now retesting the previous ATH, which lines up with the 1.00 Fibonacci level. Based on this, I strongly expect a major correction in XRP from here.
Sure, a lot of die-hard XRP believers won’t like this take — but let them ride it down. You can always buy back cheaper, my friend.
take a look to this post
As I told you earlier in a previous post, I recommended buying it at that time(3 months ago), which was the perfect entry. It has now risen by 50%, so I’m telling you to sell if you still hold it.
Best regards:
Ceciliones🎯
USDTXRP.P trade ideas

XRP: Bulls and Bears Fighting Over the Same Couch!XRP is trading into a key structural inflection point as we move into the weekend. Price is compressing between three high-value reference points: the neckline at 3.2496, the 50% Fibonacci retracement at 3.1560, and the Point of Control (POC) from the recent volume profile at 3.1322. This triad forms a high-probability reaction zone for the next directional leg.
From the swing low at 2.7405 to the recent high at 3.5716, the market advanced in a five-wave impulsive structure on lower timeframes. The subsequent retracement has been orderly, contained within a descending price channel, and has printed a series of lower highs, signalling controlled distribution rather than panic selling. The rejection from 3.57 aligns with a potential double top on the 4H and 1H charts.
The high-volume node at 3.1322 (POC) represents the highest traded volume area in the current range, marking it as a key battleground between buyers and sellers. Volume delta in recent sessions shows selling pressure increasing on rallies, suggesting offers are stacking above 3.25 while bids remain concentrated in the 3.15–3.13 zone. If the POC fails to hold on a retest, there is low-volume support until 3.05, after which the next notable node is at 2.88.
38.2% Fib: 3.2783 – acting as minor resistance intraday.
50% Fib: 3.1560 – aligning with the POC for a dual-layer support cluster.
61.8% Fib: 3.0349 – key retracement level, overlaps with previous structural pivot.
Bullish Scenario (40–45% probability)
If price holds above 3.15–3.13 and buyers step in on increased volume, the structure allows for rotation back toward the neckline at 3.2496. A reclaim and acceptance above this level could trigger a measured move toward 3.40, followed by 3.57 retest. Sustained momentum above 3.57 would target the 127.2% Fib extension at ~3.76.
Bearish Scenario (55–60% probability)
Failure to hold 3.15–3.13 would invalidate the local support cluster. A break of the POC with acceptance below it shifts control to sellers, opening targets at 3.05 (minor), 2.88 (major HVN from previous base), and potentially 2.74 (full 0% retracement of the prior rally). A breach of 2.74 would likely trigger deeper revaluation into the 2.55–2.50 liquidity pocket.
Macro & Fundamental Catalysts:
ETF Speculation: High-probability (95%) approval chatter could act as a volatility trigger in either direction if confirmed or denied over the weekend.
Regulatory Clarity: Ripple’s legal resolution removes an overhang, but also removes a “buy-the-rumour” driver, leaving market dependent on new catalysts.
Whale Movements: $175M in recent large-lot transfers indicate potential for distribution if market conditions weaken.
Correlation Risk: Bitcoin dominance and macro crypto flows will impact XRP’s ability to sustain directional moves.
For CFD and prop firm traders, the asymmetry of holding over the weekend must be factored in. Spot markets will continue to trade 24/7, but most CFD/prop platforms will remain closed until Sunday night. This creates exposure to potential weekend gaps that can breach stop levels or account drawdown limits before the market is accessible again.
Given the structural setup and confluence of levels, does this zone resolve as a bullish rejection or a clean breakdown into deeper support? Share your directional bias and target projections below I'd love to hear your take on it. Im by no means a "Crypto Guy" but this intrigues me.

Lingrid | XRPUSDT Potential Trend ContinuationThe price perfectly fulfilled my previous idea . BINANCE:XRPUSDT is holding above the 3.1500 support zone after a clean rebound from the ascending trendline, signaling a bullish continuation setup. The structure remains intact with higher lows, and the next major objective lies in the 3.8000 resistance zone. A breakout above 3.4000 could open the way for accelerated upside movement. Trend bias remains bullish while price holds above key support.
📉 Key Levels
Buy trigger: Break above 3.4000
Buy zone: 3.1000–3.2000
Target: 3.8000
Invalidation: Drop below 3.000
💡 Risks
A breakdown under 3.0000 could shift trend to bearish
Resistance near 3.8000 may cause sharp rejection
Broader market weakness could limit upside
If this idea resonates with you or you have your own opinion, traders, hit the comments. I’m excited to read your thoughts!

Is XRP doing it again?No need to complicate it, just look into it.
Will it reverse or what? Let's see.

XRP/USD LOOOOONGS🔀 Varied risks vs rewards
Break of downward trend ⤴️
🐃 Bullish overall bias
XRP army aren't stopping here 🌙
1️⃣ Tightest is - 1% (3.29) / 3% (3.69)
2️⃣ Mid - 1% (3.18) / 5% (4.18)
3️⃣ Large - 1.5% (3.10) / 6% (4.8)
Lets see how we goes!!

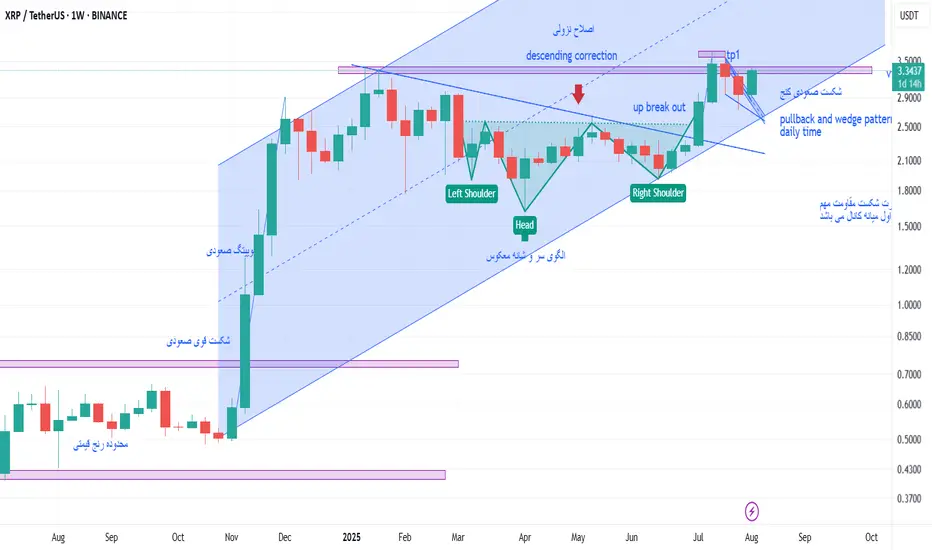
xrp weekly chartas we see total trend is ascending
tips :
1 after a midterm descending corretive trend it formed a head and soulder pattern which with macd positive divergence was a signal for the the end of correction
2 : by 7 july candle which is a strong ascending one the descending trend line was broken up and the buy signal was presented.
3 : when price reached to the vital static resistance made by candle 20 jan 2025 it stoped and formed a wedge pattern which is obvius on daily chart ,
4 : then we witness that the price broke up the wedge and now it is testing the static resistance level .
if it can break up that static resistance level I believe the first target price will be channel midline.
so we are waiting for closing weekly candle and starting new one , and for better decision we should control daily chart .
thank you
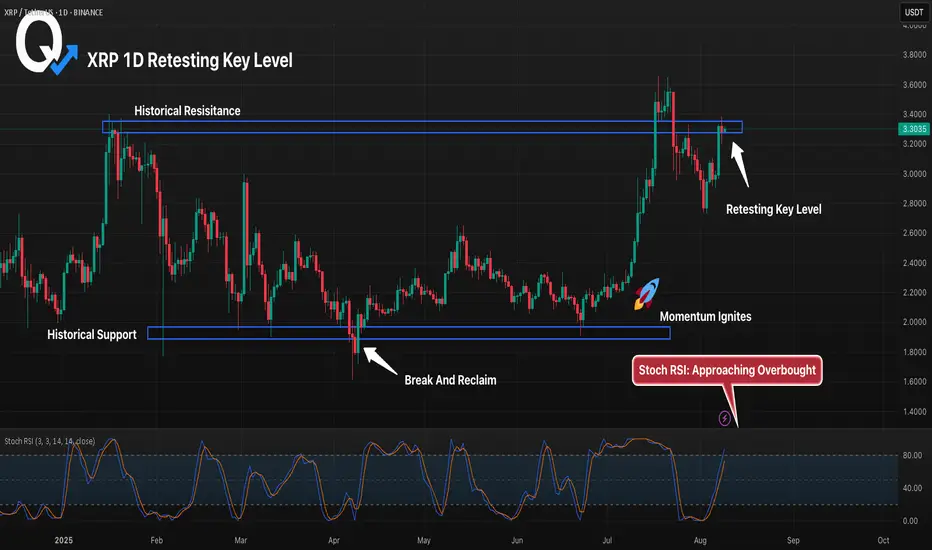
XRP 1D Retesting Key Level, Will Bulls Hold Above Historical ResXRP has broken and reclaimed a major historical support before rallying to retest the multi-year resistance near 3.30. Price is now pulling back into this zone, which will determine whether the breakout holds or fails. A successful retest could launch a push toward the July highs, while rejection here risks a drop back toward 3.07. Stoch RSI is nearing overbought, making this level even more critical for direction.
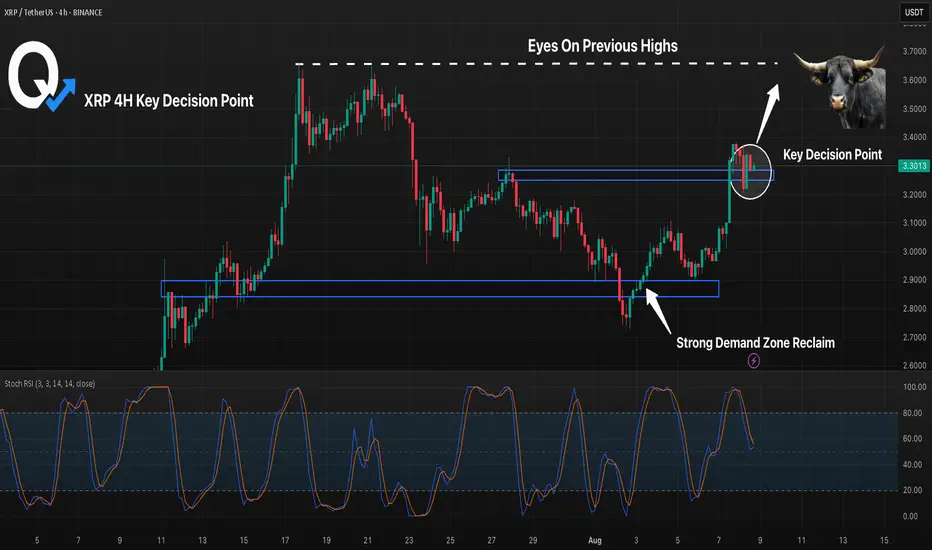
XRP 4H Key Decision Point, Will Resistance Flip Into Support?XRP has rallied strongly from the early August demand zone, reclaiming lost ground and pushing into a major resistance area near 3.30. Price is now stalling at this key decision point — a confirmed flip to support could spark continuation toward the next major highs, while rejection may trigger a retrace back toward the 3.05 zone. Both bulls and bears will be watching this level closely for the next move.
Ask ChatGPT
$XRP UPDATE!CRYPTOCAP:XRP
After breaking out above the trendline and tapping resistance at $3.38, price is pulling back, and with the weekend ahead, we might see a healthy retracement toward the 0.5 Fib level around $3.05.
That zone is shaping up as a prime accumulation area, especially for those eyeing the next leg up.
If that level holds, XRP could easily reclaim momentum and push toward $4 and beyond.
This dip might be the perfect chance to load up before the next leg up.
#XRP

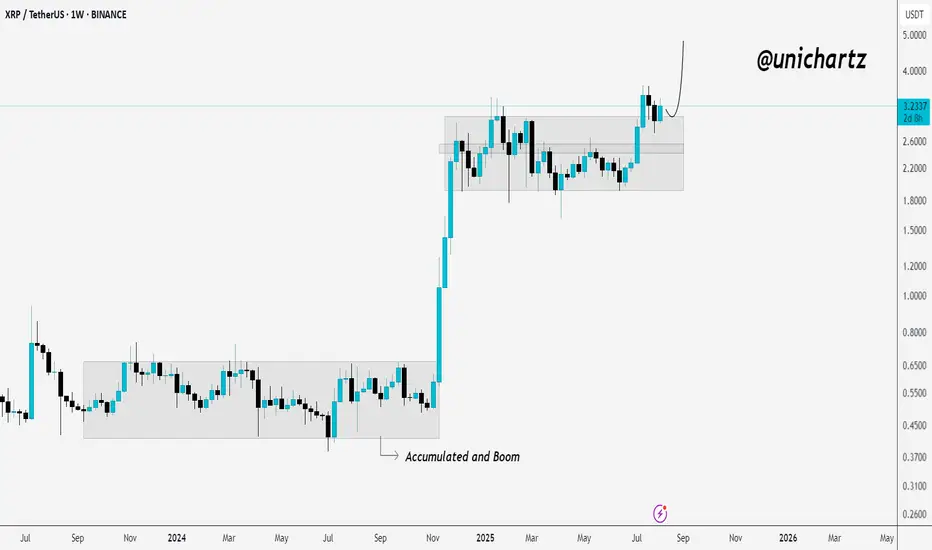
From Accumulation to Acceleration – XRP Ready to RunCRYPTOCAP:XRP has successfully retested the breakout level from its previous accumulation zone, showing strong bullish momentum.
After spending months consolidating in a tight range, price finally broke out with a sharp rally. The recent pullback found support right at the top of the old range, a classic breakout retest, and buyers stepped back in.
This retest confirms the breakout’s strength and could set the stage for the next leg up, with bulls now eyeing higher targets as long as price holds above the former resistance zone.
DYOR, NFA
XRP - Wait for It!Hello TradingView Family / Fellow Traders. This is Richard, also known as theSignalyst.
📈XRP has been overall bullish trading within the rising wedge pattern marked in blue, and it is currently retesting the lower bound of the wedge.
Moreover, it is retesting a strong demand zone marked in orange.
🏹 The highlighted blue circle is a strong area to look for buy setups as it is the intersection of the orange demand zone and lower blue trendline acting as a non-horizontal support.
📚 As per my trading style:
As #XRP retests the blue circle zone, I will be looking for bullish reversal setups (like a double bottom pattern, trendline break , and so on...)
📚 Always follow your trading plan regarding entry, risk management, and trade management.
Good luck!
All Strategies Are Good; If Managed Properly!
~Richard Nasr

XRP - 4H Elliott Wave Analysis - 08.08.25Greetings, here's an Elliott Wave Count for the current price action of XRP.
We assumed we bottomed on the 3rd August and started a new impulse to the upside in the white 5 wave move of which we have finished Wave 1 and 2 and are working or have finished Wave 3.
We would prefer if the white Wave 3 goes a bit higher and hits at least it's 1.382 FIB target at 3.4287 USD or even better the 1.618 FIB at 3.5182 before we see white Wave 4.
We already added a provisional white Wave 4 support which sits between the 0.236 FIB at 3.2690 USD and the 0.5 FIB at 3.1420 USD. Going lower to the 0.618 FIB at 3.0852 USD would be a warning sign that we are not in this impulse.
Be aware the white Wave 4 support area move higher as the price climbs higher.
After we get white Wave 3 and 4 in we will be looking for white Wave 5 which should take us to new all time highs.
Thanks for reading.
NO FINANCIAL ADVICE.

XRP | Ripple Game Plan - Swing Long Idea📊 Market Sentiment
Overall sentiment remains bullish, supported by expectations of a 0.25% rate cut in the upcoming FOMC meeting. The weakening USD and increased risk appetite across global markets are creating favorable conditions for further upside in crypto assets.
📈 Technical Analysis
Price broke the bearish trendline that had been driving the downtrend since July 18th.
A strong breakout and close above the trendline confirmed the move.
The breakout area also aligns with a significant HTF key level, adding strength to this zone.
📌 Game Plan
Looking for a quick retest of the broken trendline and HTF key level before a rejection.
🎯 Setup Trigger
Confirmation will come from a clear 1H break of structure after the retest.
📋 Trade Management
Stoploss: Below the 1H swing structure that caused the break of structure
Targets: TP1: 3.57 | TP2: 3.66
Will trail stop aggressively to secure profits as the move develops.
💬 Like, follow, and comment if this breakdown supports your trading!
More setups and market insights coming soon — stay connected!

Good news for RippleAfter the good news from the court, Ripple broke the trend line and the important level of 3.2 and seems to be moving towards $3.6. In case of a drop in Bitcoin dominance, BTC.D is likely to move even higher, such as $4, with this good news. A long position could be to buy Ripple at 3.2 with a stop loss below 3.

Ripple (XRP): 1:3 RR Position Opportunity Here | Breakout ComingXRP is still rising, attempting to break the local high and possibly reach a new all-time high (ATH). We found two trading opportunities here, so now all we have to do is wait!
More in-depth info is in the video—enjoy!
Swallow Academy

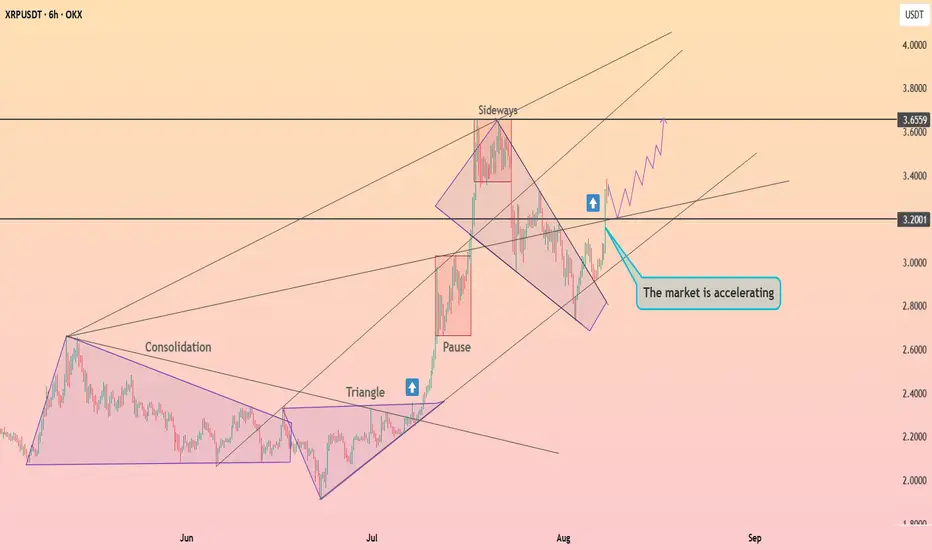
XRP is accelerating ┆ HolderStatOKX:XRPUSDT snapped back above 3.20 after a corrective slide from the 3.65–3.70 supply band. Structure shows a strong leg up out of a large triangle base, a brief “pause,” then a channel‑style pullback that just broke to the upside. As long as the market holds 3.10–3.20, upside magnets are 3.35, 3.50 and the key cap at 3.66. A decisive close above 3.66 would validate a fresh trend leg; a loss of 3.10 would likely revisit 2.95–3.00 demand. Momentum favors continuation while higher lows stack above reclaimed trend support.
XRP Bulls Take Charge as Aroon Up Hits 100%On the daily chart, XRP’s bullish momentum is reinforced by its Aroon Up Line, which currently sits at a perfect 100%. This reading signals that the token’s recent rally is strong and supported by notable buy-side pressure.
The Aroon indicator tracks how recently an asset has set a new high or low, offering insight into trend strength and potential continuation.
With the Aroon Up holding at this peak level, XRP has recently reached a 17-day high and appears poised for further gains. Such a reading typically suggests that bullish momentum is firmly in control, increasing the likelihood of a sustained upward move in the sessions ahead.

XRY to 4.50 next weekthe case with the sec lines up with the cup and handle formation. it will pop after news gets out next Friday.

Long trade
Trade Journal Entry – XRPUSDT
Direction: Buyside trade
Date: Wednesday, 6th August 2025
Time: 12:30 PM (Tokyo to London Session PM)
Timeframe: 15-Min TF Entry
📊 Trade Details
Entry Price: 3.3479
Profit Target: 3.5547 (+6.18%)
Stop Loss: 3.3236 (−0.73%)
Risk-Reward Ratio: 8.51: 1
🧠 Context / Technical Notes
Price action shows a bullish structure following prior range accumulation.
Multiple higher timeframe fib ranges marked; entry taken within premium/discount zones. Current price reacting from a demand zone with liquidity sweep seen in the lower timeframe.

Bullish on XRPCurrently all eyes are on ETH, but XRP is doing the same thing. Its ultra strong (at least as strong as ETH), bullish on all timeframes, trading above major EMAs. Showed off a 10% growth since the EMA crossover. Now let it cool down a little bit and wait for a entry around 3.20$. From there we may catch the next leg up 3.90$.
For more trade ideas check and insights check our profile.
Disclamer: only entertaining purpose, no financial advice - trading is risky.

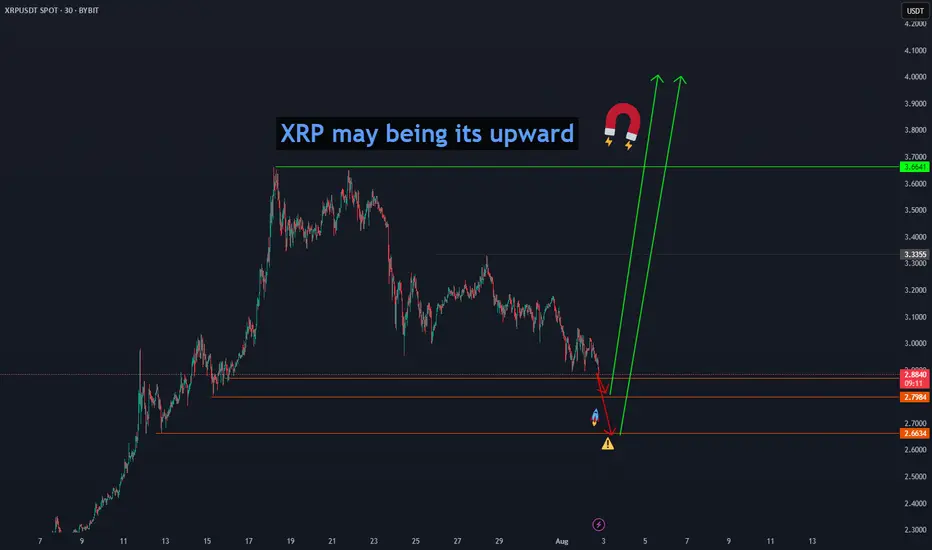
XRP may being its upward" Ripple (XRP) may begin its upward move from the price levels of 2.8865, 2.7984, and 2.6634, aiming for a first confirmed target at 3.6641 and then $4." BINANCE:XRPUSDT
XRP 1H – Major Resistance Hit, But Can Bulls Break Through?XRP surged into the 3.32–3.34 resistance zone after a sharp vertical rally, bringing price directly into a key decision point. This level has acted as a rejection zone before, making it crucial for bulls to clear for further upside momentum.
If price breaks and holds above this resistance, the move could extend toward the mid-3.4s. However, a rejection here may lead to a retest of the mid-level support near 3.06, with deeper pullbacks targeting the 2.90 key support zone.
Key watchpoints:
– 3.32–3.34 resistance for potential breakout
– Mid-level support at 3.06 if rejection occurs
– Stoch RSI overbought, suggesting possible short-term cooldown

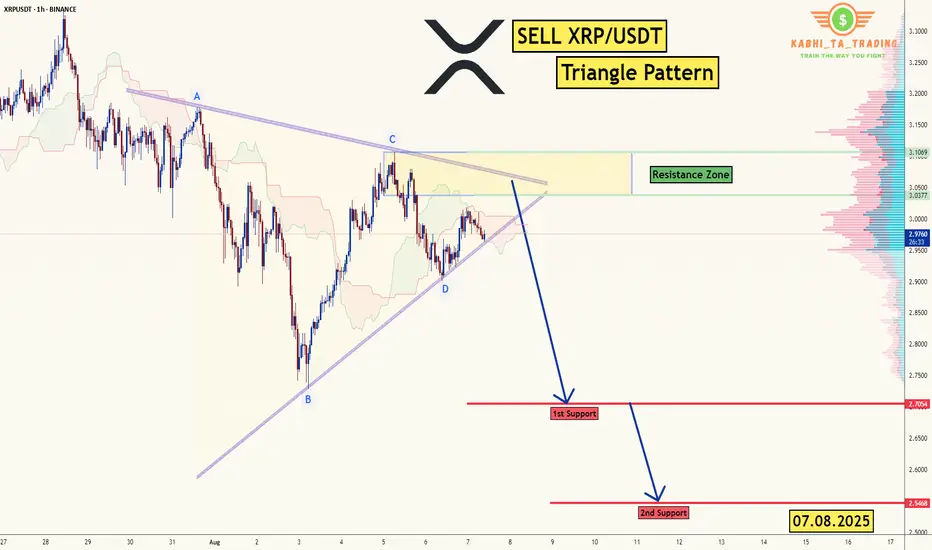
XRP/USDT -H1 - Triangle Breakout (07.08.2025)The XRP/USDT Pair on the H1 timeframe presents a Potential Selling Opportunity due to a recent Formation of a Triangle Breakout Pattern. This suggests a shift in momentum towards the downside in the coming Days.
Possible Short Trade:
Entry: Consider Entering A Short Position around Trendline Of The Pattern.
Target Levels:
1st Support – 2.7054
2nd Support – 2.5468
🎁 Please hit the like button and
🎁 Leave a comment to support for My Post !
Your likes and comments are incredibly motivating and will encourage me to share more analysis with you.
Best Regards, KABHI_TA_TRADING
Thank you.