XRP on the moon!As you can see, the chart's trendline has been broken, as indicated by the shown take profits (TPs).
USDTXRP.P trade ideas

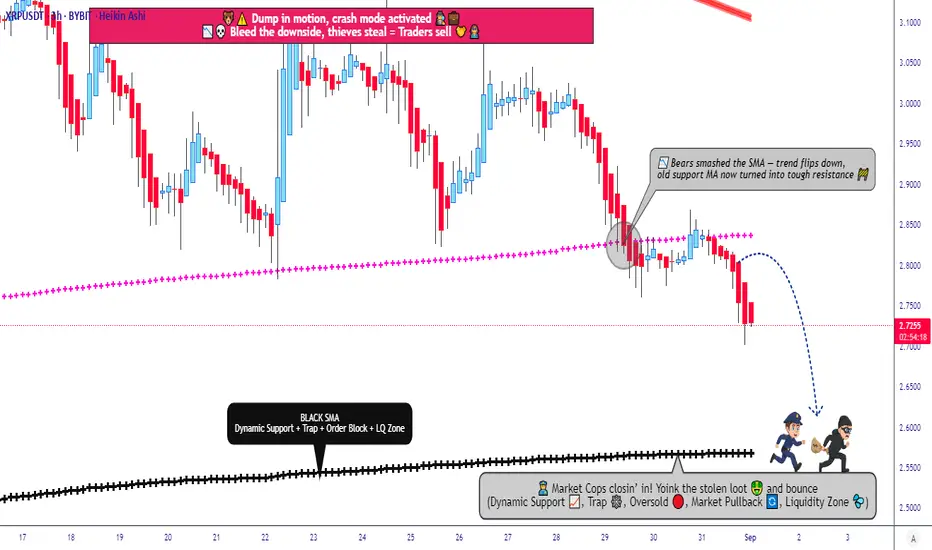
Ripple vs Tether — Can Bulls Escape the Resistance Trap?📌 TradingView Idea Description (XRP/USDT Thief Strategy)
Asset: XRP/USDT — “Ripple vs Tether”
Market: Crypto Wealth Strategy Map (Swing/Day Trade)
Bias: 🔵 Bullish Setup
🗺️ Trading Plan
Entry Style (Thief Layer Strategy):
Multiple buy-limit layered entries →
✅ 2.8000
✅ 2.8500
✅ 2.9000
✅ 2.9500
(Layers can be increased based on your own risk tolerance)
Stop Loss (Thief SL):
@ 2.7000 (personal setup — adjust as per your own risk appetite)
Target Zones:
🎯 Primary Target: 3.1500 → Key resistance zone + overbought condition + potential bull trap (take profits smartly).
🎯 Secondary Target: 3.3500 → Strong resistance cluster (“police barricade” zone) + overbought trap risk (partial/exit profits advised).
⚠️ Important Notes
👥 Dear Ladies & Gentlemen (Thief OGs):
I’m not recommending my exact stop loss or target — these are my personal levels.
Manage your own risk responsibly: “Make money, then take money at your own risk.”
This strategy is built around layered entries for flexibility in volatile markets.
🔍 Correlation & Related Pairs to Watch
Ripple (XRP) often shows sentiment correlation with broader altcoin momentum and BTC’s dominance. Key pairs worth monitoring for confirmation:
BINANCE:BTCUSDT → Bitcoin drives overall crypto market liquidity.
BINANCE:ETHUSDT → Strong ETH moves can influence Ripple flows.
BINANCE:XLMUSDT → Stellar often mirrors or diverges from XRP due to similarity in use cases.
BINANCE:ADAUSDT → Watch ADA for altcoin sentiment correlation.
Monitoring these pairs can give early signals of potential XRP strength or weakness.
✨ If you find value in my analysis, a 👍 and 🚀 boost is much appreciated — it helps me share more setups with the community!
📜 Disclaimer
This is a “Thief Style” Trading Strategy, shared for educational & entertainment purposes only.
Not financial advice. Trade responsibly — risk management is your best weapon.
#XRP #Ripple #Crypto #Altcoins #USDT #TradingStrategy #SwingTrade #DayTrade #LayeredEntries #ThiefStrategy

Forecast for XRPUSDT 29th September 2026Expectation of a minimum 10%+ Move to the Upside for XRP. Explosive move suggested by BBWP Indicator. XRP often moves with relatively increased velocity and magnitude compared to other large cap altcoins, so whilst a minimum 10% move is expected, it may likely move even more.

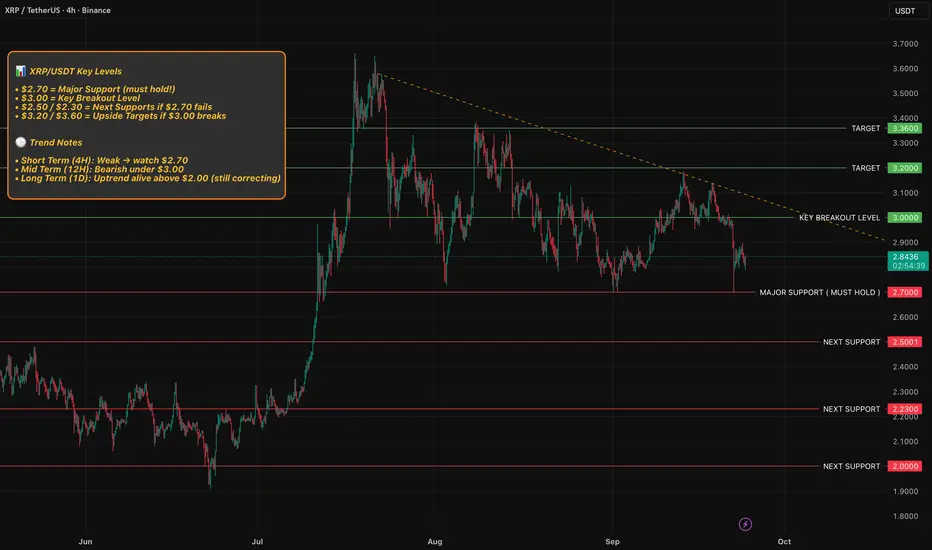
XRP is at a MAJOR decision point !
📊 XRP/USDT Key Levels
• $2.70 = Major Support (must hold!)
• $3.00 = Key Breakout Level
• $2.50 / $2.30 = Next Supports if $2.70 fails
• $3.20 / $3.60 = Upside Targets if $3.00 breaks
🕒 Trend Notes
• Short Term (4H): Weak → watch $2.70
• Mid Term (12H): Bearish under $3.00
• Long Term (1D): Uptrend alive above $2.00 (still correcting)
Thank you for reading my idea, let me know your thoughts and please support by leaving a simple comment as this helps me stay motivated and keep going.
xrp/USDT Technical Outlook📈 XRP / USDT Technical Outlook
Live & Technical Signals:
TipRanks shows XRP’s 20-day EMA and 50-day EMA above current price, giving “Sell” signals on these averages.
Barchart reports that the 5-day MA is ~ 2.891, 20-day ~ 2.945, and 50-day ~ 2.991—price is trading under those, indicating resistance overhead.
Many indicators (RSI, MACD, etc.) on Investing.com are mixed, with a neutral bias overall.
Support & Resistance Zones:
Resistance: ~$3.00 – $3.15
Support: ~$2.70 – $2.80
Below that, a drop toward ~$2.40–$2.50 is possible if support fails
Scenarios to Watch:
🔻 Bearish: A close below $2.70–$2.80 could open the path toward $2.40–$2.50
🔺 Bullish: A decisive break above $3.00–$3.15, especially with volume, could target $3.30+

BTC FAKE HIGH?Total market cap has created a new all-time high... but Bitcoin hasn’t.
Could this be a fake high before a massive sweep and reversal?
In this pre-weekly outlook, I break down what I’m seeing across the market — including BTC, TOTAL, and XRP — and why I believe this move up might be the trap before the drop.
Here’s what I cover:
- TOTAL market cap breaks all-time high — what it means
- Why BTC might sweep its all-time high next
- Fake move scenario and why I’m still expecting downside
- Why this is NOT the start of alt season
- XRP short +80% update from my previous call
I’ll be waiting for the weekly close for confirmation, but the structure is clear — don’t get fooled by short-term pumps.
#Crypto #Bitcoin #BTC #XRP #CryptoAnalysis #ICTTrading #CryptoMarketUpdate #Altcoins

XRP OUTLOOK XRP Breaks 1hr resistance , that is a good Bullish signal to go long targeting daily order block

#XRP/USDT looking extremely bullish#XRP
The price is moving within a descending channel on the 1-hour frame, adhering well to it, and is heading for a strong breakout and retest.
We have a bearish trend on the RSI indicator that is about to be broken and retested, which supports the upward breakout.
There is a major support area in green at 2.93, representing a strong support point.
We are heading for consolidation above the 100 moving average.
Entry price: 2.96
First target: 3.02
Second target: 3.06
Third target: 3.10
Don't forget a simple matter: capital management.
When you reach the first target, save some money and then change your stop-loss order to an entry order.
For inquiries, please leave a comment.
Thank you.

XRPUSDT Flow Map| Price In Bearish SentimentHi there,
XRPUSDT is bearish on the H1 timeframe. The current price is reacting bearishly against the resistance line at 2.9929, with strong bearish pressure at the 3.0102 resistance line. The price has reached the H4 trendline and is breaking it.
The trendline is supported by the H4 support line, but it will not hold due to the bearish high on September 24. The break of the trendline will trigger a move down to the 2.9029 target area and extend to the open area at 2.8500, driven by the dominant bearish pressure from the H4 bearish trendline.
Additionally, the RSI is in a bearish zone at 39.47, below its EMA, which is also decisively bearish at 48.13.
Happy Trading,
K.
_
Not trading advice

Xrp/Usdt - Bullish Reversal From Support ZoneXRP is currently trading within a well-defined support zone, showing potential signs of a bullish reversal after multiple structure shifts (CHoCH) indicating seller exhaustion. Price tapped into the support area with a rejection wick, suggesting strong buyer interest.
The entry zone is highlighted near the support, aligning with liquidity sweep and a possible accumulation phase. A clean break of internal structure toward the upside would confirm bullish momentum.
As buyers gain control, the market is expected to form a higher-low structure before pushing toward the target zone, potentially reclaiming previous highs. The overall setup favors a buy scenario, with confirmation upon sustained bullish candles above minor resistance.
Key Points:
• Timeframe: 15M
• Zone: Support Rejection / Liquidity Sweep
• Entry: Near support confirmation
• Bias: Bullish Reversal
• Target: Previous strong high level

BTC Hits New ATH… But What Happens Next? (History Says This)Bitcoin has finally taken out its all-time high — exactly as predicted in my previous analysis.
Now the real question is… what happens next?
In this video, I break down what this breakout means for BTC, TOTAL, and ALTs, and why the weekly close will be critical.
Historically, every time Bitcoin takes out all-time highs, we see strong bearish pressure shortly after — and this time might be no different.
Here’s what I cover:
- Bitcoin hits a new all-time high: what’s next?
- Historical patterns after ATHs
- What to expect from the weekly close
- XRP short update (still running)
- My BTC targets and what I’m watching next
- Altcoin rally incoming?
Stay patient, stay disciplined, and remember — the market rewards those who can manage risk and read structure.
⚠️ Disclaimer: This video is for educational purposes only and does not constitute financial advice. Always do your own research before trading or investing in cryptocurrency.
#Crypto #Bitcoin #BTC #XRP #CryptoAnalysis #ICTTrading #Altcoins #CryptoMarketUpdate #BitcoinATH

XRP Bears Dominate as Elder-Ray Index Stays NegativeOn the daily chart, XRP’s Elder-Ray Index continues to flash persistent negative readings, with the momentum indicator sitting at -0.0099. This highlights weakening bullish momentum as sellers maintain control over price action.
The Elder-Ray Index tracks the balance between buying and selling pressure by measuring Bull Power against Bear Power.
Positive values indicate bulls driving the market upward, while negative values reflect stronger bearish control.
With XRP holding below zero, current market conditions point to sustained distribution and bear dominance.

XRP Price Fails Breakout Following $950 Million SellingAt the time of writing, XRP is trading at $2.96, maintaining its position just above the $2.94 support level. The altcoin was poised to break out of its descending wedge pattern, but that attempt has failed for now, suggesting further weakness.
If the selling trend persists, XRP could extend its decline. The token risks dropping to $2.85 or lower toward $2.75, testing the lower boundary of the wedge pattern. Such a fall would confirm bearish dominance.
However, if investors regain confidence and halt the ongoing sell-off, XRP could stage a recovery. A successful rebound past $3.02 may open the path to $3.12 or higher, potentially invalidating the bearish outlook.

XRP/USDT – Bullish Breakout With 35% Upside PotentialCRYPTOCAP:XRP on USDT market pair is showing good strength here after finally breaking out of that descending trendline resistance that’s been holding since mid-July (57 days).
We also had a falling wedge breakout and price is now consolidating just above the old resistance, which has flipped into support. That’s usually a strong continuation sign.
The retest around $2.90–$3.00 held up perfectly, lining up with the 100 EMA, which makes that zone solid support.
I’m watching $3.35 and $3.68 as the first targets as long as its above demand zone.
Bigger picture, XRP could stretch toward $4.02 (around +35% from here), which lines up with the mid-range resistance from earlier in the year.
What do you think? Alts season looming?
#XRP #ALTSEASON

XRP/USDT Market Report + Strategic Entry Levels🚀 XRP/USDT Market Report & Layered Trading Plan (Day/Scalping Trade) 📊
Current Price Snapshot 💰
XRP/USDT is trading at $2.81, down slightly 0.04% over the last 24 hours amid broader market consolidation. Daily volume is strong at over $3B, showing steady interest. Market cap sits around $167B, ranking XRP in the top 4 cryptocurrencies. Support has held near $2.80 over the past week, with potential for a rebound if key levels break.
📈 Trading Plan: Bearish (Layered Strategy)
Entry : Any price level; use multiple limit orders (layering strategy) for controlled exposure. Example layers: 2.7500 | 2.7700 | 2.8000 | 2.8200. Adjust layers based on your own risk/reward preference.
Stop Loss 🛑: Suggested 2.8800. Adjust according to your personal strategy.
Target 🎯: 2.5700. Use smart exits and scale out of positions based on market momentum.
✅ Layered entries help reduce risk while maximizing opportunity. Ideal for scalping/day trades.
😊 Investor Mood & Sentiment
Overall Bullishness: 65%
Retail Traders: 70% bullish – excitement over payments utility, ETF expectations, partnerships.
Institutional Traders: 55% bullish – whale accumulation + cautious optimism, with some profit-taking.
Fear & Greed Index ⚖️: 48 (Neutral) – market steady, volatility at 4.27%. Consolidation phase ideal for strategic positioning.
🏗️ Fundamental Score: 85/100
Strengths: High adoption (300+ partners, $1.3T yearly transactions), fast XRPL settlements (3-5s), low fees, escrowed supply cap, burned fees reduce circulating supply.
Weaknesses: Competition from stablecoins like USDC could cap growth if banks shift focus.
🌍 Macro Score: 75/100
Bullish Drivers: Fed rate cuts, crypto-friendly policies, ETF approvals likely.
Challenges: Trade tensions, inflation, emerging market pressures.
Net positive: adoption in Asia/Africa outweighs headwinds for now.
🔮 Overall Market Outlook
Bullish (60% probability) 🟢 – potential to test $3.35 resistance, with $4 possible if ETF news hits.
Key Watch: Break above $3.00 confirms strength. Buy dips near $2.72 support for upside.
🗂 Related Pairs to Monitor
ETH/USDT | BTC/USDT | LTC/USDT | ADA/USDT
#XRPUSDT #Ripple #CryptoTrading #Scalping #DayTrade #LayeredStrategy #CryptoAnalysis #MarketReport #CryptoSentiment
[SeoVereign] RIPPLE BEARISH Outlook – October, 03 2025The basis for presenting a bearish perspective in this idea is grounded in Elliott Wave Theory.
In Elliott Wave analysis, the following representative length ratios are applied:
WAVE5 = WAVE1~3 * 0.382
WAVE.C = WAVEA * 0.618
To help you confirm these ratios more intuitively, I have plotted all the relevant sections on the chart.
Accordingly, the average target price is set around 2.855 USDT.
Additional briefings will continue to be updated in this idea as the chart develops.

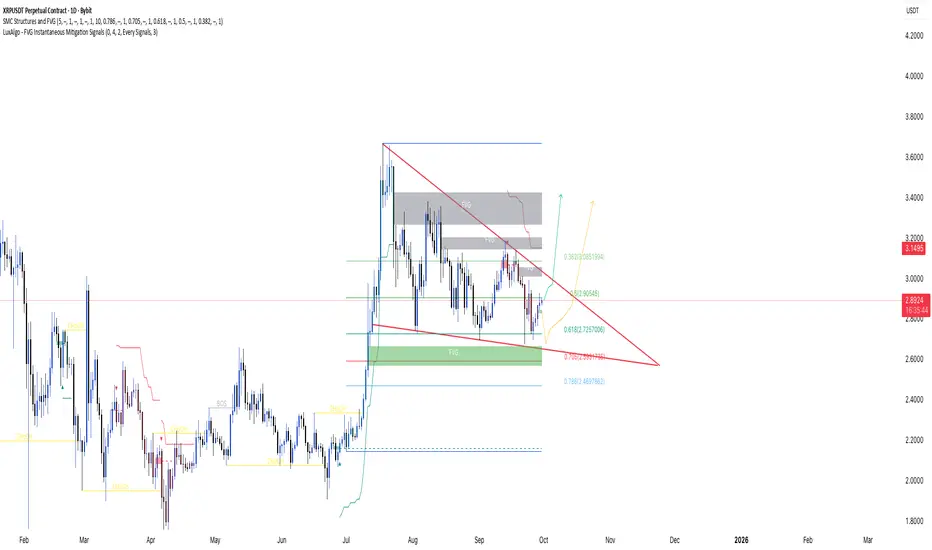
XRPUSDT 1D falling wedge coiling for breakoutPrice is compressing inside a falling wedge with demand below 2.72. A clean daily close above 2.98 opens 3.05 then 3.15.
Trend is corrective after the July impulse, printing lower highs inside a falling wedge. Internal structure is bearish-to-neutral, but compression suggests energy building for a break. Price sits mid range near the 0.5 retracement, with external liquidity resting above 3.05 to 3.15 and equal lows below 2.55 to 2.47. A daily break and hold above the wedge top would mark a change of character back to bullish; a sweep into the lower green box keeps the larger uptrend corrective.
Levels
Wedge resistance: 2.98
FVG supply ceiling: 3.15
0.5 retracement: 2.905
0.618 retracement: 2.726
Liquidity below swing lows: 2.470
Plan A
Trigger and confirmation
Wait for a daily close above 2.98 and the wedge trendline. Look for a retest that holds as a bullish order block or a higher low on 4H.
Invalidation level
A daily close back inside the wedge or below 2.86.
Targets: TP1, TP2, runner
TP1 3.05, TP2 3.15, runner 3.35 toward prior range high.
What would invalidate the idea
Failure to hold the breakout retest and sustained acceptance back under 2.90.
Plan B
If price sweeps the downside first, watch 2.72 to 2.60. Trigger on a sweep and reclaim of 2.70 with a 4H change of character.
Invalidation and targets
Invalidation on a daily close below 2.47. Targets 2.90, 3.05, 3.15.
Confluence
EMAs 20 and 50 are flattening while the 200 remains upsloping, consistent with a corrective pause. RSI is holding near 50 with mild bullish divergence versus the September swing low. Volume has compressed during the wedge, so expansion after a break should confirm. Volume profile favors 2.90 as a local point of control, with value area low near 2.70 aligning with the 0.618. Fib context places current price near the 50 level, with discount bids in the 62 to 79 zone.
Risk
Define risk at invalidation, not by feel. Size positions so a full stop hit is tolerable. Wait for confirmation instead of chasing the first spike.
Disclaimer
Educational content only and not financial advice
XRP back to realityOne of the worst shitcoins of them all, short it, avoid it, whatever you do don't buy at least in a year.
GL

The Number 3 Crypto + The New Low Buying StrategyThis crypto BINANCE:XRPUSDT
is the number 3 crypto
based on the market cap.
Something happened, you see
am trying to raise capital
for my business and its not
easy because
the person helping me
has given up on me.This person
is very close to me and
has helped me with
my business education
we had a huge disagreement
some few years ago.Because
you see this friend of mine
only believes in
get rich quick schemes
honestly i was so desperate for
help back then that any online business
education program would have convinced me.
But i knew from the very start that
the chances of making it in business
especially within the next 3 months
where not possible.
Even though i kept going
same with trading when i first saw
my trading knowledge serious
it was when after i broke up with my
girlfriend.
I studied Rocket Stocks by Matthew Kratter.
Everyday for 21 days then another
14 days apart.This strategy is
the one that helped me form
the Rocket booster strategy.
So whats the point of me
telling you these stories?
Nothing..these are stories
about nothing.
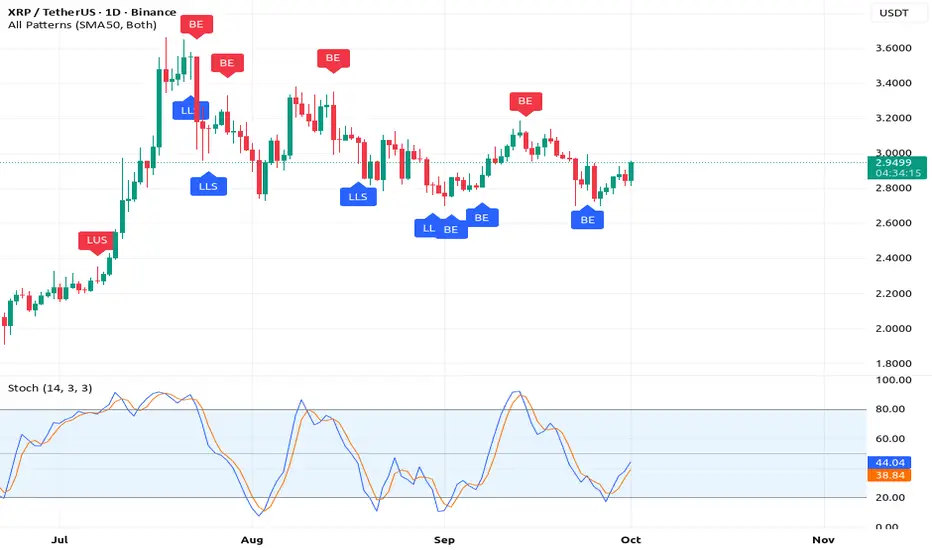
Now look at this chart BINANCE:XRPUSD
You will see something
called the Bullish engulfing.
This candlestick pattern
is the perfert entry signal..
This strategy is called the
New low buying strategy.
Because its done on a reversal after
a market crash.
Rocket boost this content to learn more.
Disclaimer: Trading is risky please learn risk
management and profit taking strategies.
Also feel free to use
a simulation trading account before
you trade with real money.
XRPUSD_1DRipple Analysis Medium and Long Term Time Elliott Wave Analysis Style The market is in an uptrend that is in a range in the medium term. Only if the price maintains above 2.7272 can it continue to rise after the range and move towards 4.0000.

XRP | Bullish DivergenceXRP is currently trading at $2.78, with a 0.84% increase in the last 24 hours. The bullish divergence on the hourly time frame suggests that XRP's price might be poised for a potential reversal or upward movement.
*Approach to Resistance*: With the 1:1.5 and 1:2 approaches, you're likely referring to potential resistance levels. If XRP's price reaches these levels, it may face selling pressure, which could impact its upward movement.

BUY AND HOLDHello friends
You see that after the good rise we had, the price has entered a correction and it is a good opportunity to buy in a stepwise manner in the price correction with capital and risk management and move with it to the specified goals.
Ripple is a currency whose holders have a good expertise in disappointing short-term traders.
Note that the holding period is at least 3 months, so be patient and observe capital management.
*Trade safely with us*

XRPUSDT, Ripple Bearish Short ScenarioPrice Action & Structure
• The chart clearly shows lower highs and lower lows, a classic downtrend structure.
• After the sharp sell-off around the 21st, XRP attempted a small rebound, but it stalled near the $2.99 – $3.00 resistance zone, aligning with the Fibonacci 0.5 retracement and pivot level.
• Since then, price has rejected again and is consolidating near $2.72, which is sitting close to the Fibonacci 1.618 extension. This suggests continuation pressure from sellers.
________________________________________
Fibonacci Levels & Resistance Zones
• $2.88 – $2.99 (Fib 0.382–0.5 + Pivot cluster): Heavy resistance. Sellers defended this zone aggressively, proving that bulls are weak at higher levels.
• $3.09 (Fib 0.618 + R2): Next resistance above, but price failed to even test it, further validating bearish strength.
• $2.62 (Fib support zone): First potential bearish target, as price seems to be heading in that direction.
• $2.57 – $2.50: Deeper extension support if breakdown accelerates.
________________________________________
Volume & Momentum
• The heavy red candles around the 21st–22nd show that sellers had much stronger momentum than buyers.
• Recent green candles are smaller in size and lack follow-through, which usually signals weak buying attempts in a bearish market.
• Momentum remains tilted toward the downside as long as XRP stays under $2.88–$2.99.
________________________________________
📌 Trade Setup (Bearish Bias)
• Entry: $2.72 (current levels or on a pullback to $2.85 resistance)
• Stop-Loss: $3.00 (above Fib 0.5 and pivot cluster)
• Take-Profit 1: $2.62 (Fib support)
• Take-Profit 2: $2.50 (extended bearish target)
• Risk/Reward: Approx. 1:2.
________________________________________
✅ Justification for Bearish Bias:
The trend structure is clearly bearish (lower highs/lows), XRP is failing to reclaim strong resistance zones ($2.88–$3.00), and Fibonacci + pivot confluence points confirm sellers are in control. Unless bulls break and sustain above $3.00, downside remains the path of least resistance.
________________________________________
