Forecast for XRPUSDT 30th September 2026 (Updated)Macro forecasting XRP to ~$2.9 followed by a short sell to ~$2.5 then a large move to ~$3.1 then a huge move to the downside to ~$2.25-$2.3 then to the heavens for Q4
USDTXRP.P trade ideas

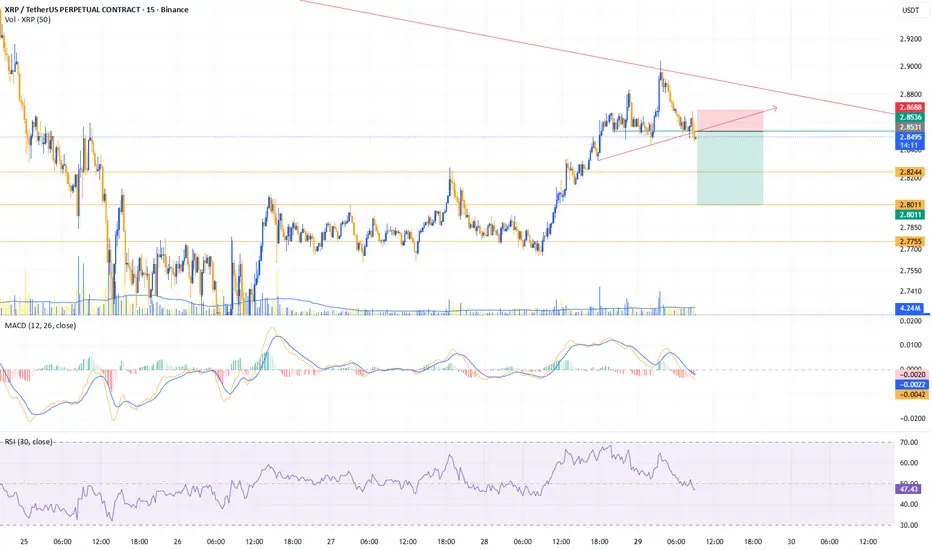
XRP Swing Long Opportunity - LRKZ MODELXRP Swing Long Opportunity
📊 Market Sentiment
FED has resumed its rate-cutting cycle, starting with a 0.25% cut in September, with two more 0.25% cuts expected in the coming months. Additionally, institutional liquidity inflows have accelerated as the U.S. officially adopts crypto as part of its reserves. While inflation remains elevated, the weakening labor market is forcing the FED to ease, driving more capital into risk-on assets.
📈 Technical Analysis
Price made a new all-time high and is currently retracing before pushing higher again.
Price ran the weekly swing liquidity at $2.70 and closed above with a wick, confirming manipulation before expansion.
Price also retested the broken HTF Demand zone at $2.69, which was strong resistance previously and now acts as strong support.
These confluences strongly suggest rejection and continuation higher.
📘 Model to be used – HTF Liquidity Run into HTF Key Zone (LRKZ Model)
In this model, I first define the HTF trend. Then, I look for the most significant liquidity that lies opposite to the HTF trend (swing highs or lows). These zones often contain enough liquidity to trigger reversals or strong bounces. When price sweeps this liquidity and retests an HTF Key Zone (where strong limit orders sit), it creates a high-probability setup. Confirmation on LTF then provides the entry trigger.
📌 Game Plan
Price already closed above the $2.70 level, confirming entry. Looking for continuation higher with structured targets.
🎯 Setup Trigger
Setup is active long position valid after the daily close above $2.70.
📋 Trade Management
Stoploss: Daily close below $2.70 or hard stop at $2.50.
Targets:
TP1: $3.18
TP2: $3.37
TP3: $3.66 (ATH)
After TP1 is secured, I will move stoploss to breakeven and scale profits as price moves toward higher targets.
💬 Like, follow, and comment if this breakdown supports your trading! More setups and market insights coming soon — stay connected!
⚠️ Disclaimer: This content is for informational and educational purposes only and does not constitute financial, investment, or trading advice. Always DYOR before making any financial decisions.

XRP - 1D Elliott Wave Analysis - 28.09.25Welcome
We assume that the low on the 7th of April formed the green Wave 4 and we are since then working on the green Wave 5 which is the last Wave to the upside of this bullmarket for XPR.
We have already formed the blue Wave 1, 2 and most likely 3 of the green Wave 5 and we are working on the blue Wave 4. The green Wave 5 appears to be an ending diagonal.
We are still working on the blue Wave 4 which currently we count as an WXY in red of which we finished Wave W and X and are working on Y. Wave Y would unfold as ABC. The Wave 4 support area lies between the 0.5 FIB at 2.6350 USD and the 0.786 FIB at 2.1909 USD. The next targets to the downside for Y are the 2.5160 USD and the 2.3728 USD price level depending on the count and measurement. The 2.4161 USD price level is also interesting as it is the point of control of the previous price action which could function as additional support as well as the white trendline that we have going through the support area.
Thanks for reading.
NO FINANCIAL ADVICE.

XRPUSDT 1D#XRP is moving inside a descending triangle pattern on the daily chart — a classic pattern that usually has a bearish breakout. However, it’s currently attempting to rebound from the support zone. We need to see if it can hold the support zone or not.
For the bullish scenario, it must break above the daily SMA100 and the triangle resistance. In this case, the potential targets are:
🎯 $3.0262
🎯 $3.1277
🎯 $3.2292
🎯 $3.3738
🎯 $3.5579
On the other hand, if it breaks the triangle to the downside, you can place some buy orders around the following levels:
💰 $2.6026
💰 $2.4925
💰 $2.3452
⚠️ Always remember to use a tight stop-loss and follow proper risk management.

XRP Shorting IDEA - Scalp-intradayJournal Entry #12.
Looking for scalp-intraday short here
Indicators showing a bearish movement.
XRP/USDT SHORT TERM ANAYSIS % PROFIT XRP, have been on a downtrend on a few days ride, but recent improvement in price movement noted, right now it's facing a resistance level, which in the past couple of days was a support level for the price before it took a ride to bears market, , if right now the market is to fill the imbalance we might see the price move back to the demand zone before bouncing back to the resistance level and with good momentum we might see a breakout of the resistance to the uptrend, if the market falls back passed the demand zone we might as well see a continuation in the downtrend, let keep watch if the market is to break resistance level without filling the imbalance we will be in an uptrend. Let's keep watch

Monthly Crypto Analysis: Ripple (XRPUSD) – Issue 95 The analyst believes that the price of Ripple will decrease within the time specified on the countdown timer. This prediction is based on a quantitative analysis of the price trend.
___Please note that the specified take-profit level does not imply a prediction that the price will reach that point. In this framework of analysis and trading, unlike the stop-loss, which is mandatory, setting a take-profit level is optional. Whether the price reaches the take-profit level or not is of no significance, as the results are calculated based on the start and end times. The take-profit level merely indicates the potential maximum price fluctuation within that time frame.
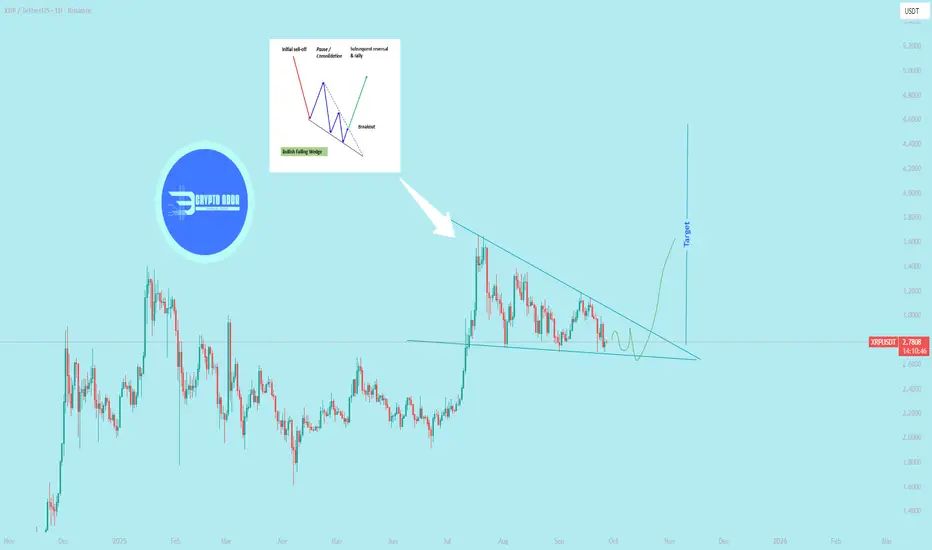
$XRP Performing falling wedge pattern in 1D
> Falling wedge as a reversal vs. continuation pattern
`As a reversal pattern`
`Location:` Occurs at the end of a prolonged downtrend.
Signal: The narrowing price action and declining volume suggest that sellers are exhausting their momentum. The pattern is completed when the price breaks above the upper resistance line, signaling a potential bullish reversal.
`As a continuation pattern`
`Location: `Appears after a strong uptrend.
Signal: The falling wedge acts as a temporary consolidation or pause in the current trend. The price then breaks out to the upside, continuing the original uptrend. @everyone
XRPUSDT XRP is in a corrective phase inside a downtrend channel after a sharp rally in July.
If XRP holds above 2.70 USDT and bounces, it may retest 3.0–3.2 USDT (channel midline).
If it breaks below 2.70 USDT, the next major support is near 1.95 USDT (strong demand zone).
RSI doesn’t show extreme conditions yet, so price could still drift lower before buyers step in.

$XRP Mild Bearish (September 25, 2025)BINANCE:XRPUSDT
CRYPTOCAP:XRP Mild Bearish Bias with Neutral RSI Hinting at Rebound Potential
Current Chart Analysis:
Overall Price Trend: XRP has declined from highs around 3.0 USDT earlier in the period, now at about 2.82-2.85 USDT (per chart labels). Recent candlesticks show a mix of red (bearish) with some green relief, suggesting easing selling pressure but overall downward bias. This aligns with a ~3.5% 24-hour uptick from broader data.
Ichimoku Cloud:Price is near or slightly below the cloud, a mild bearish signal indicating dominant downtrend, though the cloud is thickening slightly greenish (positive).
Tenkan-sen (red) below Kijun-sen (blue) in a bearish cross, but Chikou Span (lagging line) approaching from below offers hope for reversal. Cloud acts as resistance around 2.90.
RSI (Relative Strength Index): At 37.97 in the bottom panel—neutral, edging toward oversold (below 30). This implies slowing sells and potential short bounce, but no clear bullish divergence yet.
Volume and Momentum: High volume on red candles confirms selling, but trend lines (like green) are stabilizing. Price testing support near 2.80.
Analysis Summary: The chart leans Mildly Bearish overall, with downward momentum, but neutral RSI and recent recovery add room for temporary relief.
Here are the possible scenarios:
Base Scenario (Bearish, 60% probability): Price could test lower levels around 2.75-2.80 USDT if selling resumes (especially if cloud holds as resistance). This without a positive Ichimoku cross or strong green candle.
Alternative Scenario (Mild Bullish, 40% probability): A bounce to 2.90-2.95 USDT, if RSI rises above 50 and price breaks Kijun-sen. This would be short-lived, not altering the bigger bearish picture.
Monitor key levels: Support at 2.80, resistance at 2.90.

XRP Intraday long IdeaJournal Entry #8
The chart has shown a bullish divergence and currently at its breakup/down point.
im looking for opportunities to long :)
hello UPtober?

The key is whether it can rise above 3.0361
Hello, fellow traders.
Follow us to get the latest information quickly.
Have a great day.
-------------------------------------
(XRPUSDT 1D chart)
The key is whether it can rise above 3.0361 and sustain the price after the next period of volatility, around October 2nd.
This period of volatility is expected to continue until September 25th, and we should examine whether support can be found around 2.9092 and whether it can rise.
-
If the price falls below the M-Signal indicator on the 1W chart,
1st: 2.5102-2.6013
2nd: 2.1453-2.2582
We should check for support near the 1st and 2nd levels above.
-
If the price remains above the M-Signal indicator on the 1D chart, further upside is highly likely, so it's important to determine whether support can be found near 3.0361.
The best time to buy was when support was found at key support and resistance levels, or around the 2.1453-2.2582 range.
Currently, a new buy is possible when support is found near 3.0361.
However, since this does not fit the basic trading strategy, a quick and rapid response is required.
-
The basic trading strategy is to buy in the DOM(-60) ~ HA-Low range and sell in the HA-High ~ DOM(60) range.
However, if the HA-High ~ DOM(60) range rises, a step-up trend is likely, while if the DOM(-60) ~ HA-Low range falls, a step-down trend is likely.
Therefore, the basic trading strategy should be a segmented trading approach.
-
The HA-High ~ DOM(60) range on the 1D chart is currently 3.4037-3.4540.
Therefore, a rise to around 3.4037 is possible.
However, since the DOM(60) point on the 1M chart is formed at 3.0361, if the price rises above 3.0361 and maintains, a long-term step-up trend is likely.
Therefore, the current buying opportunity should be when support is confirmed around 3.0361.
-
(1W chart)
To rise above 3.0361 and maintain support, the upward trend should continue.
- The StochRSI indicator should be trending upward. Ideally, it should not enter the overbought zone.
- The On-By-Value (OBV) indicator should be trending upward. Ideally, it should remain above the High Line.
- The TC (Trend Check) indicator should be trending upward. Ideally, it should remain above the zero level.
If the above conditions are met, the upward trend is expected to continue.
-
Thank you for reading.
We wish you successful trading.
--------------------------------------------------

XRP is approaching to supply zone Market Structure is still in downtrend with the price approaching to our supply area, we can see a overbought level in the rsi indicating a potential reversal.
Additionally, GDP Growth Rate QoQ Final will start later at 8pm New York time so high volatility is expected but I'm seeing a bearish here because USD may have a stronger change.
Moreover, the price below our 4 hour 200 ema may tap from that supply area showing a much higher confluence for our bearish signal which act as a resistent level.

I was right about Xrp better to long now Strong rejection occurred alongside grabbing the sell side liquidity. Oversold in rsi indicating a strong reversal

XRP 4H Flash Model, long setupFlash Model, long setup.
Price swept liquidity + broke structure. Now it’s retracing into demand.
The play is simple: If there’s a clear imbalance, target the imbalance.
Invalidation = break under demand.
All the best
Xrp is gonna grab buy side liquidity Xrp still in downtrend pressure after respecting our marked out supply but I'm seeing a buying opportunities if the liquidity grabe can be successful

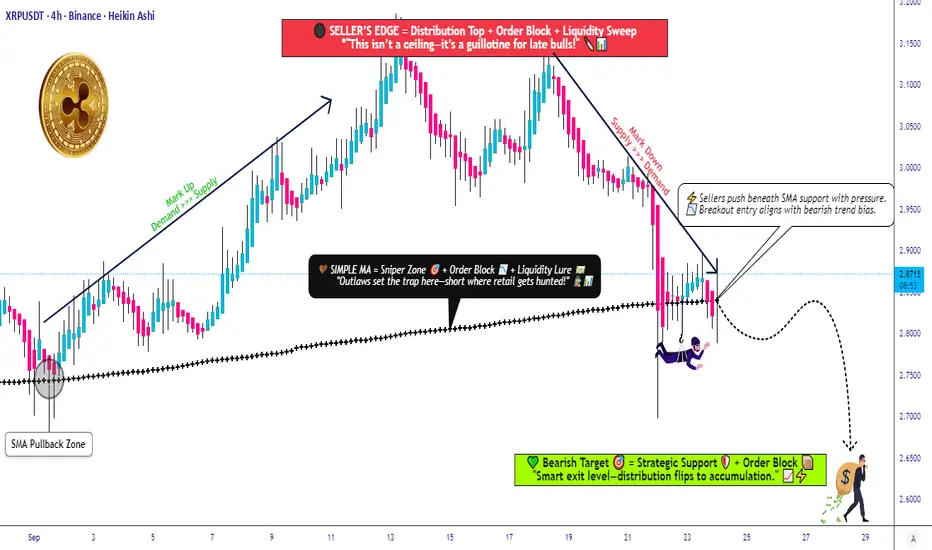
Ripple vs Tether: Key Technical Levels Every Trader Should WatchXRP/USDT | "RIPPLE vs TETHER" Market Wealth Strategy Map (Swing/Day Trade)
📊 Plan:
We’re eyeing a bearish confirmation if candles break below the 0.786 Fibonacci zone + SMA breakout @ 2.8300. At that point, sellers could gain momentum and dominate short positioning.
💡 Thief Strategy Highlight → Using a layered entry style (multiple limit orders). This method allows staggered entries rather than “all-in at once.”
🎯 Layered Short Entries (Sell Limits):
2.9300
2.9000
2.8800
2.8600
(You can expand layers based on your own strategy adjustment.)
🛑 Stop Loss (Thief SL):
Placed near 3.0000 — but ⚠️ please note: Risk management is personal. Thief OG’s — make your own choices. My SL is just an example.
✅ Target (Thief TP):
The “police barricade” (aka strong resistance zone with overbought pressure + possible trap) aligns around 2.6500. That’s where profit-taking may be wise before liquidity hunters catch us.
Again, this is flexible — adjust TP to your own risk/reward plan.
🔗 Related Pairs to Watch
$BTC/USDT → Major market leader, XRP often follows Bitcoin’s momentum.
$ETH/USDT → Correlation with altcoin sentiment; strong ETH moves ripple across XRP.
$ADA/USDT & $SOL/USDT → Competing Layer-1s, often mirror similar retail/institutional flows.
$XLM/USDT → Direct cousin of XRP, highly correlated in macro movements.
Watching these can help confirm broader market bias & correlation flows.
✨ “If you find value in my analysis, a 👍 and 🚀 boost is much appreciated — it helps me share more setups with the community!”
⚠️ Disclaimer: This is a Thief style trading strategy shared just for fun & community engagement. Not financial advice. Manage your own risk, make your own decisions.
#XRP #Ripple #CryptoTrading #SwingTrade #DayTrading #Fibonacci #TechnicalAnalysis #CryptoCommunity #TradingStrategy
XRP Technical Setup | Bullish Confirmation or Resistance Trap?🕵️♂️ XRP/USDT – "RIPPLE VS TETHER" Wealth Strategy Map 💰⚡
Idea Type: Swing/Day Trade
Market Mood: Bullish confirmed ✅
📊 Plan Breakdown
📈 Setup: Bullish bias confirmed with TMA (Triangular Moving Average) breakout ➕ pullback.
🕯️ Extra Confirmation: Heikin Ashi Doji → Bull Reversal spotted.
🎯 Execution Style: Thief Strategy = Layered limit order entries (stealthy stacking style).
🎯 Entry Plan (Layering Method)
Multiple buy layers placed around these zones:
💎 3.0400
💎 3.0600
💎 3.0800
💎 3.1000
🔑 Traders can add or reduce layers depending on personal risk preference.
🛑 Stop Loss (Thief’s Shield)
Suggested defense line around 3.0000.
⚠️ Note to Thief OGs: SL is personal. Manage risk wisely, protect your capital.
🎯 Target (The Escape Plan 🚪💨)
Overhead zone = Electric Shock Fence ⚡ (major resistance + overbought trap).
Suggested escape target: take profit before getting trapped at resistance zone.
⚠️ Reminder: Not financial advice — adapt targets to your style.
🔍 Related Pairs to Watch (Correlation Check)
💵 BITSTAMP:BTCUSD → Bitcoin often leads XRP momentum.
💵 BITSTAMP:ETHUSD → Ethereum trend can mirror altcoin sentiment.
💵 COINBASE:XLMUSD → Stellar has historic correlation with XRP moves.
💵 CRYPTOCAP:USDT.D (Tether Dominance) → Watching stablecoin flows gives clues about liquidity shifts.
👑 Thief Notes:
Dear Ladies & Gentlemen (Thief OG’s) 🕶️💼
This map is for educational & strategic illustration.
I’m not recommending you to strictly follow my SL/TP.
Manage your own layers, steal the opportunity, and escape with your own timing.
✨ “If you find value in my analysis, a 👍 and 🚀 boost is much appreciated — it helps me share more setups with the community!”
#XRP #XRPUSDT #Crypto #CryptoTrading #SwingTrade #DayTrade #LayeringStrategy #HeikinAshi #TMA #Altcoins #ThiefTrader

XRPUSDT: Downtrend and Future Trading StrategyHello traders, based on the chart and the latest news on XRPUSDT, the current trend is leaning towards a downtrend. The gradually decreasing resistance indicates strong selling pressure, and XRP is trading below the Ichimoku Cloud, confirming the short-term bearish trend. XRP has dropped sharply from $2.87 to $2.77 on September 23, 2025 , due to a contract liquidation event worth $1.7 billion, mainly from long positions, causing further price correction.
With resistance at $2.8900, if the price cannot break through this level, the likelihood of a further decline towards $2.6200 is high. This is the next key support level to watch. If the downtrend continues, this support zone could be tested again.
Trading Strategy: Watch for selling opportunities near the $2.8900 resistance and set a stop-loss if the price moves above this level.

$XRP 4-HR: bearish Market Structure, bullish Gartley nullifiedCRYPTOCAP:XRP has turned completely BEARISH on the 4-HOUR chart after a series of lower lows and lower high. Market Structure is King. I do not hold longs when market structure is bearish.
And you should not either, unless you hate money, of course.
So below horizontal support/resistance zone, below both 50 & 200 moving averages (and yellow 50 MA about to cross below green 200 MA, that would be a DEATH CROSS).
This CRYPTOCAP:XRP could look very ugly if we see a breakdown below the DOUBLE BOTTOM formed during the flashcrash two days ago.
A potential BUY ZONE is again around the $2.7 mark, this support has worked many times already.
Let's see of the #XRPArmy saves this coin from falling from the cliff.
Btw, bullish Gartley Harmonic pattern has also failed, so everything is looking not very healthy.
I'm happy to have closed the long, in other words👽💙

Buy XRPUSDT NowThe pair XRPUSDT has moved to a key zone and it is aligned with my buy idea. I am sure XRP will rise to $3.1500 soon.

Xrp Update XRP
On Bitget, XRP’s technical summary shows a mix: Buy is slightly favored via moving averages, but oscillators are more neutral to cautious.
Barchart’s technicals indicate XRP is trading below its 20-day MA, with the 50-day MA also above price — a sign that current trend pressure is to the downside.
Investing’s XRP technicals (OKX data) provide detailed buy/sell lineups, suggesting mixed momentum depending on which indicator you lean on.
Insight: XRP is at a crossroads. It faces resistance from the MAs above, and support zones below are now more important. If XRP can muster strength and break past these averages, a push upward is possible, but a failure here may lead to more correction.

Market Update: BTC, ETH, SOL & XRP OutlookIn this video, I shared an update on Bitcoin, Ethereum, Solana, and Ripple.
Bitcoin has completed all 5 upward waves, but there’s still a chance to see one more push higher. If the correction starts right now, we could see a reaction above 113K , with support expected in the 112,700–111,700 zone.
The rest of the market will mostly follow Bitcoin.
BINANCE:ETHUSDT
Ethereum has already bounced 4 times from the ascending trendline and is aiming to break the descending trendline.
BINANCE:SOLUSDT
Solana is approaching our target zone.
BINANCE:XRPUSDT
XRP has climbed back above the important 200 MA.
