USDTXRP.P trade ideas

Forecast for XRPUSDT 30th September 2026 For the next week forecasting XRP to ~$2.9 followed by a short sell to ~$2.7 then a large move to ~$3.1 then a huge move to the downside.

EUR USD AUD NVDA MSFT AVGO S&P500 BTC XRP Weekly InsightsIn this video, we dive into the key market movements and outlooks for major financial instruments over the past week. Highlights include:
Analysis of currency pairs: EUR/USD and AUD
Trends and technical setups for leading tech stocks: NVDA, MSFT, AAPL, AVGO
The S&P 500’s performance and what it suggests about broader market direction
Developments in cryptocurrency, with a focus on BTC and XRP
Whether you’re a trader, investor, or just interested in macro markets, this video gives you a consolidated, data-driven snapshot of where things stand and what to watch next.

XRP USDT Hello my friend, Ripple is currently in a triangle and is currently in a very good support area, especially since it has now reached a very good pivot at 2.7. I predict that Ripple will reach a buy price of 4.4. Thank you for reading my analysis and giving your opinion.

XRP ETF Approved, But Price Hurts—Will Big Players Act?At the time of writing, XRP trades at $2.84, just under the $2.85 resistance. A flip of this barrier into support would likely signal the beginning of a reversal, strengthening bullish sentiment. Traders are closely watching this zone for confirmation.
If support from LTHs holds, XRP could climb toward $2.94 in the short term. Breaching this level would pave the way for a further rise to $3.02, signaling broader recovery potential and invalidating near-term bearish concerns.
However, if market conditions worsen or LTHs shift their strategy to selling, XRP could lose momentum. The altcoin risks sliding toward $2.75 or even deeper to $2.64, putting bullish expectations in jeopardy and prolonging the consolidation phase.

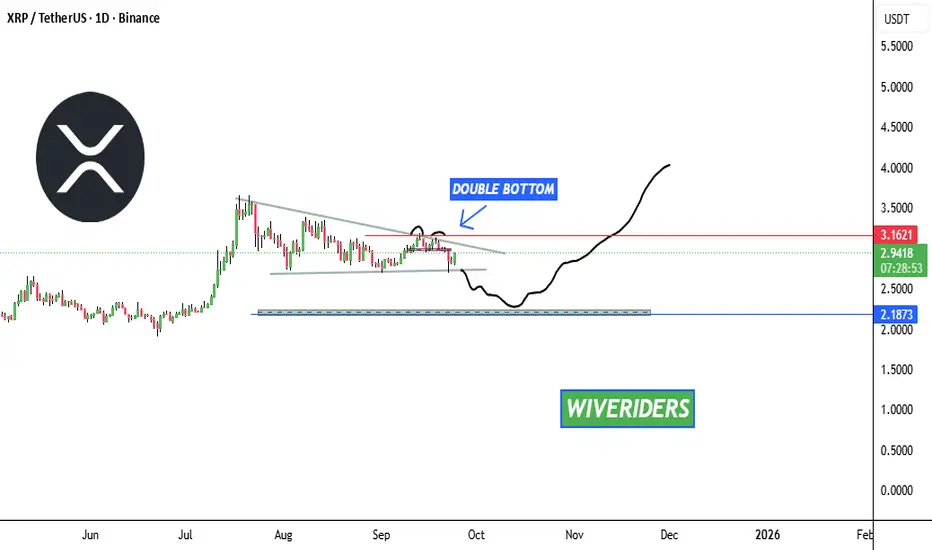
XRP Daily Market Update📊 CRYPTOCAP:XRP Daily Market Update
CRYPTOCAP:XRP is forming bullish patterns overall ✅ but here’s what’s next:
1️⃣ Around $3.1621 there is a Double Top bearish pattern. XRP needs to break this level with confirmation to indicate the trend remains bullish.
2️⃣ Another option ⚠️ — XRP could cross down, grab liquidity, hunt stop-losses, and reach the green support zone around $2.1873. From there, buyers may step in again since strong accumulation and volume exchanged at this level.
🔎 On the higher time frame, XRP is still bullish 📈 — but this is the daily scenario at the moment.
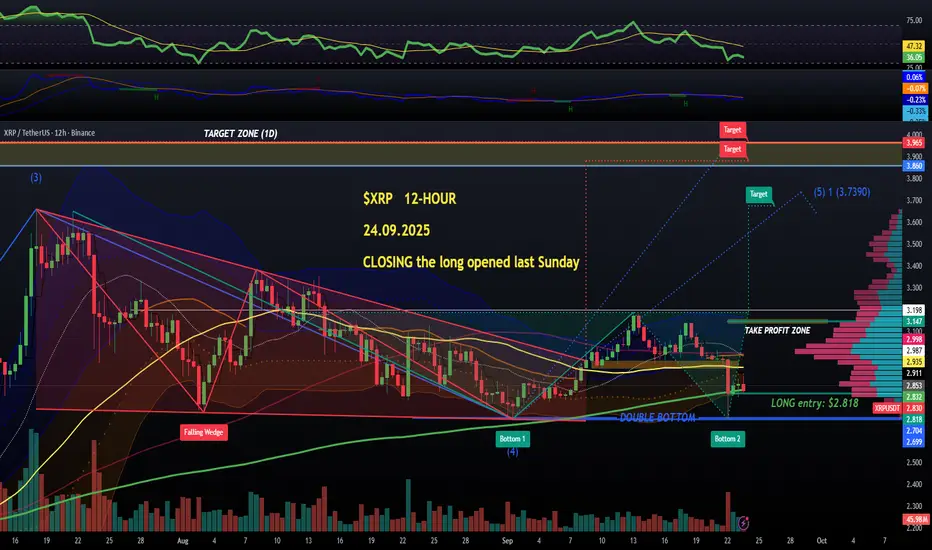
$XRP... closing my LONG position opened last Sunday &2.818CRYPTOCAP:XRP is losing 200 MA on the 12-HOUR chart so I'm closing my Sunday long position (opened here at $2.818. No loss, but this is just bearish at the moment.
Still might recover but I have closed the position mainly due to BULLISH CRYPTOCAP:BTC dominance charts.
I do not go against the trend, and the trend is negative for alts this week. I will try and catch a potential flash-crash based on smaller timeframes, stay tuned, the 4-HOUR chart incoming👽💙
DeGRAM | XRPUSD held the $2.8 level📊 Technical Analysis
● XRP rebounded strongly from the 2.76 support line, rejecting the breakdown and signaling a bullish reversal.
● Structure shows a recovery setup within the ascending channel, with upside potential toward the 3.67 resistance zone.
💡 Fundamental Analysis
● Ripple benefits from sustained optimism in institutional adoption, while easing regulatory concerns support medium-term investor confidence.
✨ Summary
XRP defends 2.76 support, pointing to continuation higher with 3.67 as key resistance. Structure favors medium-term bullish momentum.
-------------------
Share your opinion in the comments and support the idea with a like. Thanks for your support!

XRP Update📊 CRYPTOCAP:XRP Update
If XRP moves back to the red resistance zone, wait for confirmation before entering a short position. ⚠️
This is the zone where sellers could step in again and push the price down from this level. 📉

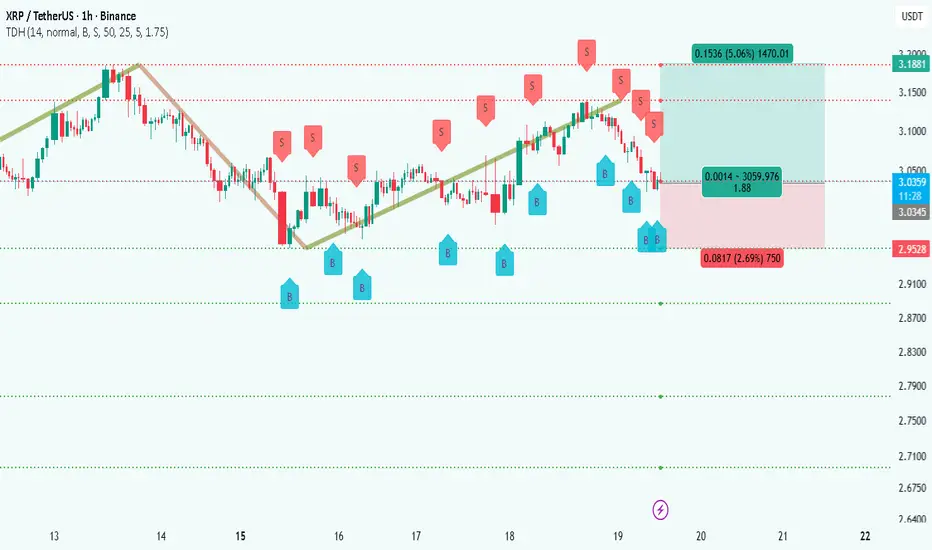
$XRP in price RECOVERY after hitting a DOUBLE BOTTOM supportOk, a proper view for CRYPTOCAP:XRP since I got into a long position a few hours ago.
Hit support at $2.70 clearing the main cluster of late liquidations there and forming a double top with a neckline at $3.18.
Most of the liquidity is now just above $3.1, so there is a reason for this price to go 10% from here.
Entered at $2.82, now monitoring on smaller timeframes as crypto markets look rather weak with CRYPTOCAP:BTC dominance chart climbing up again.
So, this is a classical rebound trade, and I cannot pretend not to expect further violence, but #xrp is looking very good on the XRP versus CRYPTOCAP:ETH chart too, so that's why I'm in this long.
Stop loss always on, and you do you💙👽

XRP Faces Bearish Momentum as MACD Crosses DownXRP/USD’s one-day chart shows a bearish MACD crossover, signaling that the token has entered a renewed downtrend.
The MACD, a key momentum indicator, generates sell signals when its line crosses below the signal line, indicating fading upward momentum.
This is XRP’s first bearish crossover since September 8, reflecting a shift in market sentiment from bullish to bearish and suggesting that traders may reduce positions.
Adding to the negative outlook, XRP has dropped below its 20-day exponential moving average (EMA), which now acts as dynamic resistance at $2.97. The 20-day EMA emphasizes recent price action, and trading below it typically signals rising short-term selling pressure.
Together, the MACD crossover and the EMA breach indicate that XRP could face further downside in the coming trading sessions, keeping the altcoin’s performance under pressure.

XRP/USDT: Wave 5> Primary wave count: XRP is currently in black wave 5, with a target near $4.00 or higher.
> Validation level: This count remains valid as long as price stays above wave 1 high at $2.6549.
> Current resistance: Price is facing resistance at the $3.15 level (gray zone).
> Breakout signal: A move above $3.15 would signal strong bullish momentum.

Why Greed Controls Most Traders During Market PumpsHave you ever felt greed controlling your decisions?
Every trader, even professionals, has fallen victim to this emotion at least once.
This analysis provides strategies to understand greed and avoid emotional trading mistakes.
Hello✌️
Spend 2 minutes ⏰ reading this educational material.
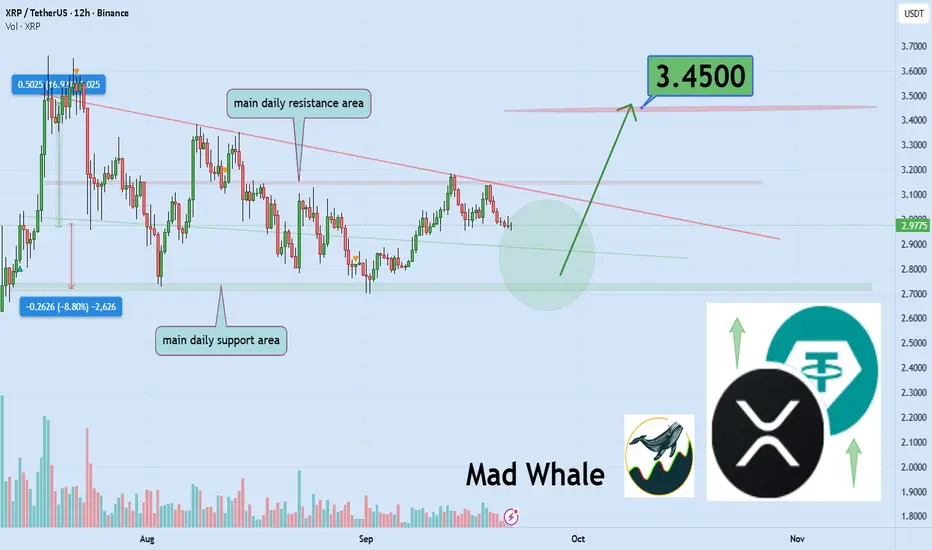
🎯 Analytical Insight on Ripple:
XRP is testing a strong support while facing key trendline resistance near 3.10–3.15. A confirmed breakout with solid volume could drive a 16% rally, targeting 3.45. 📊🚀
Now , let's dive into the educational section,
📈 Market Psychology and Trader Greed
Greed is one of the most powerful drivers in the crypto market.
Sudden pumps trigger FOMO in traders’ minds.
Emotional decisions often lead to liquidation or missed profits.
Understanding how the market plays with emotions is the key to success.
Traders often enter trades during high emotions without logical analysis.
Recognizing market psychology reduces risk and enables smarter decisions.
Fear and greed create a constant cycle that must be understood.
Emotional reactions drive sharp short-term volatility.
Being aware of these cycles helps manage opportunities more effectively.
The market constantly moves with traders’ emotions, always seeking greed.
⚡ Common Trader Mistakes
Entering the market based solely on news hype
Holding too long during pumps
Ignoring technical indicators
Making decisions under others’ FOMO influence
Overusing leverage
Recognizing these mistakes is the first step to controlling greed.
🛠️ TradingView Tools and Indicators
RSI: Identifies overbought and oversold levels, preventing emotional trades.
MACD: Signals trend changes and logical entry/exit points.
Volume Profile: Reveals psychological support and resistance levels.
Moving Averages: Shows the dominant trend, reducing the impact of short-term emotions.
Alerts: Notifies you so you can act timely without constantly watching the chart.
Combining these tools provides a practical and scientific way to manage greed.
🔍 Market Psychological Cycles
The market always cycles through fear and greed.
During price rallies, greed dominates.
During declines, fear paralyzes traders.
Focusing on trends and indicators reduces emotional impact.
Combining technical signals with psychological awareness produces better decisions.
This scientific approach increases the value of your analysis in the eyes of editors.
🔔 Summary
Greed always exists, but it can be controlled with tools and knowledge.
Patience and risk management make the difference between success and failure.
Momentary emotion should never dictate your final decision.
🌟 3 Key Recommendations for Market Success
Always analyze indicators before entering a trade – never let emotions dictate your actions.
Set stop-losses and manage risk – protecting capital is more important than short-term gains.
Practice self-awareness – understanding your fear and greed is a powerful tool for successful trading.
✨ Need a little love!
We pour love into every post your support keeps us inspired! 💛 Don’t be shy, we’d love to hear from you on comments. Big thanks, Mad Whale 🐋
📜Please make sure to do your own research before investing, and review the disclaimer provided at the end of each post
XRP/USDT on the 15 Minute. Bullish divergence.On the XRP/USDT 15 min. I see bullish divergence on the MACD and RSI. An inverse H/S pattern is forming nicely on the 5 min. Target for Long 3.0052 USDT.

XRP at Crossroads: Will $3.22 Break or $2.71 Collapse?XRP is trading just above the descending trendline that’s been active since mid-July, showing signs of compression and potential breakout.
Price is hovering between key resistance at $3.0166–$3.2164 and support at $2.7149–$2.7857, forming a tight consolidation range.
Bullish breakout above $3.17 could trigger a rally toward $3.37–$3.64, especially if ETF filings gain traction.
Bearish breakdown below $2.71 may lead to a drop toward $2.50–$2.26, as suggested by recent institutional liquidations and technical pressure.

XRP - Triangle Breakout, Eyes on 3.2?XRP broke out of its descending triangle on the daily and shifted the structure bullish. Price is now trading inside the 3.00–3.20 resistance band.
This zone is key 🔑. It’s prior supply and the top of the range. A clean daily close above 3.20 would open 3.40, then 3.60+ inside a fresh markup leg.
If buyers fail to clear it, I’ll watch for a healthy dip toward 2.80–2.90 (triangle base + demand) to reload. Bias stays bullish while the 2.70–2.80 floor holds.
What’s your plan - buy the break above 3.20 or wait for a retest into 2.80–2.90? 🤔
⚠️ Disclaimer: This is not financial advice. Always do your own research and manage risk properly.
📚 Stick to your trading plan regarding entries, risk, and management.
Good luck! 🍀
All Strategies Are Good; If Managed Properly!
~Richard Nasr

XRP; The double top pattern is fake!!!Hello friends
Regarding the price channel we had, after a long time this channel has been broken and now a double top pattern has formed which looks fake and wants to trap sellers.
If the price continues to move upwards, it can move to the specified areas.
If the formed pattern really wants to act and we have a price drop, the bottom of the channel and its midline are good supports.
*Trade safely with us*
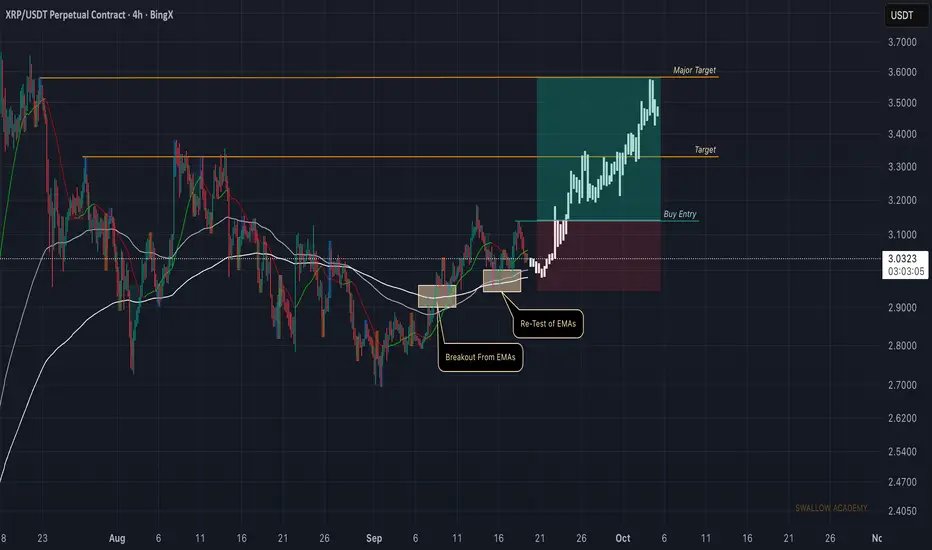
Ripple (XRP): Waiting For Proper Break of Structure | Bullish XRP has been holding well above the EMAs after the breakout, and candlesticks show steady buyer dominance with higher lows forming.
As long as sellers fail to close below EMAs, momentum should keep pushing toward the first target and eventually the $3.6 major target. Any close under EMAs would shift the structure, but for now, bulls are in control.
Swallow Academy
XRPUSDTAccording to the chart, there are no clear signs of a structural change in the overall price trend. In the upper timeframe, we do not have any lower lows than the previous major lows, and this will be a sign of a continuation of the upward trend until we see a lower low than the previous major low.
In the lower timeframe, the price is in a descending channel, where I do not see any scary selling pressure.
The 2.5 range is an important and valuable range.
If the price reaches this range, we need to see what reaction it will show.
Pay attention to the red box, which is similar to the current price behavior.

XRPUSDT Bullish Scenario Updated🔎 Technical Outlook
XRP is currently trading around 3.03 – 3.04 USDT, after bouncing from a key support zone near 2.95 USDT. The chart shows a sequence of higher lows with multiple buy signals clustering near the base, suggesting strong accumulation.
The resistance zone sits around 3.18 USDT, which is also marked as your target area. A clean breakout above minor intraday resistance at 3.05 USDT would open the way for bullish continuation. The structure favors buyers as long as price holds above 2.95 support.
________________________________________
📈 Trade Setup (Bullish Bias)
• Entry: 3.03 – 3.05 USDT (current market zone)
• Stop-Loss: 2.95 USDT (below recent support & invalidation level)
• Take Profit 1: 3.12 USDT (intermediate resistance)
• Take Profit 2: 3.18 USDT (major resistance target)
• Risk/Reward: ~1:2
________________________________________
🛡 Risk & Trade Management
• 🔒 Partial Profit Booking: Secure some profits at 3.12 USDT to reduce risk exposure.
• 📈 Trailing Stop: Once TP1 is hit, move stop-loss to breakeven (3.03) and trail along higher lows to ride momentum.
• 🚫 Invalidation: If XRP breaks below 2.95, the bullish setup is invalid, and exiting quickly protects capital.
________________________________________
✅ Summary
XRP is showing bullish intent after defending the 2.95 support zone and looks set to retest 3.12 – 3.18 USDT. A layered profit-taking approach with a trailing stop allows you to capture the move while managing downside risk effectively.
________________________________________
XRP - Small Dip Before a Big RipVery surprised at how obvious it is to read this price action on XRP, tells me there's a lot of attention/people and volatility involved with this.
Expecting to finish a small wave 4 before a decent breakout.
Overall Wave-Count Confidence: Average

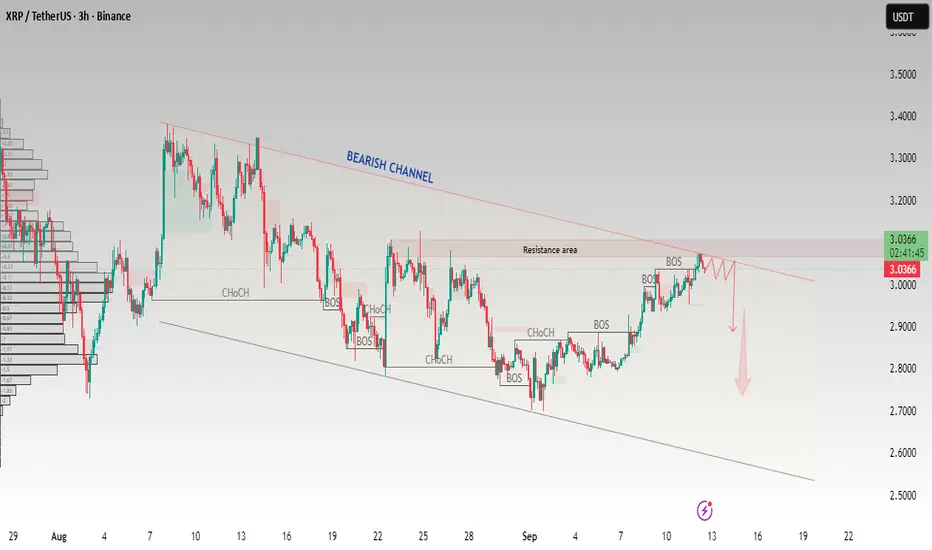
XRP/USDT – Testing Resistance Inside Bearish ChannelXRP is trading within a clear bearish channel and has reached the resistance area near 3.05 – 3.10. Price is showing rejection signs from the upper boundary of the channel, which may trigger a downside move if sellers hold control.
Key Points:
Bearish channel structure in play
Resistance zone: 3.05 – 3.10
Potential rejection at channel top
Downside target zones: 2.90 and below
This setup favors bears as long as XRP remains below the channel resistance. A confirmed breakout above resistance would invalidate the bearish view.
This analysis is for educational purposes only and does not constitute financial advice. Trading cryptocurrencies carries high risk; please trade responsibly and use proper risk management
XRP Price Eyes $3.75 on Bullish Chart BreakoutBINANCE:XRPUSDT price is trading close to $3.10, pressing against the neckline of an inverse head-and-shoulders pattern. This is one of the strongest reversal signals in technical analysis. The neckline sits around $3.21, and if BINANCE:XRPUSDT closes a daily candle above it, the breakout would confirm a bullish setup.
The height of the pattern, measured from the $2.69 head to the $3.21 neckline, projects a move of about $0.54. Adding that to the neckline gives a target near $3.75, which would be a fresh all-time high and about 21% above current levels.
Key support for BINANCE:XRPUSDT rests at $2.94, aligned with the right shoulder, while a fall back under $2.69 would cancel the bullish case. For now, momentum is building, and the chart shows buyers have the upper hand.
Supplementary data also backs the move: long-term holders have almost stopped selling, while short-term cohorts are adding supply. Together, technicals and sentiment give BINANCE:XRPUSDT price room to climb higher.
