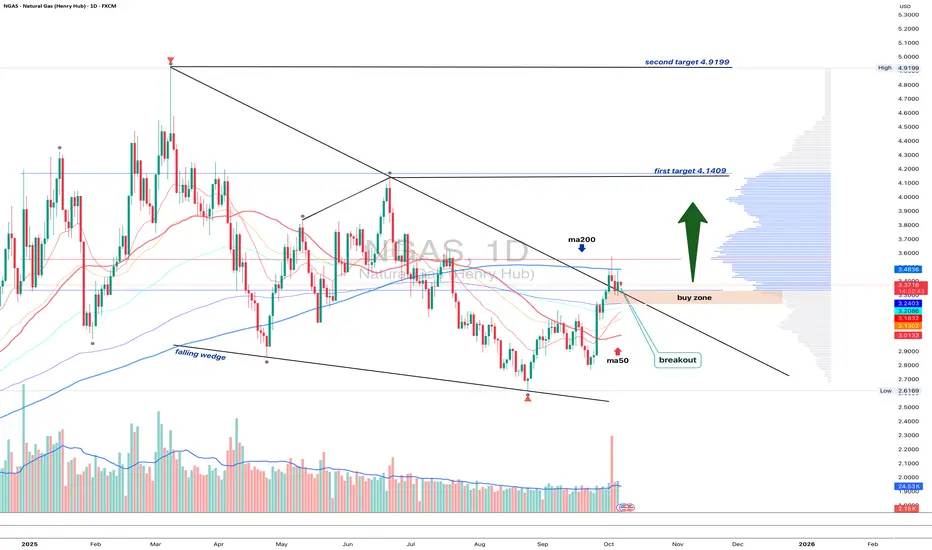
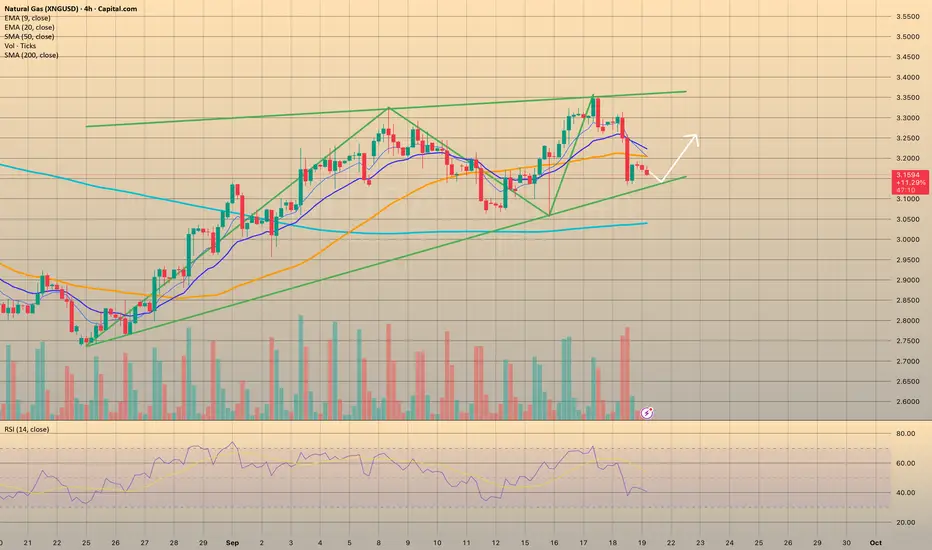
NGAS 1D - bulls waiting for the green lightOn the daily chart, Natural Gas has broken out of a falling wedge, but price remains below the MA200, while EMA still hovers above it - a mixed signal showing short-term hesitation within a longer-term downtrend.
The 3.10–3.20 buy zone remains key - that’s where the retest area aligns with short-term support. If buyers can reclaim the EMA and push above the MA200, the next upside targets are 4.14 and then 4.92.
Volume on the breakout supports growing bullish interest, while fundamentals - like rising seasonal demand - may soon add more fuel to the move.
Tactically , watch how price behaves near MA200. Once EMA flips back on top, momentum could accelerate fast. Until then, the market’s like a gas burner waiting for that click - ignition pending
Trade ideas
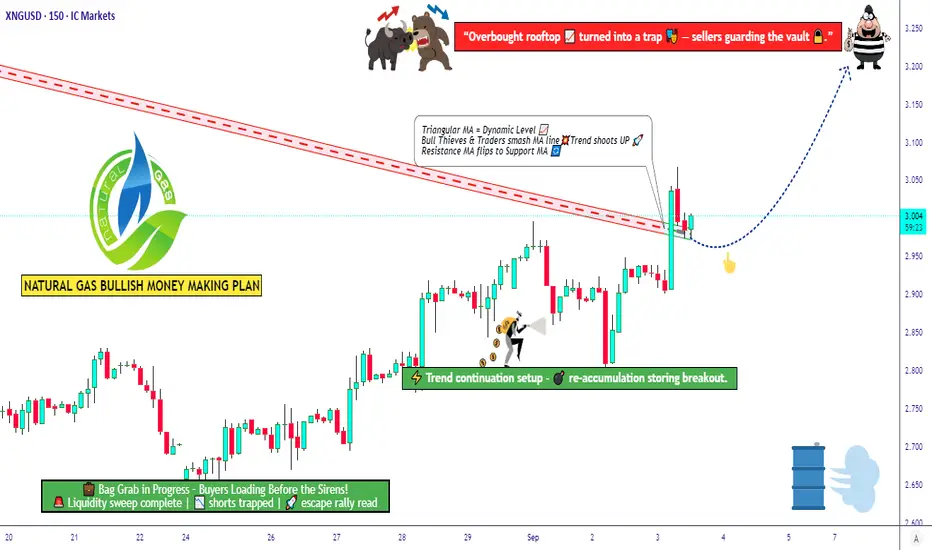
Natural Gas Market Outlook ‖ Bullish Breakout with Risk Control💎 XNG/USD Natural Gas – Thief Trader’s Money Loot Plan (Swing/Scalping) 💎
🎯 Trade Plan (Bullish Setup)
Strategy: Bullish triangular moving average breakout, aligned with Fibonacci 0.382 level.
Entry (Layered Style): Using multiple limit orders (Thief layering strategy). Example entries:
$2.900
$2.950
$3.000
(You may add more layers depending on your risk appetite.)
Stop Loss: $2.800 (Thief SL).
⚠️ Note: Adjust SL based on your own risk tolerance and strategy.
Target Zone: Major seller pressure expected near $3.400 — our escape target set at $3.200.
📌 Reminder: Take profit at your own discretion — you control your loot, not me.
❓ Why This Setup?
✅ Technical Basis: Bullish triangle breakout + Fibonacci 0.382 retracement signals continuation upside.
✅ Layered Entry Advantage: Reduces risk by scaling in across levels, catching volatility without FOMO.
✅ Market Structure: Current consolidation near $2.93 provides a solid base for accumulation.
✅ Sentiment Balance: Both retail & institutional lean bullish, supporting potential breakout momentum.
✅ Macro Tailwinds: Strong LNG export growth and expected winter heating demand underpin the long thesis.
This plan aligns both short-term technicals and long-term fundamentals, creating a high-probability swing/scalping opportunity.
🌟 Natural Gas (XNG/USD) Market Report - September 3, 2025 🌟
📊 Current Price Snapshot
Spot Price: $2.93 per MMBtu (Henry Hub benchmark) 📉
(Holding steady after recent dips, reflecting balanced supply/demand.)
😊 Trader Sentiment Outlook
Retail Traders: 55% Bullish 🟢 | 35% Bearish 🔴 | 10% Neutral ⚪
(Optimism from LNG demand + weather, but some concern on inventories.)
Institutional Traders: 60% Bullish 🟢 | 30% Bearish 🔴 | 10% Neutral ⚪
(Focused on exports & production stability, while cautious on oversupply.)
📌 Overall Mood: Mildly positive — upside potential if weather demand rises.
😨 Fear & Greed Index
Current Level: Neutral (Score ~50/100) ⚖️
Fear factors: Storage 5% above 5-year avg, mild summer demand.
Greed drivers: LNG exports + winter demand expectations.
Market vibe = balanced — neither panic selling nor euphoric buying.
📈 Fundamental & Macro Score
Fundamental Score: 7/10 🟢
Strong LNG shipments (31% growth expected).
Inventories manageable, production +3% YoY.
Key watch: Permian & Haynesville supply shifts.
Macro Score: 8/10 🟢
Rising global energy needs (AI, data centers).
Autumn cooling trend boosts heating demand.
Asia’s growth keeps exports flowing.
🚀 Overall Market Outlook
Bias: Bullish (Long) 🟢📈 — ~60% confidence.
Natural gas could push toward $3.60/MMBtu by late 2025 if balances tighten and exports expand.
Winter could spark extra upside rallies ❄️🔥.
🔗 Related Pairs to Watch
FXOPEN:XNGUSD
NYMEX:NG1!
ICMARKETS:XBRUSD (Brent Crude)
FOREXCOM:USOIL (WTI Crude Oil)
OANDA:XAUUSD (Gold for risk hedge)
TVC:DXY (US Dollar Index – inverse correlation play)
✨ “If you find value in my analysis, a 👍 and 🚀 boost is much appreciated — it helps me share more setups with the community!”
#XNGUSD #NaturalGas #SwingTrading #Scalping #CommodityTrading #EnergyMarkets #Fibonacci #BreakoutStrategy #LayeringStrategy #TradingViewAnalysis #ThiefTrader
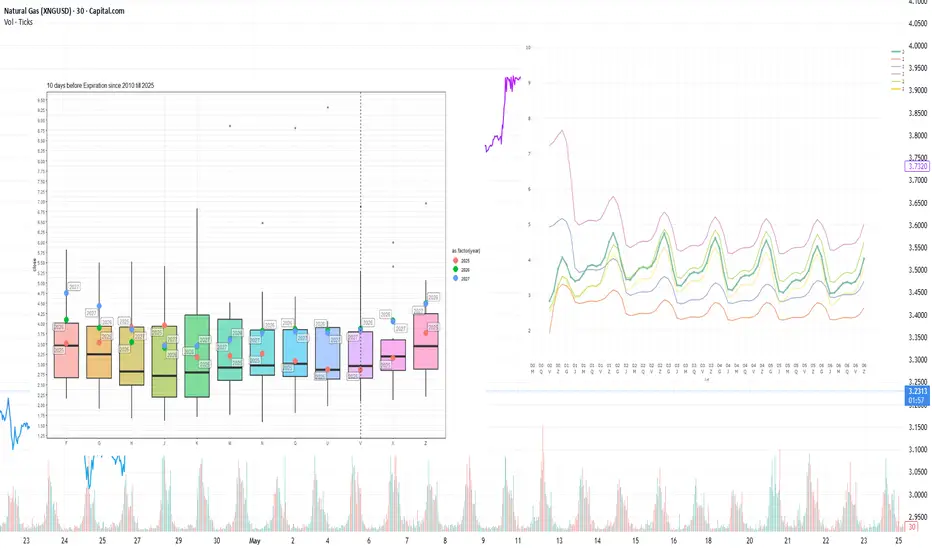
LNG Week 40: 64 BCF Storage Boost Meets Cooling Demand Drop*Due to the platform's features, the charts are arranged in sequence from left to right, from the first to the Eighth chart.
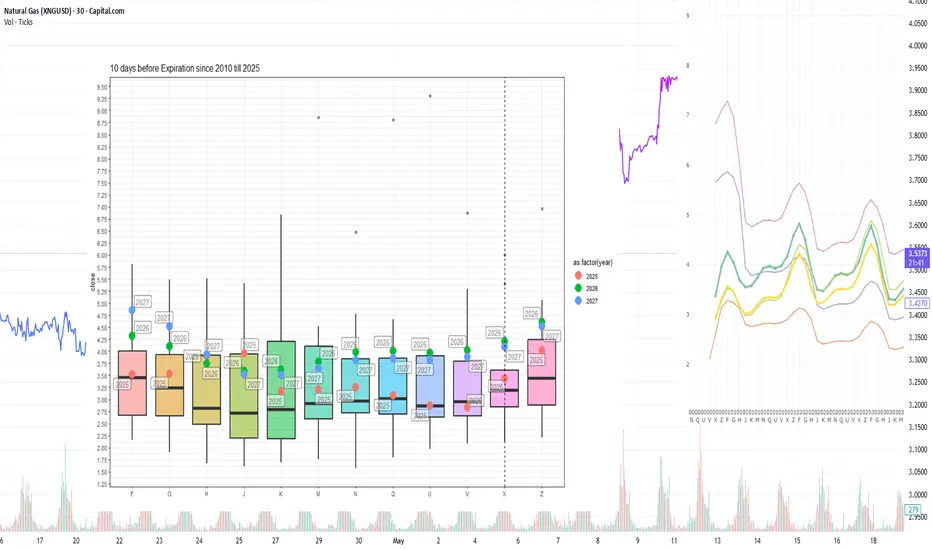
Current prices compared to price dispersion 10 days before expiration by month since 2010
The next NGX25 contract is trading above the 10-day average level before expiration and is showing significant volatility during this period. Prices for 2026 winter contracts continue to remain above the upper limit of the interquartile range, reflecting a steady upward trend ahead of the winter period.
Forward curve compared to 2020-2025
The shape of the forward curve in 2025 remains stable and converges even more closely with the configurations observed in 2023 and 2024 for similar dates. This trend is most evident for contracts with delivery terms of three years or more, where there is a steady convergence towards historical price levels.
Current stocks and forecast for next week compared to 2019-2024
According to the forecast for week 39 (September 22–28), underground storage stocks will increase by +64 BCF to reach 3,572 BCF, exceeding the level for the same week last year. The growth in stocks is supported by high production volumes, which remain the main driver of stock growth.
Weekly HDD+CDD sum based on current NOAA data and forecast for the next two weeks compared to 1994-2024
In week 40 of this year, HDD+CDD values for the continental United States remain significantly below the average values for the last 30 years of observations, as clearly shown in the graph for 2025. The forecast for week 41 also indicates that this trend will continue: a further decline in values relative to historical levels is expected, which may continue to exert downward pressure on demand and energy prices.
Explanation of the graph: the candles represent quantiles for 30 years from 1994 to 2024. Red dots represent 2024, green dots represent 2025, and blue dots represent the 2025 forecast.
Weekly HDD+CDD total based on current NOAA data and forecast for the next two weeks compared to 1994-2024 by region
A steady trend is observed in the leading regions: HDD+CDD values in 2025 remain below the historical averages for 1995–2024 in virtually all areas. The lag in indicators corresponds to the generally mild weather of the season and reduced energy demand for heating and cooling, which is recorded in all major regions.
Weekly total supply/demand difference compared to 2014-2024
This week, the difference between supply and demand in 2025 is at the average values for 2014–2024.
Number of days for delivery from warehouses
The graph shows the number of days of supply from storage alone, based on current consumption levels. In February–March 2025, reserves will be at 10–18 days, which is comparable to or slightly below average. In May–August, reserves will increase to 25–35 days, which is slightly below the 10-year average. At the beginning of October 2025, the number of days of consumption from reserves will have increased to 35 days, which is at the lower end of the IQR. The moderate level of storage adequacy to meet current demand creates a fundamentally tighter market, where even moderate production disruptions or minor spikes in demand can cause disproportionate price reactions, especially in late winter and early spring.
Anomalies in weather (HDD+CDD) and fundamental factors
Overall, fundamental factors and weather anomalies are within the expected range, with no systemic deviations, except for isolated declines in LNG exports caused by technical work at individual terminals.
This analysis was conducted in cooperation with Anastasia Volkova, analyst of LSE.
Natural Gas: Buy The Rumor Sell The NewsNatural gas spiked higher in the morning session on a strong inventory report.
Natural Gas inventories came in at 53B vs 66B est.
This report is showing a greater demand likely due to the colder temps.
In the afternoon Natural Gas reversed from the highs and sold off.
Ending the day with a Daily topping tail.
Technically the chart pattern in still strong. The 200 MA should be observed as bulls will want to defend that price level.
The Chart is still showing $4.00 target unless we see a failed breakout.
We netted a lovely day trade short today on the live stream.

"Natural Gas: Sell the Weather Spike, Eyeing 3.600 Retracement"💡 NATGAS Sell Setup (Swing/Short-term Idea)
Current Zone: 750–800 (upmove driven by short-term weather forecast & low inventory)
Context: Compared to last year’s levels, Natgas is already trading in overbought territory.
View: A retracement is highly probable from this zone.
Target: Expect downside towards 3.600 at least.
Bias: Selling preferred at higher levels. Buying not recommended.
Risk Note: Weather-driven spikes may cause volatility, manage SL accordingly.

Natgas short - 61.8% retracementNatgas at potential short zone - 61.8% retracement of prior dip
Try puts here

Natgas sell zone reaching🚨 XNG 15-min Chart Update
Max Upside: 3.698
Action: Selling recommended around 3.698
Buying: Not advised at this level
Reason: Price likely to drop from resistance; shorting gives better risk-reward
📌 Trade safe & use proper stop-loss!

Natural Gas Price Hits 2.5-Month HighNatural Gas Price Hits 2.5-Month High
As the XNG/USD chart shows today, natural gas prices have risen above $3.600/MMBtu for the first time since mid-July.
According to media reports, the rise in gas prices has been driven by:
→ Weather models forecasting colder conditions, suggesting the heating season may begin earlier than expected;
→ An EBW Analytics Group note highlighting short-covering activity in the market, which has accelerated the rally (a short squeeze effect).
At the same time, chart analysis suggests that the upside potential may be limited.
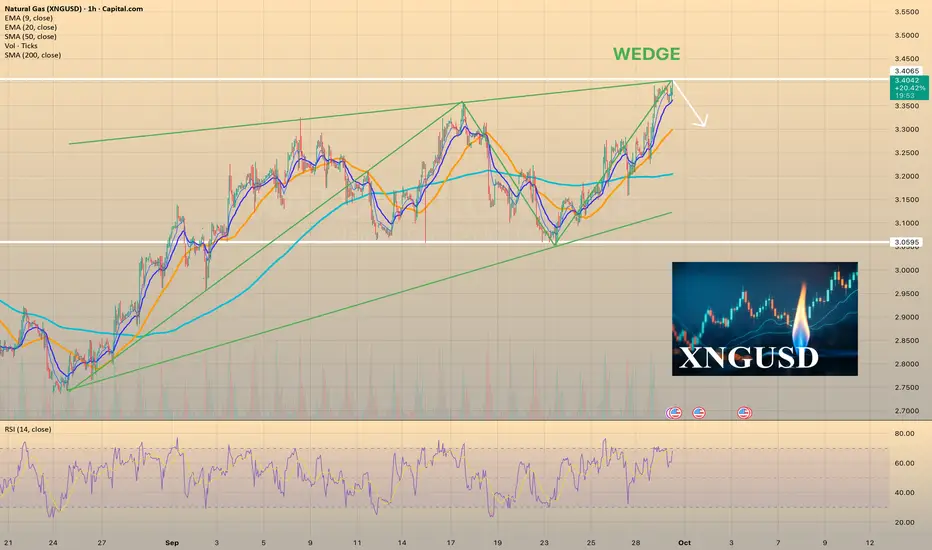
Technical Analysis of the XNG/USD Chart
Three factors might restrict further price growth:
→ The RSI indicator signals extreme overbought conditions.
→ Price has moved above the upper boundary of the channel (which has been in place since August), indicating that natural gas may be overvalued.
→ If we view September’s moves as a 3.065–3.315 range, then the target following the breakout on 29 September should be calculated based on the range height — pointing to 3.645. This target has already been reached.
Thus, we could assume that the market is vulnerable to a pullback (for example, towards the median of the blue channel). At the same time, the steep upward trajectory (highlighted in orange) remains intact.
Therefore, we may see an attempt at a bullish breakout of the July high near the 3.65 level — although, given the factors mentioned above, such a breakout could well prove to be a false one.
This article represents the opinion of the Companies operating under the FXOpen brand only. It is not to be construed as an offer, solicitation, or recommendation with respect to products and services provided by the Companies operating under the FXOpen brand, nor is it to be considered financial advice.

Natural Gas Triggers Bullish PatternNatural gas triggered and confirmed a daily chart breakout.
A technical inverse head and shoulders pattern can be observed.
Natural GAs is rallying on colder temperature forecast in the US.
Colder temps often yield more consumption.
Inventories are set to take place on Thursday...the daily 200MA should be watched closely.

U.S. Gas prices recoverU.S. Gas prices recover
On September 29, natural gas finished higher, reversing earlier losses. Prices had initially been pressured by forecasts of warmer-than-normal weather in the coming weeks, but later gained support from other factors — including data showing stronger export demand for U.S. natural gas.
According to EBW Analytics, the above-average warmth is expected to limit natural gas demand through the first half of October. Citing DTN’s temperature forecasts, EBW noted that U.S. storage is projected to grow by about 270 bcf between September 26 and October 16. This means that whenever colder weather eventually arrives, markets will be well supplied, which should help cushion any price spikes.
Now natural gas (XNGUSD) are trading at $3.39.
In Europe storage facilities across the EU have reached 82.5% capacity ahead of winter, according to Gas Infrastructure Europe (GIE). On September 28, EU countries injected 206 million cubic meters of gas into storage, while withdrawals declined to 28 million cubic meters. Total storage now stands at 90.9 billion cubic meters — the seventh-highest September level in the historical record.
Despite this progress, storage levels remain 6.9 percentage points below the five-year seasonal average and well under last year’s 94.2% mark for the same date. Under European Commission rules, member states must fill storage sites to at least 90% between October 1 and December 1 each year, though up to 10% flexibility is permitted under difficult conditions. These requirements are contributing to upward pressure on European gas prices.
U.S. Natural Gas holds near 10-week highsU.S. Natural Gas holds near 10-week highs
U.S. natural gas futures hovered around $3.20/MMBtu, a ten-week high, supported by lower output. Production in the Lower 48 slipped to 107.4 bcfd in early September from a record 108.3 bcfd in August. The earlier supply surge fueled large storage injections, leaving inventories 6% above the five-year average and 1% higher year-over-year.
On the demand side, forecasts call for above-normal warmth into early October, while LNG feedgas flows averaged 15.7 bcfd—slightly below August levels.
Longer-term risks remain. Global LNG capacity is projected to expand 60% by 2030, with half of the new supply coming from the U.S. This raises the threat of oversupply, potentially pressuring prices in Asia and Europe. Still, strong domestic demand—driven by slower renewable deployment and rising AI-related power needs—may lend support to U.S. prices.
In Europe, gas inventories stand at 82.3% capacity, with France and Italy above 90% and Germany at 76.6%. Softer Asian demand due to milder cooling needs has freed up cargoes for Europe, helping push prices lower.
Geopolitical risks remain in focus. NATO–Russia tensions and potential sanctions on Russian energy—including Europe’s ban on seaborne imports by 2027—could disrupt supply and limit downside.

LNG:Storage Inventories Projected to Increase above 2024 Levels.*Due to the platform's features, the charts are arranged in sequence from left to right, from the first to the ninth chart.
Current prices vs. price spread 10 days before expiration by month since 2010
The expiration of the NGV25 contract is occurring near the 15-year median. The subsequent NGX25 contract is currently trading around the 10-day pre-expiration historical average, however, showing elevated volatility. Winter 2026 contract prices remain above the interquartile range.
Current forward curve vs. 2020-2024
The forward curve shape remains stable, increasingly resembling the configurations observed on comparable calendar dates in 2023 and 2024. This pattern is particularly evident in contracts with delivery three years from now or longer, where a pronounced convergence toward historical pricing levels is occurring.
Current inventory and forecast for next week compared to 2019-2024
During Week 38 (September 15–21), storage inventories are projected to increase by +76 BCF, reaching 3,509 BCF — already surpassing 2024 storage levels. Meanwhile, injection rates have slowed due to reduced cooling demand and now align with the five-year median pace. Elevated production remains the primary driver behind inventory growth.
Weekly HDD+CDD total from current NOAA data and forecast for the next two weeks comparing 1994-2024
Across the continent, the current year’s Week 39 is marked by HDD+CDD values significantly below the 30-year historical average. Forecasts for Week 40 suggest continued weakness in these metrics, which is expected to suppress demand further and may reignite downward pressure on prices.
Explanation of the chart: candles represent quantiles for 30 years from 1994 to 2024. Red dots 2024, green 2025, blue prediction 2025.
Weekly HDD+CDD total from current NOAA data and forecast for the next two weeks compared to 1994-2024 by region
Forecasts across key regions align with the broader trend: HDD+CDD values remain below the 30-year historical average.
Weekly cumulative supply/demand differentials compared to 2014-2024
Despite elevated inventory levels and robust production pace, the weekly aggregate supply-demand spread chart for the 2014–2024 period illustrates a key observation: the divergence between demand and supply has widened significantly above the decade-long average and now mirrors the level seen during the same week in 2024. The main factors sustaining strong demand include consistently high LNG exports, steady industrial consumption, and gas-fired power generation.
Number of Days for Deliveries from Storages
The chart illustrates the number of supply days equated to solely storage deliveries, assuming current consumption levels. In February–March 2025, inventories stood at 10–18 days — it’s comparable to or slightly below the historical average. From May through August, coverage increased to 25–35 days, which remains somewhat below the 10-year range. By September 2025, inventories rose to 33 delivery days, aligning with the median but still below the peaks observed in 2015–2016. This moderate level of storage adequacy creates a structurally tighter market, where even minor production disruptions or modest demand spikes can trigger disproportionate price reactions - especially during the late winter to early spring period.
Weather Anomalies (HDD+CDD) and Fundamental Factors
Overall, fundamental factors and weather anomalies are within the expected range, with no systemic deviations, except for isolated declines in LNG exports and Mexican exports, which may temporarily support prices.
Anomalies in Power Generation Sources
Core generation across most sources has evidently stabilized, with remaining key anomalies observed in coal, hydro, and solar output.
This analysis was conducted in cooperation with Anastasia Volkova, analyst of LSE.
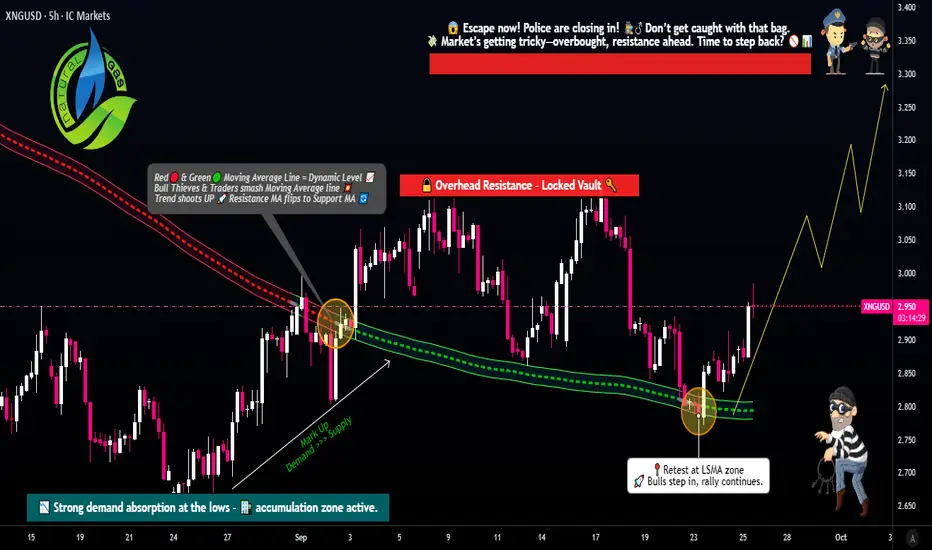
XNG/USD Swing Trade Plan – Entry, Stop, and Target Explained🚀 NATURAL GAS (XNG/USD) – Energies Market Wealth Strategy Map ⚡🔥
(Swing Trade Setup – Thief Layered Style)
📊 Plan
✅ Bullish confirmation spotted with LSMA pullback 🟢
✅ Thief’s unique layering entry strategy 🎭 — stacking multiple buy limit orders to sneak into the market like a pro.
Layered Entry Levels:
Buy Limit @ 2.800 🧩
Buy Limit @ 2.850 🧩
Buy Limit @ 2.900 🧩
Buy Limit @ 2.950 🧩
(Feel free to add more layers based on your own risk appetite.)
🛡️ Risk Management
Stop Loss (Thief SL): ⚠️ @ 2.750
(Note: Dear Ladies & Gentlemen – Thief OG’s – this SL is my style. Always set your own SL according to your risk.)
🎯 Target Zone
👮 Police Barricade spotted around 3.300 🚨
Here we have:
Strong resistance wall 🧱
Overbought signals 📈
Potential trap zone
👉 Take your profits before the market police catch you! Escape with your bags full 💼💨
(Note: Dear Ladies & Gentlemen – Thief OG’s – this TP is my style. Always set your own target according to your profit goals.)
🔍 Related Pairs & Correlations
FXOPEN:XNGUSD (Natural Gas) – our main thief play 🎭
BLACKBULL:WTI / TVC:UKOIL (Crude Oil & Brent) 🛢️ – often show energy sector momentum correlation
ICMARKETS:XBRUSD (Brent Crude) – watch for confirmation of energy strength 🔥
SP:SPX / TVC:DXY (S&P 500 & US Dollar Index) – dollar strength can pressure commodities
OANDA:XAUUSD (Gold) – safe haven vs energy volatility ⚡
Correlated markets can confirm direction or signal early reversals. Always watch the energy family together for big moves.
✨ “If you find value in my analysis, a 👍 and 🚀 boost is much appreciated — it helps me share more setups with the community!”
⚠️ Disclaimer: This is a thief-style trading strategy created just for fun & educational purposes. Not financial advice. Trade safe, trade smart.
#XNGUSD #NaturalGas #Commodities #SwingTrade #EnergyMarkets #LayeringStrategy #TradingCommunity #MarketThief #OGStyle
THE UNTOLD STORY OF 2025: The Looming US Natural Gas SqueezeHaving examined the broader oil picture, let's turn our focus to natural gas.
Unlike oil, the US natural gas market is setting up for a potential sharp price increase in the near future. The US gas market is a relatively isolated phenomenon. Even if the rest of the world experiences falling energy prices and a widespread economic crisis, the situation in the US could be the complete opposite. Let's break down why.
From a technical perspective, as with oil, I believe we established an absolute price floor in 2020. The COVID-19 pandemic crushed prices that were already low due to a gas glut caused by the shale revolution and soaring production.
The 2022 price spike, while sharp and emotionally driven by the war in Ukraine and the European energy crisis, failed to reach the peaks seen in international LNG prices. This was simply because the US market is not fully integrated with the global market. LNG export capacity was insufficient to pull massive volumes of US gas abroad; it remained trapped domestically.
Subsequently, prices fell back to their previous lows.
However, we now appear to be seeing the initial waves of a new cycle forming. A falling wedge or ending diagonal pattern currently developing could signal the sharp, explosive move that typically follows such a pattern.
Several fundamental factors support this thesis:
Growing LNG Exports: New LNG export projects are starting to draw more and more gas away from domestic supply.
Soaring Power Demand: Demand for electricity generation from data centers (for cryptocurrency and AI) is rising dramatically.
Stagnant Production: Gas production has plateaued and is not growing.
The End of an Era?: A recent EIA report has sparked debate about the possible end of the shale gas and oil boom in the US, suggesting prime drilling locations are dwindling.
Add an impending financial crisis and the potential for a credit crunch that the Fed may be unable to liquify this time around (a topic for a separate analysis), and you have a recipe for a perfect storm in the US market.
Another critical factor is that US drilling and extraction are highly capital-intensive. Fracking requires significant working capital (equipment, materials) and involves high operational expenditures. This is all financed with debt. For the oil sector to remain profitable, it requires sustained prices above $60 per barrel.
If oil prices fall and production declines—and we know the rig count is already dropping—the production of associated gas will also fall.
If industry financing dries up, a wave of bankruptcies will begin. Highly leveraged small operators will be forced out of business, shutting in their gas production as they go.
US prices would then skyrocket. Major players would begin to acquire struggling smaller companies, snapping up their assets and drilling rights at a discount, positioning themselves for the next cycle.

Natural Gas fell on bearish EIA data and cooler forecastsNatural Gas fell on bearish EIA data and cooler forecasts
October natural gas tumbled on August 18 after the EIA reported a larger-than-expected 90 bcf storage build, pushing inventories more than 200 bcf above the five-year average. XNGUSD remains under pressure from core fundamentals including supply-demand balances, weather trends, geopolitics, macro conditions, and competing fuel prices.
Further downside came as forecasts showed fewer cooling degree days over the next two weeks. Analysts warned the market is running out of time for late-summer heat to tighten balances, with October often bringing cooling demand offset by weaker heating needs.
Losses accelerated on August 18 as late-September forecasts turned cooler, reducing air-conditioning demand. Meanwhile, near-record U.S. output and elevated rig activity continue to weigh on prices.
Natural Gas Bearish News TodayNatural Gas crumbled off the inventory report this morning.
Natural gas inventories came in at 90B vs 80B consensus.
This larger than expected build shows a weaker demand for Nat Gas during this seasonal period.
Key things to consider:
1. EU moves to accelerate ban on Russian LNG.
2. New Israel–Egypt pipeline coming online
3. China continues to import from Arctic LNG‑2 despite sanctions
4. Japan’s JERA in talks to buy U.S. shale gas assets
5. Gas storage in Germany & winter supply concerns
6. Western Canada storage nearly full; supply glut
7. Canadian production at record levels, but prices very low

U.S. Natural Gas rises, but outlook mixedU.S. Natural Gas rises, but outlook mixed
U.S. natural gas futures climbed about 2% to an eight-week high on August 17, supported by lower daily output and stronger demand forecasts for the next two weeks. However, October contracts retreated from a one-week high on Wednesday, settling slightly lower as traders anticipated a larger-than-average build in EIA inventories.
Prices initially spiked midweek on forecasts for late-summer heat across much of the U.S., which is expected to drive up power-sector demand for air conditioning and slow inventory accumulation ahead of the winter heating season. Atmospheric G2 projected above-normal temperatures for September 22–26, with warmer conditions extending into the north-central U.S. from September 27–October 1.
On the supply side, higher U.S. production remains a headwind. The EIA last week raised its 2025 output forecast by 0.2% to 106.63 bcf/day, near record highs, with active natural gas rigs recently hitting a two-year peak.

XNGUSD for buy Price hit the third touch of the trend line on HTF. Price broke the previous bearish trendline indicating a bullish movement. Our confirmation is the last bullish pinbar retesting the support zone.

Weather vs. Supply: Nat-Gas prices rallyWeather vs. Supply: Nat-Gas prices rally
Natural gas prices surged in mid-October, driven primarily by forecasts for hotter-than-average US weather, which was expected to boost demand for cooling and electricity generation. Supporting this bullish sentiment, data showed US electricity output had increased year-over-year.
However, these gains were tempered by bearish fundamentals. US natural gas storage levels rose more than expected and remained above the five-year average, indicating ample supply. Furthermore, the number of active gas rigs held steady, remaining below their recent peak, while European gas storage levels were also below their seasonal average.

XNGUSD ShortXNGUSD is expected to drop from 3.31 USD, confirmed by a Crab harmonic pattern indicating strong bearish momentum, with TP1 and TP2 as key targets.

NGAS - UniverseMetta - Signal#NGAS - UniverseMetta - Signal
D1 - Formation of potential 3rd wave + retest of trend line. Stop behind minimum of 2nd wave.
Entry: 2.9979
TP: 3.1945 - 3.5475 - 3.7752 - 4.1294
Stop: 2.8858

GAS: FROM TRADING SMALL TO A NEW "GOLDEN AGE"?Despite the extremely nuanced wave count on the lower timeframes, we managed to sit on our hands when the market was unclear and only take selective, high-probability opportunities where they presented themselves.
Overall, my base case scenario is that after some minor moves early in the week (TIP: NatGas often continues the previous week's trend into Monday-Tuesday), we'll see a powerful breakout to the upside.
A move down is certainly possible, but we're not factoring it into our plan for now. We'll only shift our focus if the indicators start screamingly loudly about it.
The big picture is painting a very optimistic scenario for gas. It looks like after one more downcycle, the commodity could be poised for a new "golden era" – or at least a very strong year.
The global context is worth a separate deep dive. Right now, many LNG buyers worldwide are signing contracts linked to the US Henry Hub benchmark. It's quite plausible that US gas will become more expensive than oil-indexed gas (the standard in the Middle East, Asia, and for Russian LNG contracts).
Like and comment if you find this topic interesting! If there's enough engagement, I'll put together a dedicated article on this, as I work in the LNG industry myself and this is a subject close to my heart.

NATAG! - MOVE INCOMING!🚨 NATGAS – The Calm Before the Pop? 🚨
Alright traders, let’s break this beast down 👇
🕰 Weekly View
Price just rejected hard from the 3.4 – 3.8 supply zone and has been sliding since. Now we’re parked on the 2.6 – 2.7 liquidity trendline. This is the decision point — bounce or flush into the 2.0s.
📉 Daily Structure
The Elliott Wave count lines up:
Wave (1) topped near 5.0
Wave (2) retraced cleanly
Wave (3) rallied to 4.2
Wave (4) dragged us back to support
Now the big question → do we get a Wave (5) relief rally back into 3.2 – 3.4 supply? 👀
⏱ 4H Breakdown
On the lower timeframe, price is coiling tight. Liquidity is building, stops are stacked, and it looks like a bear trap setup. A bullish push here could rip into overhead supply before the bigger trend resumes.
🎯 Trade Plan
Entry Zone: 2.6 – 2.7 support
TP1: 3.2
TP2: 3.4 – 3.5
SL: Below 2.45 (don’t hang around if it breaks)
This isn’t a macro reversal — just a counter-trend bounce play. Quick in, quick out. ⚡
What do you think?
