US CRUDE OIL(WTI): Completed Consolidation📈 USOIL was consolidating within a horizontal range on a 4-hour chart, and has now broken and closed above its resistance level.
I anticipate that the price may continue to rise and approach the next key horizontal resistance at 65.62.
USOIL.F trade ideas

Hellena | Oil (4H): SHORT to support area of 60 (Wave 3).The price is still not reaching the target of 60. I decided to make a new forecast, slightly changing the labeling of waves, or rather their importance.
At this stage, as before, I think that the price will reach the area of the level 60 in the middle wave “3”.
This movement is the development of the big corrective wave “C”. In general, the plan remains the same.
Manage your capital correctly and competently! Only enter trades based on reliable patterns!

CRUDE OIL (WTI): Complete Support & Resistance Analysis Today
Here is my latest structure analysis for WTI Oil.
Resistance 1: 63.7 - 64.1 area
Resistance 2: 65.6 - 66.8 area
Resistance 3: 70.2 - 70.5 area
Support 1: 61.4 - 62.0 area
Support 2: 59.0 - 60.8 area
Support 3: 55.3 - 57.3 area
The price is currently breaking Resistance 1.
A daily candle close above that may push the prices to Resistance 2.
❤️Please, support my work with like, thank you!❤️
I am part of Trade Nation's Influencer program and receive a monthly fee for using their TradingView charts in my analysis.

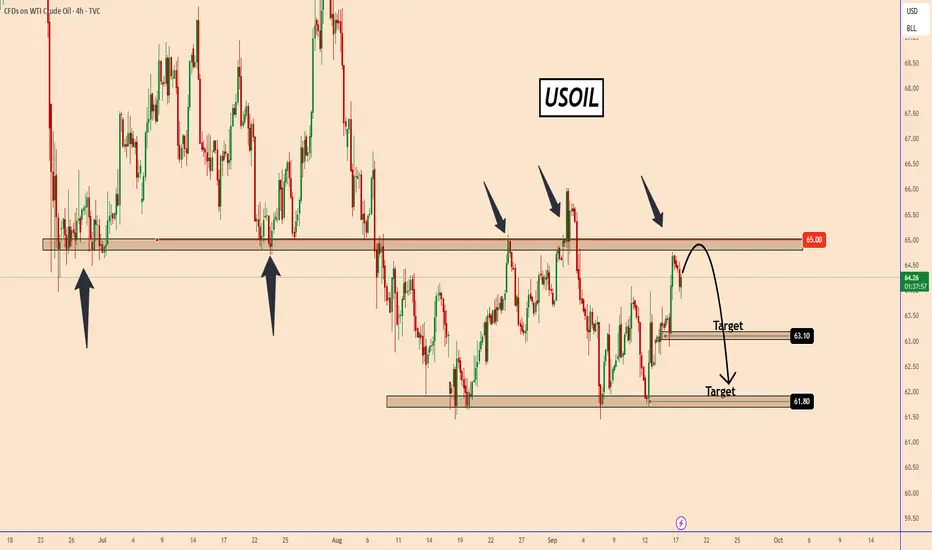
USOIL Analysis- Bearish OutlookUSOIL Analysis- Bearish Outlook
Crude oil is once again testing the resistance zone near $65.00, a level that has been rejected multiple times in the past. Sellers seem to remain strong at this area, keeping the price from breaking higher.
Currently, the chart suggests a possible pullback from resistance. If the bearish move continues, the first target is around $63.10, followed by the lower support area at $61.80.
As long as the price stays below $65.00, the short-term outlook remains bearish.
You may find more details in the chart!
Thank you and Good Luck!
❤️PS: Please support with a like or comment if you find this analysis useful for your trading day❤️
CRUDE OIL (WTI): Strong Bearish Pressure
WTI Crude Oil is under a strong bearish pressure after
US CPI release today.
A bearish breakout of a support line of a flag pattern
in a clear intraday downtrend on a 4H time frame leaves
a strong confirmation.
I think that the price will reach 62.0 level soon.
❤️Please, support my work with like, thank you!❤️
I am part of Trade Nation's Influencer program and receive a monthly fee for using their TradingView charts in my analysis.

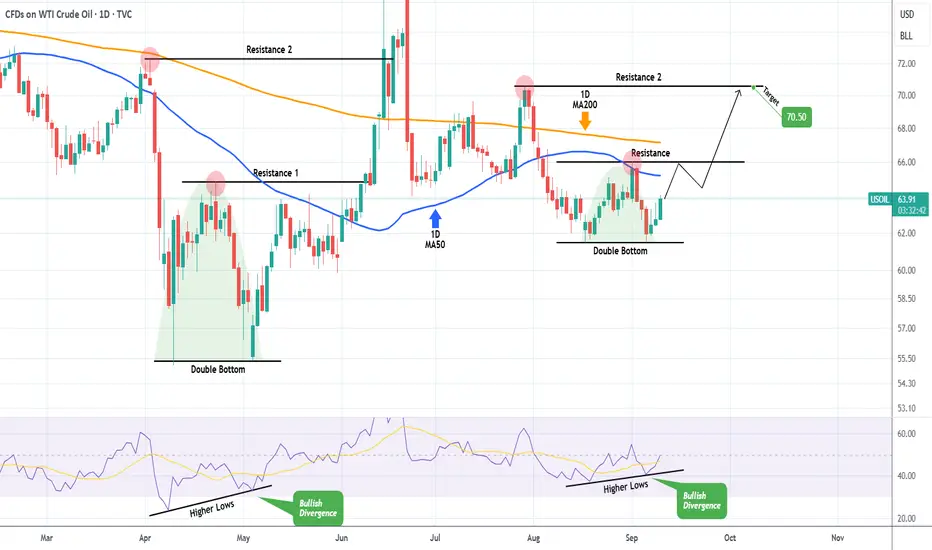
WTI OIL Recent fractal calls for a buy towards $70.50.WTI Oil (USOIL) is on the 3rd straight green 1D candle following a Double Bottom bounce on the 61.50 Support. At the same time the 1D RSI formed Higher Lows, which is a Bullish Divergence.
The same set of conditions emerged on the May 05 bottom rebound, which resulted into initially a 1D MA50 (blue trend-line) test and then a Resistance 2 contact.
As a result, we expect this rise to continue, targeting $70.50.
-------------------------------------------------------------------------------
** Please LIKE 👍, FOLLOW ✅, SHARE 🙌 and COMMENT ✍ if you enjoy this idea! Also share your ideas and charts in the comments section below! This is best way to keep it relevant, support us, keep the content here free and allow the idea to reach as many people as possible. **
-------------------------------------------------------------------------------
💸💸💸💸💸💸
👇 👇 👇 👇 👇 👇
CRUDE OIL (WTI): Important Breakout
Crude Oil broke and closed above a major daily horizontal resistance.
With a high probability, a broken structure turns into a potentially strong
support now.
I will expect a rise from that and a bullish continuation to 65.56 resistance.
❤️Please, support my work with like, thank you!❤️
I am part of Trade Nation's Influencer program and receive a monthly fee for using their TradingView charts in my analysis.

USOIL COMPLETING A CORRECTION BEFORE A RALLYUSOIL ANALYSIS (Hourly Timeframe)
Price is currently printinng the last leg to comeplete the minnute wave c to complete minor wave 2
#SabaliCapital
#TechnicalAnalysis
#USOIL
WTI OIL This is the bigger picture.WTI Oil (USOIL) is currently on the 2nd straight green week ahead of today's Fed Rate Decision. The long-term pattern though is has been a Channel Down since August 2022 and until it gets invalidated, the trend will remain bearish.
In fact, it has made 3 emphatic rejections on the 1W MA200 (orange trend-line) since August 12 2024. The 1W RSI sequence since then, resembles the pattern of 2023, where WTI found a Higher Lows Support on the 1W MA200. The last such contact was on the 0.786 Fibonacci retracement level before a last rebound to the top of the Channel Down.
That is exactly what we are expecting now, with the new 0.786 Fib waiting at $59.50. That is our medium-term Target.
-------------------------------------------------------------------------------
** Please LIKE 👍, FOLLOW ✅, SHARE 🙌 and COMMENT ✍ if you enjoy this idea! Also share your ideas and charts in the comments section below! This is best way to keep it relevant, support us, keep the content here free and allow the idea to reach as many people as possible. **
-------------------------------------------------------------------------------
💸💸💸💸💸💸
👇 👇 👇 👇 👇 👇

Oil trade 40%?Could be a nice trade. Or it is a wave 3 or a wave C. If its a C just count 5 waves up and then go short. If its a wave 3 itll bash to the upside.

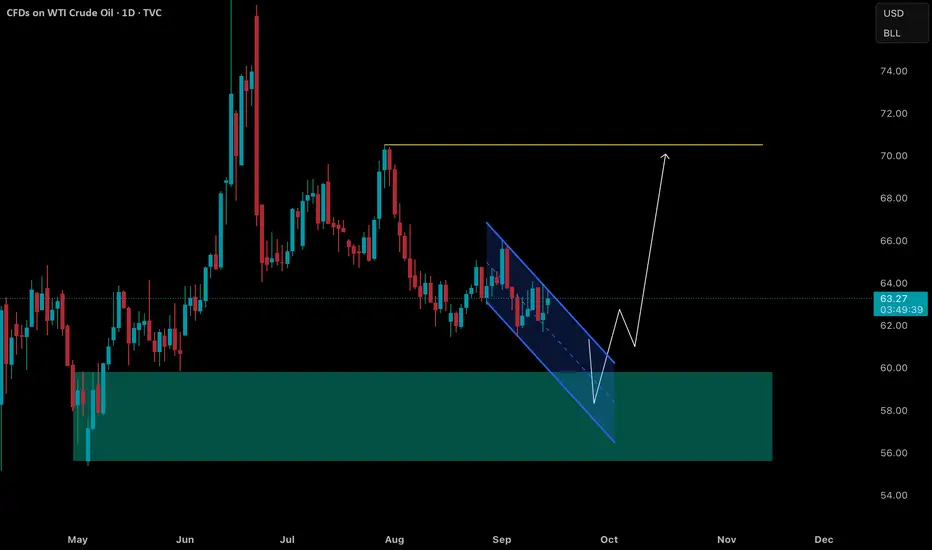
Crude Oil Eyes 4-Month Consolidation BreakoutOil prices have been consolidating within a triangle formation since the June 2025 high, which was triggered by the Israel–Iran escalation. Price action has traced a sequence of lower highs and higher lows, holding above the critical $61 support.
With five legs unfolding inside the triangle, a potential bullish breakout could take shape if the price holds above $64, opening the door toward: $66.80, $67.70, and $70.20, which aligns with the upper boundary of a long-term descending channel from 2022
A confirmed break above $70.20 could shift the long-term trend, transitioning from consolidation to a potential bullish reversal.
From the downside:
Failure to hold above $61 could see a retest of the 2025 lows, with key support levels at: $60.20, $59.20, $58.00.
Key events:
• FOMC meeting – Wednesday
• Ukraine-Russia refinery attacks
• Demand vs OPEC unwinds
Written by Razan Hilal, CMT

USOIL Is Very Bullish! Buy!
Here is our detailed technical review for USOIL.
Time Frame: 1D
Current Trend: Bullish
Sentiment: Oversold (based on 7-period RSI)
Forecast: Bullish
The market is testing a major horizontal structure 62.543.
Taking into consideration the structure & trend analysis, I believe that the market will reach 70.257 level soon.
P.S
Please, note that an oversold/overbought condition can last for a long time, and therefore being oversold/overbought doesn't mean a price rally will come soon, or at all.
Disclosure: I am part of Trade Nation's Influencer program and receive a monthly fee for using their TradingView charts in my analysis.
Like and subscribe and comment my ideas if you enjoy them!

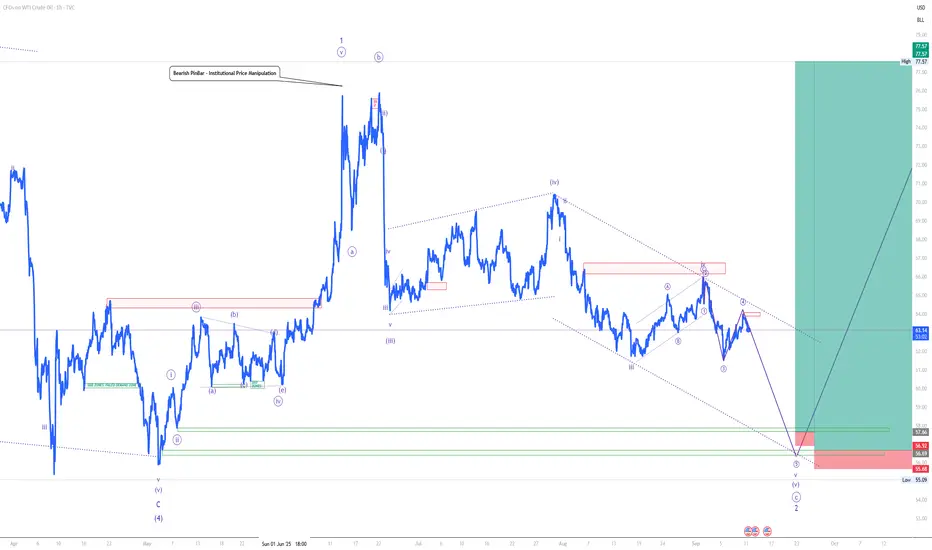
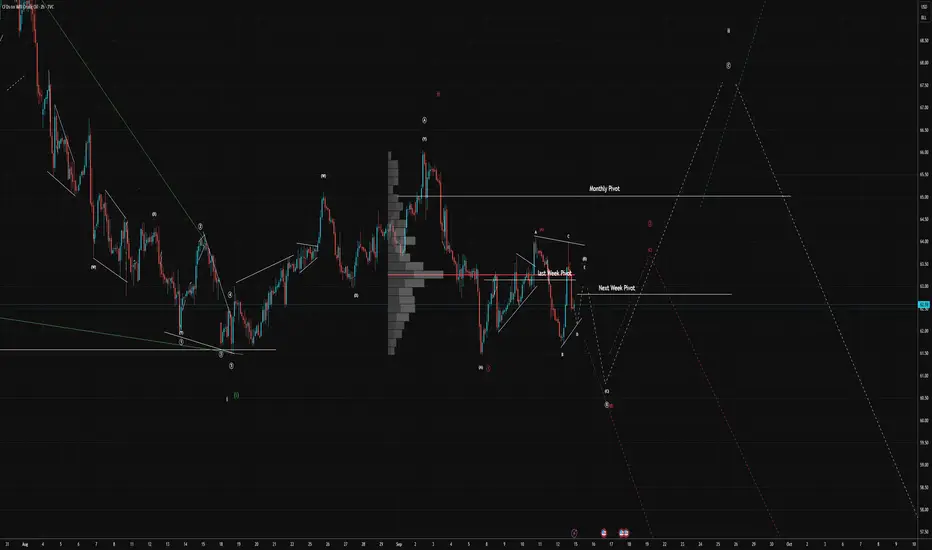
Oil Analysis: Testing Lows Before a Bounce?Price remains below key resistance levels and the monthly Point of Control (POC). I think within the next week, we could see the lows taken out, which would then be followed by a bounce.
The key question is whether the wave (ii) correction (red scenario) is complete, or if we are poised for another rally toward $67/bbl.
For now, we are maintaining careful short positions. Fading the trend at the potential end of a wave is generally a fool's errand; I've even added it to my rulebook as a hard taboo.
The slightly longer-term chart suggests another potential scenario in green.
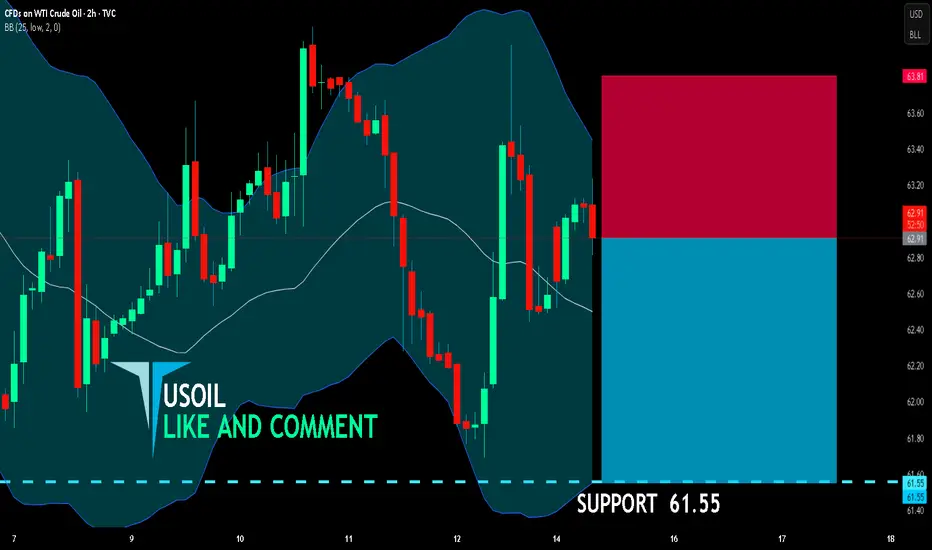
USOIL BEARISH BIAS RIGHT NOW| SHORT
USOIL SIGNAL
Trade Direction: short
Entry Level: 62.91
Target Level: 61.55
Stop Loss: 63.81
RISK PROFILE
Risk level: medium
Suggested risk: 1%
Timeframe: 2h
Disclosure: I am part of Trade Nation's Influencer program and receive a monthly fee for using their TradingView charts in my analysis.
✅LIKE AND COMMENT MY IDEAS✅
Oil slips on weak U.S. demand, supply glut concernsOil slips on weak U.S. demand, supply glut concerns
Oil prices dipped late Thursday as U.S. crude stocks rose 3.9M barrels, defying forecasts for a decline, while the IEA lifted supply estimates, signaling a larger surplus ahead. Losses were capped by rising geopolitical risks, with the U.S. and EU weighing tougher sanctions on Russia after fresh Ukraine-related tensions. Traders now balance bearish fundamentals with potential supply disruptions.


USOIL WTIWest taxes intermediate wti ,oil price will need to deep more for anyone who want to buy ,its in a bad position based on the strategy.
#usoil #wti

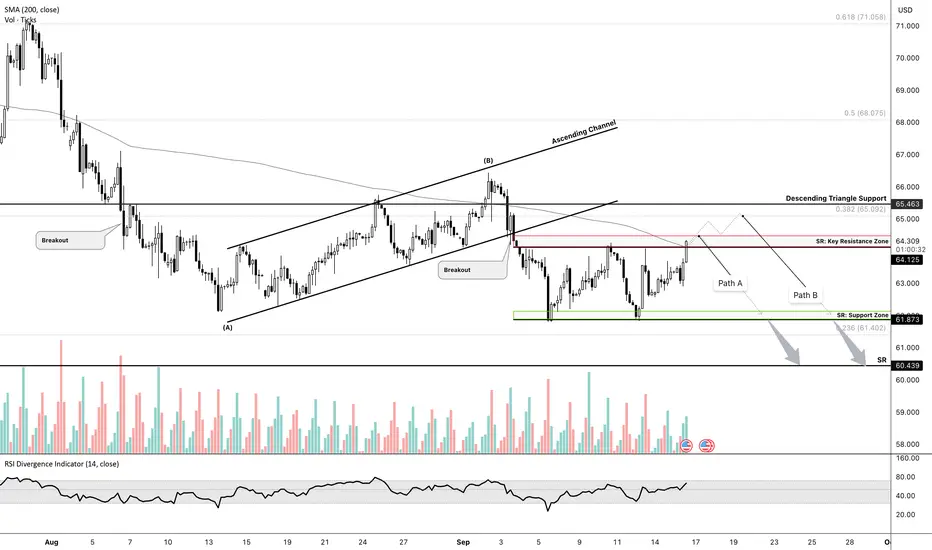
Oil Trade Analysis📊 NFX GBEBROKERS:USOIL Oil Trade Analysis
FX:USOIL is currently trading at a critical resistance zone around $64.200. With no strong fundamentals to back the current bullish momentum, this move looks short-lived given the broader macroeconomic outlook (as discussed in our last WMA session).
🔀 Two key paths ahead:
Path A – Bearish Rejection🔻(Most Probable)
Price faces rejection at current SR zone.
Confluence with the 200-day SMA, which has acted as strong resistance for some time.
Likely scenario: sharp retracement downwards.
Path B – Liquidity Grab 🔸
Price breaks above the 200-day SMA and SR zone.
Pushes higher towards the next resistance at 65 (38.2% Fib level).
Expected to be a fakeout/liquidity grab before a heavy bearish drop.
📅 Market Movers to Watch Tomorrow:
FOMC Statement
USOil Inventory Report
Fed Rate Cut Decision
⚖️ Personally, I lean strongly towards Path A (bearish rejection🔻), but I’ll be waiting for confirmation before entering. News tomorrow will be the key catalyst.
💬 What’s your outlook? Share your thoughts in the comments.
Oil Market Update📢 NFX TVC:USOIL Market Update
🛢 GBEBROKERS:USOIL
📊 ECONOMICS:USCOI EIA Crude Oil Inventories – Sep 17, 2025
Actual: -9.285M
Forecast: +1.400M
Previous: +3.939M
⚡ Huge bullish surprise – sharp drawdown vs forecast.
📍 Current Price: 64.3
Holding above 200-day SMA
Trading at key resistance, but zone already weakened from repeated tests.
🔀 Implication:
Given the bullish inventory print, I now lean towards Path B → liquidity push above 64.3 toward 65.0 (38.2% Fib level) before any meaningful bearish retracement.
⚠️ Keep in mind: ECONOMICS:USINTR decision still ahead → volatility risk.

USOIL H4 | Bearish reversal off major resistanceUSOIL is rising towards the sell entry, whichis an overlap resistance that aligns with the 78.6% Fibonacci retracement and the 138.2% Fibonacci extension and could reverse from this level to the downside.
Sell entry is at 65.00, which is an overlap resistance that aligns with the 78.6% Fibonacci retracement and the 138.2% Fibonacci extension.
Stop loss is at 66.62, which acts as a pullback resistance.
Take profit is at 61.72, which is a multi swing low support.
High Risk Investment Warning
Trading Forex/CFDs on margin carries a high level of risk and may not be suitable for all investors. Leverage can work against you.
Stratos Markets Limited (tradu.com ):
CFDs are complex instruments and come with a high risk of losing money rapidly due to leverage. 65% of retail investor accounts lose money when trading CFDs with this provider. You should consider whether you understand how CFDs work and whether you can afford to take the high risk of losing your money.
Stratos Europe Ltd (tradu.com ):
CFDs are complex instruments and come with a high risk of losing money rapidly due to leverage. 66% of retail investor accounts lose money when trading CFDs with this provider. You should consider whether you understand how CFDs work and whether you can afford to take the high risk of losing your money.
Stratos Global LLC (tradu.com ):
Losses can exceed deposits.
Please be advised that the information presented on TradingView is provided to Tradu (‘Company’, ‘we’) by a third-party provider (‘TFA Global Pte Ltd’). Please be reminded that you are solely responsible for the trading decisions on your account. There is a very high degree of risk involved in trading. Any information and/or content is intended entirely for research, educational and informational purposes only and does not constitute investment or consultation advice or investment strategy. The information is not tailored to the investment needs of any specific person and therefore does not involve a consideration of any of the investment objectives, financial situation or needs of any viewer that may receive it. Kindly also note that past performance is not a reliable indicator of future results. Actual results may differ materially from those anticipated in forward-looking or past performance statements. We assume no liability as to the accuracy or completeness of any of the information and/or content provided herein and the Company cannot be held responsible for any omission, mistake nor for any loss or damage including without limitation to any loss of profit which may arise from reliance on any information supplied by TFA Global Pte Ltd.
The speaker(s) is neither an employee, agent nor representative of Tradu and is therefore acting independently. The opinions given are their own, constitute general market commentary, and do not constitute the opinion or advice of Tradu or any form of personal or investment advice. Tradu neither endorses nor guarantees offerings of third-party speakers, nor is Tradu responsible for the content, veracity or opinions of third-party speakers, presenters or participants.

USOIL PUMP ?Usoil Pump Soon
Starts Bearish Channel Then Its Fill The Demand Zone Then A Possible Look For Long Trade
Compression Buy Setup
Best Of Luck With Your Trading 🤞
Follow Us For More
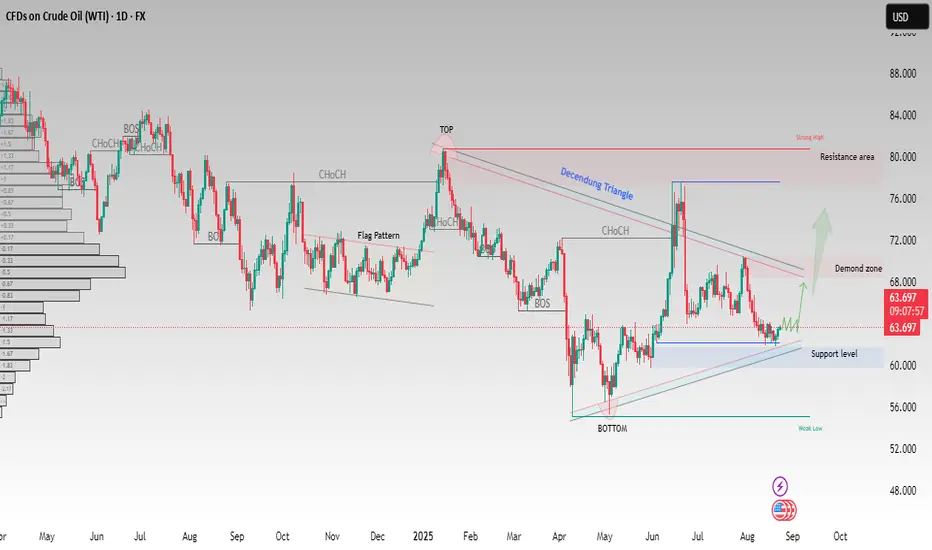
USOIL(WTI) – Demand Zone Tested,Potential Bullish Reversal AheadCrude Oil (WTI) is showing signs of strength after respecting the support level near $60–62 and forming a clear demand zone. Price has been consolidating within a descending structure and is now attempting to push higher.
Key observations:
✅ Support level held strongly near $60.
✅ Multiple Change of Character (CHoCH) signals indicating momentum shift.
✅ A potential breakout above the descending triangle may open the path toward the $70–72 demand zone.
📈 If bullish momentum continues, next targets lie around $76–80 resistance area.
On the downside, a break below $60 would invalidate the bullish setup and expose a move toward $56–54.
This structure highlights a possible trend reversal from the bottom toward higher levels, as long as buyers maintain control above support.
This analysis is for educational purposes only. It is not financial advice. Please trade responsibly and manage your risk
Is there a chance of a 50 basis point cut? SPX traded to new all time highs today.
Many stocks had blow off move or breakout candles.
Market makers cleared out lots of short interest today.
The employment data is starting to get worse.
A new 2 year high in initial jobless claims.
Markets rallied on dollar and yields weakness.
At some point the markets will price in a recession. Growth stocks need to be monitored closely.
We took profits on Tesla & Baidu today.
