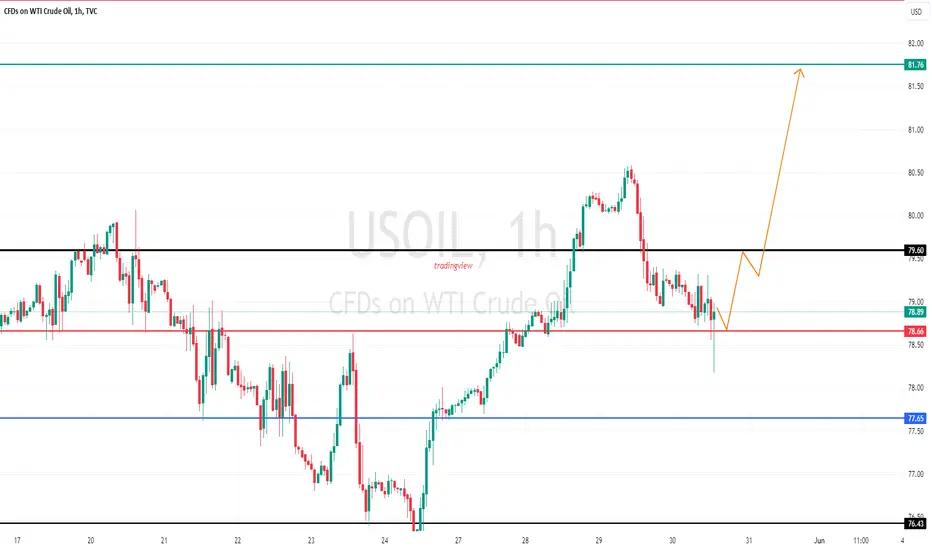
USOIL nearly looking for target Hey there on 1hTF the USOIL has looking for all target completed target
So we can observe the oil look for upside and then will drop continue
USOIL.F trade ideas

USOIL Trading Strategy: Bullish H1 Candle Confirmation for Buy SIf a bullish H1 candle closes above the 79.10 level, we will initiate a buy position. The stop loss for this trade will be set at 78, while our target is set to exceed 80. This trade setup offers a risk-to-reward ratio of approximately 1.3:1, making it a potentially favorable trade.

USOIL - where is current support? holding or not??#USDOIL.. market placed 80 plus day high and dropped again . now market have a supporting area here,
keep close it because if market hold it then again bounce expected from here,
don't be lazy here.
good luck
trade wisely
USOIL BEARS WILL DOMINATE THE MARKET|SHORT
Hello,Friends!
We are targeting the 77.96 level area with our short trade on USOIL which is based on the fact that the pair is overbought on the BB band scale and is also approaching a resistance line above thus going us a good entry option.
✅LIKE AND COMMENT MY IDEAS✅

CRUDE OIL (WTI): Is That a Bull Trap?!
Crude Oil may drop after a potential bullish trap:
we see a bullish inducement and a violation of a key horizontal resistance,
followed by a strong bearish imbalance.
I think that the market may drop at least to 78.8 level.
❤️Please, support my work with like, thank you!❤️

WTI OIL Bullish Divergence aiming higher.WTI Oil (USOIL) has been consolidating within the 1D MA200 (orange trend-line) and the 1W MA200 (red trend-line) for a full month. We have previously seen the same king of consolidation in mid-2023 and then November 2023 - January 2024. On both occasions, the price then entered a medium-term Channel Up.
Also on all occasions, the 1D RSI was on Higher Lows, while the price has been on Lower Lows, which is an indication of a Bullish Divergence. It is the exact same formation that Oil is currently on. As a result, we turn bullish on Crude for the medium-term, targeting $84.00 (just above the 0.618 Fibonacci retracement level and on the Lower Highs trend-line).
-------------------------------------------------------------------------------
** Please LIKE 👍, FOLLOW ✅, SHARE 🙌 and COMMENT ✍ if you enjoy this idea! Also share your ideas and charts in the comments section below! This is best way to keep it relevant, support us, keep the content here free and allow the idea to reach as many people as possible. **
-------------------------------------------------------------------------------
💸💸💸💸💸💸
👇 👇 👇 👇 👇 👇

WTI TO GO BULLISH!Price may go bullish if we can get a price offer at 78.450. Following the upcoming U.S. pce news coming up, price surged higher today & made 0.25% increase. A buy opportunity is envisaged when price drops to 78.450
Target is 79.00

usoil is bearishInvestors are cautious about U.S. inflation and interest rates, pushing oil prices lower.
Fed officials indicate more signs of slowing inflation are needed for rate cuts.
Despite increased refinery capacity, demand remains weak, adding pressure on oil prices.
Given the persistent inflation concerns and the cautious stance of the Federal Reserve, the outlook for crude oil prices remains bearish in the short term. The combination of weak refinery demand, ample supply, and geopolitical uncertainties points to continued price pressure. However, OPEC+ production cuts could offer some support, preventing a steeper decline. Traders should monitor upcoming economic data and OPEC+ decisions closely for further market direction.

Should we wait for lower oil prices?
In the analysis of the oil chart, the main trend line of the upward movement (blue line) has been broken, and the broken candle is marked with an arrow. It seems that we have to wait for lower prices for oil.
Do you agree with my opinion?

WTI, back at major order block support -- BOUNCE expectedWTI is currently sitting at below 0.5 FIB level on a weekly data -- a key area where most buyers converge.
$65-70 area has been quite a solid order block support. It has been tested many times and oil keeps bouncing up from this range.
A bounce is expected from current price range. Accumulation has notably started increasing at the present levels.
Spotted at 69.0
TAYOR.
Safeguard capital always.
--------
RELATED NEWS: Reuters
Oil prices settle more than 3% higher after China rate cut
By Stephanie Kelly
NEW YORK, June 13 (Reuters) - Oil prices climbed over 3% on Tuesday on hopes for growing fuel demand after China's central bank lowered a short-term lending rate for the first time in 10 months, boosting crude prices after steep losses the previous session.
The rate cut is aimed at adding momentum to a hesitant post-pandemic recovery in the world's second-largest economy and biggest crude importer.
Brent crude futures settled up $2.45, or 3.4%, to $74.29 a barrel. U.S. West Texas Intermediate (WTI) crude gained $2.30, or 3.4%, at $69.42 a barrel.

Crude oil under pressure 80.3 return rangeCrude oil technical analysis
Daily resistance 79.2-83.4, support below 77.5
Four-hour resistance 79.2-80, support below 78.5
✅Crude oil operation suggestions: Crude oil fell back after reaching a high yesterday. It failed to continue its strong performance after breaking through 80.0. The small negative line retreated and showed signs of seeking support at a lower level. In a strong market, the price usually falls back on the same day. Yesterday, it fell back and closed at a low level, which made the short-term bulls not strong. It still returned to a volatile trend. Be careful of today's rapid rise to repair the decline.
The overall price continued to fall back after encountering resistance above the 80 mark. The short-term daily level continued the rhythm of long and short wide fluctuations. Today's upper resistance focuses on the opening of yesterday's hourly line near 80.3-80.5, and the lower support focuses on the 78.5 line. During the day, keep selling high and buying low according to this range.
BUY:79.2 near SL:79.00
BUY:78.5 near SL:78.00
The crude oil brokers' quotations are different, only for reference of trading direction

USOIL SHORT
The price may rise to $82 but could also fall to about $70.
101.9 million barrels of oil will be consumed worldwide per day.
By next year, the oil markets appear to be oversupplied.
Highlights
Lower Russian output and more demand brought on by China's reopening could help oil prices.
Low demand and a bleak macroeconomic outlook for China
When the Energy Information Administration releases its inventory figures on Wednesday, more oil-related information will be available.
- ---------------
**First Scenario - Long:**
Initial Target: $80.90
Entry: $79.08
Stoploss: $77.47
**Second Scenario - Short:**
Initial Target: $74
Entry: $78.34
Stoploss: $79.2
- ---------------
After a long wait, I am currently waiting for this pair to give me my confirmation for a Short position (Data)
- ---------------
Take into consideration:
It appears that the market has settled in a range of $79.44 to $76.86, with the 7.68 retracement level above the latter being significant.
- ---------------
NFA
DYOR
- ---------------
Good Luck!
⚠️Caution: Just because I've set my buy and sell position Settings or drawn direction lines on my chart doesn't indicate I've opened a position or am obsessed with a particular bias. This is only a forecast; I don't trade when the price reaches my level; I have rules of engagement. Perhaps the most crucial element is 🆘RISK MANAGEMENT🆘.

WTIWTI analysis
1 hour time frame
The price can fluctuate between the ceiling and the floor of the specified areas

OIL: First green dayHi everyone and welcome to my channel, please don’t forget to support all my work subscribing and liking my post, and for any question leave me a comment, I will be more than happy to help you!
“Trade setups, not movements”
1. DAY OF THE WEEK (Failed Breakout, False Break, Range Expansion)
Monday DAY 1 Opening Range ✅ day 2 cycle
Tuesday DAY 2 Initial Balance
Wednesday DAY 3 (reset DAY 1) Mid Point Week
Thursday DAY 2
Friday DAY 3 Closing Range
2. SIGNAL DAY
First Red Day
First Green Day ✅
3 Days Long Breakout
3 Days Short Breakout
Inside Day
3. WEEKLY TEMPLATE
Pump&Dump
Dump&Pump ✅
Frontside ✅
Backside
4. THESIS:
Long: This market could coiling for an explosive move back to the previous HOW, where short traders are still in profit
Short: I do not exclude the secondary scenario of pump and dump starting from Friday, eventually evolving during the further days
Please note that the purpose of my analysis is to help me and you hunting the best trade setup for the day, none of my technical aspects are a way to forecast any directional market movement.
Gianni

Crude oil trade analysis
International oil prices fluctuated slightly on Thursday (May 30), with U.S. crude oil currently trading around $79.13 per barrel. Oil prices fell about 1% on Wednesday on worries that weak U.S. gasoline demand and economic data could lead the Federal Reserve to keep interest rates higher for longer. High interest rates aimed at countering high inflation could drag on economic growth and reduce demand for oil.
Crude oil persisted despite the headwinds yesterday. Both short positions at 79.4 and short orders at 80.2 made profits. Today's white market resistance is 80 and yesterday's high of 80.6, while support is 78.5 and 77.7. At present, the 4-hour SAR indicator has completed the top-to-bottom transition and appears at a high level. Today, Thursday, the trend continues to rebound high and bearish. Crude oil strategy: short after rebounding at 79.7, covering short positions at 80.3, stop loss at 80.7, target 78.5-78, hold if it breaks below;

OIL (WTI) - 4H Three PushThe WTI Oil 4H chart displays a classic bullish reversal pattern, often referred to as the "three pushes" or "three drives" pattern. This pattern is characterized by three distinct attempts by the market to push lower, each attempt being met with increasing buying interest. The current setup shows that after three downward pushes, the price has started to rebound, indicating a potential shift in momentum from bearish to bullish.
The price action has recently broken above the upper boundary of the descending wedge, which suggests a weakening bearish trend and the possibility of a new bullish phase. The target for this bullish movement could be around the $84 level, where previous resistance lies. Traders should watch for continued higher highs and higher lows to confirm the upward trajectory, and consider long positions as the price action aligns with this bullish reversal signal.

Crude oil continues to run in the 77~80 rangeCrude oil continues to run in the 77~80 range, waiting for a breakthrough, continue to sell high and buy low
Crude oil technical analysis
Daily resistance 79-80, lower support 76.8
Four-hour resistance is 79-80, and support below is 77-76.8
Crude oil operation advice: Crude oil was under pressure at the 79.2 mark yesterday and ushered in a weak and volatile downward breakthrough. The Asian and European prices fluctuated sideways and came under pressure near the 79 mark, then fell back and fell rapidly, falling back to a weak rebound near 78.2. NY time was under pressure at the 79 mark and ushered in an accelerated decline. Finally, the price fell to around 77.6 and stabilized.
The overall price appears to be suppressed at the 79 mark. Short-term oil prices continue to show a daily red-green cycle rhythm. Today, the lower support focuses on 77.2-77, and the upper pressure focuses on 79.5-80. The day will continue to rely on this range to maintain a wide range of long and short shocks. The watershed between short-term long and short strength still focuses on the 80 integer mark. Before the daily level reaches 80, it will continue to maintain long and short shocks between 77 and 80.
BUY:77.0 near SL:76.70
BUY:76.8 near SL:76.40
BUY:79.6 near SL:79.30
Technical analysis only provides trading direction!

Clean up on Isle 6All ideas are strictly my interpretation of price action. I am not a professional trader nor is this
professional advice.

WTIOIL SELLUsoil looking for more sell side momentum let's short oil 🛢
Fix your Stop-loss and TP anytime spikes will I've the results trail your SL every 30 pips
Survive safely


WTI Crude Oil Price Shows Bullish Trend Ahead of OPEC MeetingWTI Crude Oil Price Shows Bullish Trend Ahead of OPEC Meeting
As the chart indicates, on Monday, the price of WTI crude oil rose by approximately 1%.
Reuters reports that the bullish sentiment is driven by:
→ the upcoming OPEC+ meeting scheduled for 2 June;
→ expectations of high fuel demand with the start of the summer driving season and holiday season in the US.
Conducting a technical analysis of WTI crude oil on 10 May, we drew an ascending channel in blue and suggested a scenario of continued price growth within this channel.
Since then:
→ the price formed a low on 15 May at the level of 76.35, but quickly recovered from it. Thus, the bears' attempt to break the low of 8 May at the level of 76.68 quickly failed. In other words, there was a false breakout of the 8 May low.
→ A similar pattern occurred on 24 May – the price dropped below the 15 May low of 76.35, but quickly recovered.
Two false bearish breakouts are a bullish sign. And the strong behaviour of WTI crude oil prices on Monday confirms this.
Analysing the XTI/USD chart today, it is important to note that:
→ the price movement in April-May forms a descending channel (shown in red);
→ this decline since 5 April may be a correction within the larger ascending blue channel;
→ the price quickly returned to the blue channel, briefly dipping below its lower boundary;
→ the price is near the upper boundary of the descending channel.
Thus, conditions are being created for the end of the corrective movement. The bears' inability to hold the WTI oil price at new lows may be used by the bulls to resume the upward trend. It is also possible that news related to the OPEC+ meeting will contribute to this development.
Start trading commodity CFDs with tight spreads. Open your trading account now or learn more about trading commodity CFDs with FXOpen.
This article represents the opinion of the Companies operating under the FXOpen brand only. It is not to be construed as an offer, solicitation, or recommendation with respect to products and services provided by the Companies operating under the FXOpen brand, nor is it to be considered financial advice.

usoil analysisusoil broke out the downtrend, and started a correction after the breakout, i expect that usoil is retesting the support zone on golden zone fibbo, before going bullish.

OIL will going up around 83Oil will going up aroung 83, Buy now.
we can see Oil has Descending Braodening Wedge Pattern.
