MtICHI
the pair is trying to break the level upward to reach next top .we are waiting for this break upward . please see what would be the result
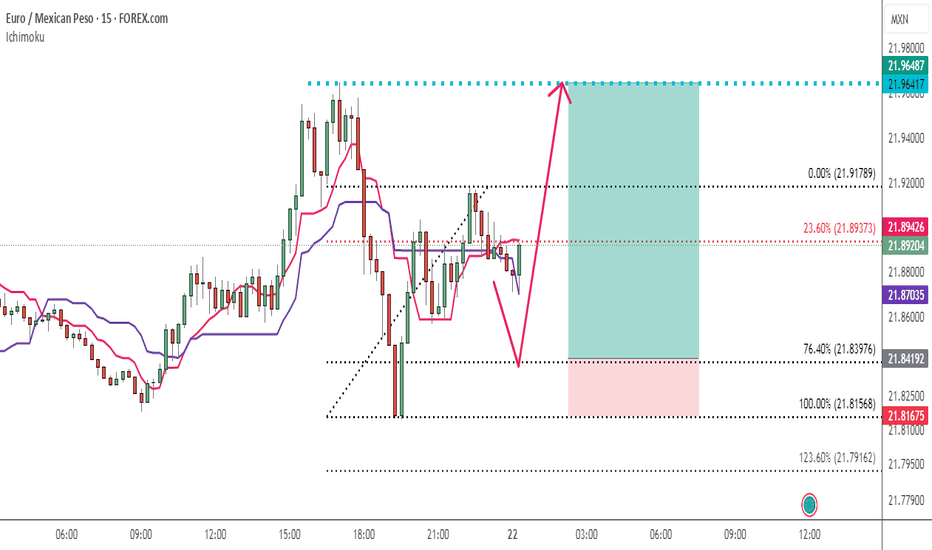
the pair reacted to support level and will go upward toward fibo level we proposed this position with RRR>3 based on price action pattern and ichimikou tenkensen lets see the result
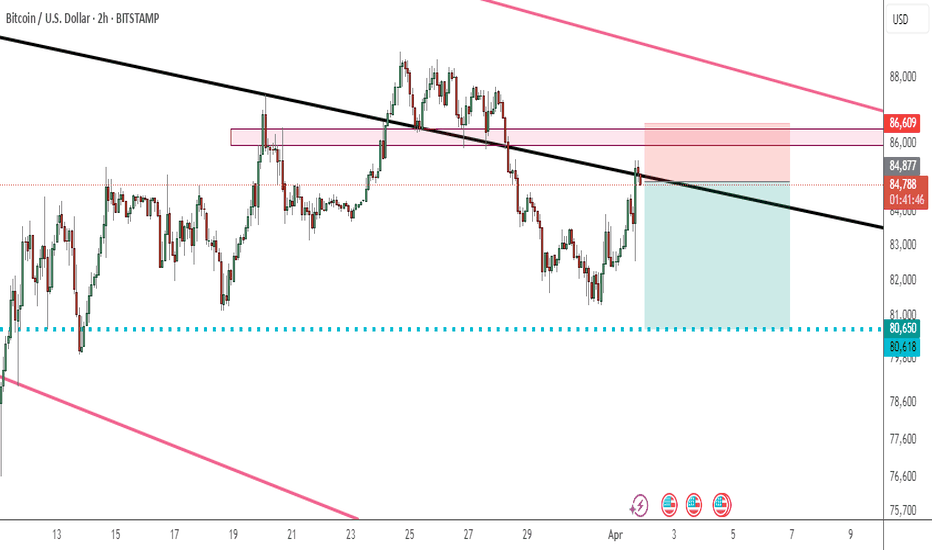
BTC is reacting to trendline and we proposed a short position toward specified tp a price action pattern for tp setting used let see market reaction
key levels are depicted on the chart and pair was bounced from its support level and trying to reach to its previous top long position proposed here stop and tp are specified on the chart and RRR >2 let see the result
observing double bottom at the end of downward move ,we suggest a buy position toward 76.4% fibo level for any correction RR is 2 let see the market reaction to our position my previous analysis :
the pair has already reacted to specified level on the chart and will go toward its tp we have seen several HH formed and then LH we proposed this short position with RRR>2
the pair is on the kijen level when we see 12H time frame and also on ema200 so we believe that the pair is getting strong support to attack to previous top once again RR>2 we are waiting for result
pair is reacting to trendline and is probable to go heading south according to price action pattern we are entering short with reward to risk ratio of 4 RR=4 let's see market reaction
a sell position upon market opening is proposed RR>2 a QM pattern is underway as reversal one levels depicted on the chart target is on the 76% fibo level lets see what would be the reaction
the pair is making HH and HL consecutively and now trying to make another HH toward upper level RR=2 we are suggesting this long position let see market reaction
reacting to trendline and on a key level ,we are suggesting entering short toward fibo level RR>3 let's see what will market reaction
Aussie made a LH after several HH's .this indicating that the pair is starting heading south . key levels are depicted on the chart a price action pattern below the price is observed for target setting let's see the market reaction
we are waiting for trend line reaction by the pair to enter long . our suggested position is buy limit with RR>3 upon market opening the key level for reaction is fibo 76.4% lets see what the market reaction
if the pair could go further down ,there would be a good opportunity for a buy limit position upon reaction to fibo 76.4% RR>5 is for this position if could activated lets see the result
the pair reacted to trendline which its polarity has changed multiple times and is a robust one we will enter short on the pair as depicted on the chart SL is above 76.4% fibo and target are on the key level below RR>2 lets see what the market will play out
index has already made head and shoulder pattern and broke down neck line we are waiting for our sell limit to activate upon market opening RR for this position is 2.5 wait for the result
the pair was trying several times to break the depicted level but failed and left a fake break on the level and now is heading south toward tp's please see what the market will play out
the key levels depicted on the chart with a reversal cup and handle pattern at 15min time frame we are going short with RR >2


