USOIL: 70$ BREAKOUT ROCKET FUELED! Black Gold Rally 🛢️ USOIL: 70$ BREAKOUT ROCKET FUELED! Black Gold Rally 📊
Current Price: $65.465 | Date: Sept 27, 2025 ⏰
📈 INTRADAY TRADING SETUPS (Next 5 Days)
🎯 BULLISH SCENARIO
Entry Zone: $65.20 - $65.60 📍
Stop Loss: $64.80 🛑
Target 1: $66.50 🎯
Target 2: $67.30 🚀
🎯 BEARISH SCENARIO
Entry Zone: $65.80 - $66.20 📍
Stop Loss: $66.60 🛑
Target 1: $64.70 🎯
Target 2: $64.00 📉
🔍 TECHNICAL ANALYSIS BREAKDOWN
📊 KEY INDICATORS STATUS:
RSI (14): 59.4 ⚡ Bullish Momentum Zone
Bollinger Bands: Mid-Band Breakout 🔥
VWAP: $65.35 - Acting as Springboard 💪
EMA 50: $64.80 ✅ Golden Cross Setup
Volume: Institutional Interest Rising 📊
🌊 WAVE ANALYSIS:
Elliott Wave: Wave 3 Impulse Loading 🌊
Fibonacci Target: $68.50 (161.8%) 🎯
🔄 HARMONIC PATTERNS:
Bullish Bat Completion at $64.90 ✨
ABCD Pattern targeting $67.20 🔄
⚖️ SWING TRADING OUTLOOK (1-4 Weeks)
🚀 BULLISH TARGETS:
Psychological: $70.00 🏆
Weekly Resistance: $68.80 🌙
Gann Level: $69.25 ⭐
📉 BEARISH INVALIDATION:
Weekly Support: $63.50 ⚠️
Critical Break: $62.00 🚨
🎭 MARKET STRUCTURE:
Trend: Ascending Triangle 💪
Momentum: Energy Building 🔥
Wyckoff Phase: Accumulation End 📈
Ichimoku: Bullish Cloud Entry 🟢
⛽ OIL MARKET DYNAMICS:
Supply Cuts: OPEC+ Extensions 🛢️
Demand Growth: Winter Season 🌨️
Inventory Draws: Bullish Data 📉
Geopolitical Premium: Risk-On ⚔️
⚡ RISK MANAGEMENT:
Max Risk per Trade: 2% 🛡️
R:R Ratio: Minimum 1:2 ⚖️
Breakout Confirmation: $66.00 hold 📏
🌍 FUNDAMENTAL CATALYSTS:
EIA Reports Supporting Bulls 📈
Middle East Tensions Premium 🌍
China Demand Recovery Signs 🏭
US Dollar Weakness Helping 💵
🔥 CRITICAL LEVELS TO WATCH:
Breakout Zone: $66.00-$66.30 💥
Support Cluster: $65.00 | $64.50 | $64.00 🛡️
Resistance: $66.50 | $67.50 | $68.00 🚧
🎯 FINAL VERDICT:
WTI primed for $70 EXPLOSIVE RALLY! 🚀
Black Gold showing institutional love! 💎
Supply-demand imbalance = bullish fuel! ⛽
Trade Management: Buy dips above $65.00 💰
Breakout Watch: $66.30 decisive level! 🔔
---
⚠️ Disclaimer: Commodity trading carries high risk. Use appropriate position sizing. Educational analysis only.
For individuals seeking to enhance their trading abilities based on the analyses provided, I recommend exploring the mentoring program offered by Shunya Trade. (Website: shunya dot trade)
I would appreciate your feedback on this analysis, as it will serve as a valuable resource for future endeavors.
Sincerely,
Shunya.Trade
Website: shunya dot trade
🔔 Follow Oil Market Updates | 💬 Drop Your $70 Oil Timeline
Trade ideas

WTI 4H🔹 Overall Outlook and Potential Price Movements
In the charts above, we have outlined the overall outlook and possible price movement paths.
As shown, each analysis highlights a key support or resistance zone near the current market price. The market’s reaction to these zones — whether a breakout or rejection — will likely determine the next direction of the price toward the specified levels.
⚠️ Important Note:
The purpose of these trading perspectives is to identify key upcoming price levels and assess potential market reactions. The provided analyses are not trading signals in any way.
✅ Recommendation for Use:
To make effective use of these analyses, it is advised to manually draw the marked zones on your chart. Then, on the 15-minute time frame, monitor the candlestick behavior and look for valid entry triggers before making any trading decisions.

OIL (WTI) – Trading Plan | Sep 26, 2025🔎 Technical Analysis of OIL (WTI) – Sep 26, 2025
1. Main Trend
- On the H1 timeframe, oil is in a medium-term uptrend, reflected by the ascending trendline extending from Sept 24 until now.
- Price has just had a strong breakout above the weekly VAH (65.45), confirming buying pressure dominance.
2. Key Zones
Resistance:
- 65.80 – 66.00: short-term resistance recently rejected.
- 66.50 – 67.00: stronger resistance zone, overlapping the previous swing high.
Support:
- 65.45 (VAH): nearest support; as long as price stays above this, the uptrend is reinforced.
- 65.10 – 64.60 (POC): central support, balance area.
- 63.00 – 62.90 (VAL): deeper support, previous volume low.
3. Price Action
-- Price had a strong breakout candle up to 66.00 but was rejected, now pulling back slightly toward VAH 65.45.
- The breakout was accompanied by large volume → buyers are in control, but short-term profit-taking pressure is appearing.
- If price holds above VAH, the uptrend will likely continue. If it falls back below POC 64.60, selling pressure may return.
4. Candlestick Pattern
- A rejection candle appeared at 66.00 with a long upper wick → short-term bearish signal.
- However, candles around VAH show small bodies → market is waiting for pullback confirmation.
5. Trading Plan (in order of priority)
📌 Scenario 1 – Buy with the trend (priority):
- Buy if price retests VAH 65.45 successfully or around POC 65.10 – 64.60.
- TP: 66.00 → 66.50 → extended to 67.00.
- SL: below 64.40.
📌 Scenario 2 – Buy breakout continuation:
- If price breaks above 66.00 with a strong H1 candle.
- Enter Buy on breakout.
- TP: 66.50 – 67.00.
- SL: below 65.45.
📌 Scenario 3 – Short-term Sell (only if clear signals appear):
- If price fails to hold VAH 65.45 and breaks POC 64.60.
- Enter Sell with momentum.
- TP: 63.00 – 62.90 (VAL).
- SL: above 65.80.
👉 Summary:
- Priority remains on Buy as long as price holds above VAH 65.45.
- If breakout above 66.00 succeeds → continue Buying with the trend.
- Only consider Selling if price drops below POC 64.60.
👉 If you find this analysis useful, don’t forget to hit like 👍 and drop a comment 💬 to support us in delivering even better insights! Or join my channel to get free signal.

OIL (WTI) – Trading Plan | Sep 25, 20251. Main Trend
- On the H1 timeframe, crude oil is still maintaining an uptrend with a higher high – higher low structure.
- However, the short-term trend is showing signs of losing momentum, as price has broken below the H1 uptrend line and is now oscillating around the POC zone.
2. Key Zones
Resistance:
- 64.95 (CW VAH): Strong resistance, repeatedly tested but not yet broken.
- 65.20 – 65.50: Extended zone if a breakout succeeds.
Support:
- 64.70 – 64.65 (CW POC): Key price zone, where price is currently consolidating.
- 62.85 (CW VAL): Deeper support, overlapping with the previous volume base.
3. Price Action
- After breaking up to 64.95, price failed to sustain bullish momentum, forming multiple upper-wick candles → selling pressure dominates.
- Currently, price has fallen below the H1 trendline and is retesting the POC zone (64.65 – 64.70).
+If POC holds, price may rebound to retest 64.95.
+If POC breaks, price is likely to drop deeper towards 63.50 → 62.85 (VAL).
4. Candlestick Pattern
- Several long lower-wick candles have appeared around the POC → showing defensive buying pressure.
- However, recent bearish candles have relatively large bodies → signals remain unclear, confirmation is needed.
5. Trading Plan
📌 Scenario 1 – Buy with the main trend (priority):
-Buy around 64.65 – 64.70 (POC) if there is a clear bullish reversal signal (pin bar / bullish engulfing).
- Target: 64.95 → 65.20 → further to 65.50.
📌 Scenario 2 – Sell if POC breaks:
- Sell if price breaks decisively below 64.60 and fails on retest.
- Target: 63.50 → 62.85 (VAL).
👉 Summary: Crude oil remains in a long-term uptrend, but short-term momentum is weakening. The decision point lies at POC 64.65 – 64.70:
+If it holds → Buy up.
+If it breaks → Sell down.
👉 If you find this analysis useful, don’t forget to hit like 👍 and drop a comment 💬 to support us in delivering even better insights! Or join my channel to get free signal.

Oil Bulls Beware: 65.5 Could Be the Turning Point📲 NFX Oil Trade Alert – Quick View
GBEBROKERS:USOIL – Resistance Test in Play
📍 Current Level: 65.00
📈 Next Target: 65.45–65.90 (38.2% Fib + Supply-Demand Zone)
⚠️ RSI likely to hit overbought at this zone → potential short setup
📉 Bias: Bearish rejection at 65.5 (preferred scenario) → Target back to 62
🔎 Catalyst: Bullish ECONOMICS:USGPRO EIA report, but effect already priced in from Monday’s rally.
📊 Oil Trade Analysis – Detailed Breakdown
FX:USOIL tested 65.00 after breaking out of the 64.1–64.5 SR zone post–EIA report (23.6% Fib retracement). This marks the second bullish report in a row, but this one was weaker, and the reaction looks mostly priced in after the rally from Monday to today.
Currently, price is hovering around 65.00, which is acting as a minor support. While this level may hold temporarily, it’s unlikely to sustain against broader resistance at 65.5.
I’m expecting price to push further towards the 38.2% Fib retracement (65.45–65.90), which also aligns with a major supply-demand zone. At this level, RSI will likely flash overbought, making it my preferred area to look for shorts.
🔀 Scenarios
Path A – Bearish Rejection (Most Probable)
Resistance holds at 65.5 zone.
Expectation: Sharp rejection → price retraces back to 62 (lower band of range).
Path B – Extended Rally (Less Probable)
Price breaks and sustains above 65.9.
Would invalidate immediate short setup and open path towards higher Fib levels.
⚖️ Fundamentals
While the EIA report acted as a short-term catalyst, supply hike remains a heavy bearish overhang. Nothing has changed on the bigger picture.
💬 Game Plan
Watching closely for clear rejection at 65.5. That’s where I’ll be pulling the trigger for shorts.

Crude OilUS Oil
- Consolidation phase as an corrective pattern in Long Time Frame
- RSI - Divergence
- Bullish Channel in Short Time Frame
- Completed " 1234 " Impulsive Wave
- Break of Structure

CRUDE OIL (WTI): Strong Intraday Confirmation
A quick follow-up for the yesterday's analysis on WTI Crude Oil.
The price went up as I predicted.
The market managed to violate a resistance line of a bullish flag pattern
on an hourly time frame, providing a strong intraday confirmation.
The price will likely grow more and reach 65.58 level after a completion of a retracement.
❤️Please, support my work with like, thank you!❤️
I am part of Trade Nation's Influencer program and receive a monthly fee for using their TradingView charts in my analysis.

USOIL SHORT SET UPUSOIL Short Setup 🛢️ | Clean rejection from supply zone. Targeting liquidity sweep below 62. Risk/Reward: 15:1. Let’s ride it down.
#USOIL #CrudeOil #OilShort #SupplyZone #RiskReward #SmartMoney #TradingView #Aiceezar

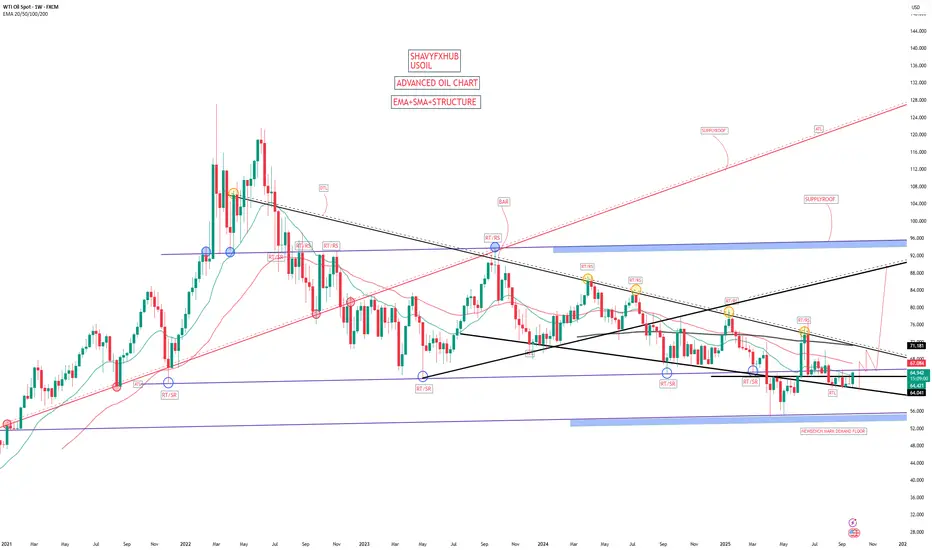
USOIL WEEKLY CHARTUS OIL have a seen a sharp drop in price and buyers and opec kept April 2025 low at 54.93$-55$ zone and retested in the month of may 2025 at 54.93$-55$ zone ,this zone could be considered as weekly benchmark buying deman floor from our strategy.
As geopolitical tension cools off oil price surged but capped by long term descending trendline connecting as represented on the chart on weekly timeframe,at the moment we have bridged 64.041$ and it will expose 70.971$-71.82$ descending trendline acting as dynamic resistance to oil uprising for a long time .
if buyers and opec make critical change and demand exceeds supply then we are going long on the break of 70.971$-71.82$ into 88$-85$ zone before correction .
pls let me know if you like the analysis and if we have any error to help us win on oil forecast.
pls note that this is my perspective based on the strategy and it could have some error.
#oil #usoil #ukoil
Crude Oil (H1) – Key Supply & Demand Scenarios I SEP/26/2025📌 Scenario 1: Bullish Continuation (High Probability)
Condition: Price holds above demand 64.7 – 64.8.
Entry signal: H1 bullish candle closes above 65.4 with volume → Buy.
TP: 66.0 – 66.2
SL: below 64.6
📌 Scenario 2: Pullback then Bounce
Condition: Price gets rejected at 65.3 – 65.4, pulls back to retest 64.7 – 64.8.
Entry signal: Pinbar / Bullish engulfing candle at demand zone.
TP: 65.4 → 66.0
SL: below 64.5
📌 Scenario 3: Bearish Correction
Condition: Price breaks below demand 64.7 – 64.8.
Entry signal: Retest of broken zone with bearish rejection → Sell.
TP: 63.8 – 64.0
SL: above 65.0
📌 Scenario 4: Deeper Reversal
Condition: Price breaks below 63.8 – 64.0.
Entry signal: Retest supply flip + bearish confirmation candle.
TP: 63.0 – 63.1
SL: above 64.2

Natural Gas & Oil Rally...What You Need to KnowNatural gas price action made a bullish reversal on the daily chart.
Closing up 1.8% ahead of inventories is very aggressive trading by the bulls.
The last couple of inventory prints have been bearish.
Crude Oil inventories sent WTI crude higher.
Energy & oil stocks were very strong today on the drop in oil inventories.
September 19 week inventories dropped by about 3.5 Million barrels.
This is showing a greater demand for oil.
Crude is still chopping around in a very dangerous technical level. Hasn't broken out or down.


Resistance or Support What was once support has now become resistance.
Once again, the price is drawn to areas of greater recurrence, as that is where liquidity lies.
If you don't pay attention to the charts, you may miss the opportunity.
The strategy is simple: look at that big trend line that was generated, and you'll notice that it's the freshest liquidity there is. Keep your eyes on the screen!
Keep it simple!
If you liked it, don't forget to follow me.

CRUDE OIL (WTI): More Growth Ahead
WTI Oil broke and closed above a strong rising trend line on a daily.
We see a pullback and a correctional movement now.
I think that growth will resume soon and the price will rise
to 65.55 level.
❤️Please, support my work with like, thank you!❤️
I am part of Trade Nation's Influencer program and receive a monthly fee for using their TradingView charts in my analysis.

OIL (WTI) – Trading Plan | Sep 23, 20251️⃣ Main Trend
- Overall: Short-term trend has shifted to bullish, but still needs confirmation at the 63.9–64.2 supply area.
- On H1: After a strong decline, price broke the downtrend line and bounced sharply.
- Currently, price has surged from the 62.0 area up to 63.8, touching a key resistance zone.
2️⃣ Potential Price Zones
Nearest Resistance:
- 63.97 (Swing POC – key balance zone + supply zone).
- 64.27 (Swing VAH – previous distribution high).
Key Support:
- 63.05 (Swing VAL – first dynamic support).
- 62.40–62.50 (confluence of demand + breakout zone).
- 62.0 (psychological support level, origin of the strong bullish leg).
3️⃣ Price Behavior
- Price rallied vertically, breaking the downtrend line → buyers are dominant.
- However, the latest H1 candle left a long upper wick at 63.9 → showing short-term selling pressure.
- If price holds above 63.05, the bullish trend may extend towards 64.2.
- If 63.05 breaks → high probability that price will retest 62.4 or even deeper to 62.0.
4️⃣ Candlestick Patterns
- Consecutive long-bodied bullish candles show strong buyer control.
- The most recent candle at 63.9 has a long upper wick → a warning signal of profit-taking.
Observation: If a bullish pin bar forms at 63.0–63.1 → confirms continuation of the trend. If a bearish engulfing forms at 63.9 → signal of a short-term reversal.
5️⃣ Trading Plan
📌 Scenario 1 – BUY at support (top priority)
Entry: 63.05 (Swing VAL).
Stop Loss: below 62.8.
Target: 63.9 → 64.2.
📌 Scenario 2 – BUY at deeper support
Entry: 62.40–62.50.
Stop Loss: below 62.0.
Target: 63.5 → 63.9.
📌 Scenario 3 – Short-term SELL (only if clear reversal candlestick signal appears)
Entry: 63.9–64.0 (Swing POC + supply zone).
Stop Loss: above 64.3.
Target: 63.1 → 62.5.
✅ Conclusion: The short-term trend has shifted to bullish after breaking the downtrend line. Priority strategy is BUY at the 63.05 or 62.4 support zones. SELL should only be considered if a strong bearish reversal candlestick signal forms at 63.9–64.2.
👉 If you find this analysis useful, don’t forget to hit like 👍 and drop a comment 💬 to support us in delivering even better insights! Or join my channel to get free signal.

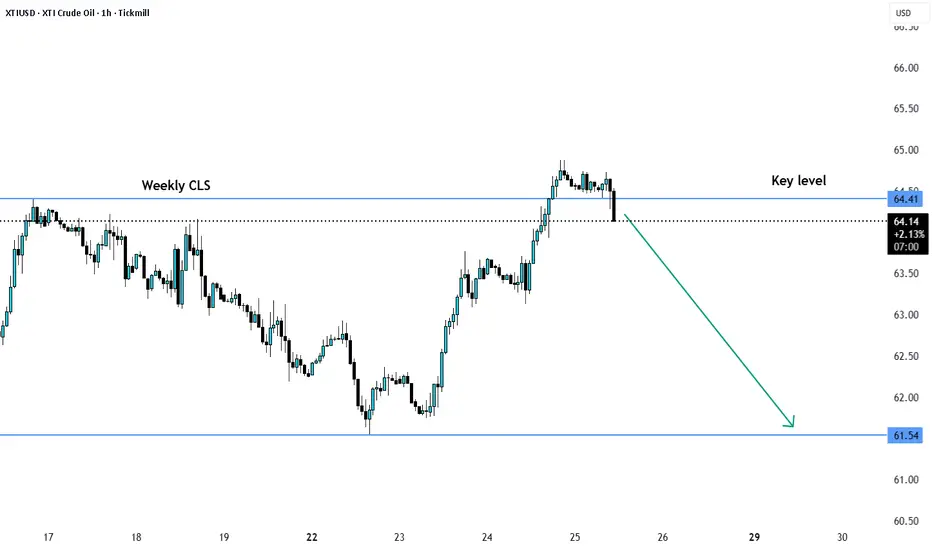
XTIUSD Weekly CLS manipualtion:Model SHORT from KEY LEVELXTIUSD experienced a liquidation grab and is now in a pullback phase. With the current price action, the pair shows signs of likely continuation to the downside.Weekly range manipulated
Liquidity level taken.
Crude oil: go long on pullback to 63.8After crude oil rose yesterday, it gained upward momentum again during today's European session, with short-term trend biased toward bullish. Focus on going long when it pulls back to 63.80; if it breaks below 63.20, exit the position on the pullback. The target is 64.80. If it breaks below 63.20 during the US session, then focus on entering long positions again at the 0.5 and 0.618 support levels of the overall upward pullback later.
Daily-updated accurate signals are at your disposal. If you run into any problems while trading, these signals serve as a reliable reference—don’t hesitate to use them! I truly hope they bring you significant assistance

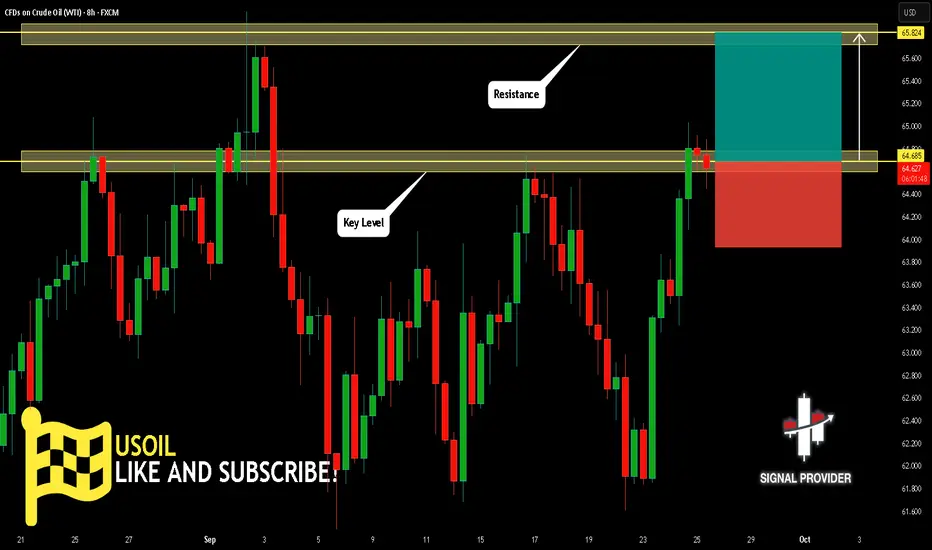
USOIL Is Bullish! Long!
Please, check our technical outlook for USOIL.
Time Frame: 8h
Current Trend: Bullish
Sentiment: Oversold (based on 7-period RSI)
Forecast: Bullish
The market is trading around a solid horizontal structure 64.685.
The above observations make me that the market will inevitably achieve 65.824 level.
P.S
The term oversold refers to a condition where an asset has traded lower in price and has the potential for a price bounce.
Overbought refers to market scenarios where the instrument is traded considerably higher than its fair value. Overvaluation is caused by market sentiments when there is positive news.
Like and subscribe and comment my ideas if you enjoy them!
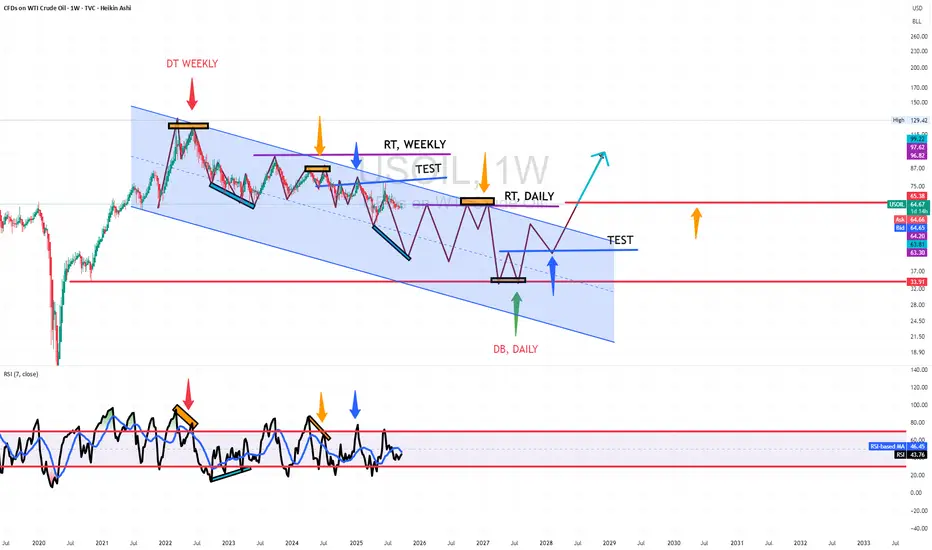
US OIL , RT WEEKLYHI GUYS,
we are on weekly test continuation sells..
i expect a serious dump or bear market to start the RT DAILY SELL STRUCTURE.
. PLEASE HOLD YOUR SELL POSITIONS.
the post above is future direction so u guys can look for buys and sell entries on lower charts.
lets milk the market together, see u on the next one.
Breakout or fakeoutSo far, oil has managed to break the channel’s ceiling, and now we need to see whether it will fake out and return inside the range or continue moving higher. The fact that it bounced strongly from the channel’s bottom could be a signal that the ceiling breakout might hold. ✅

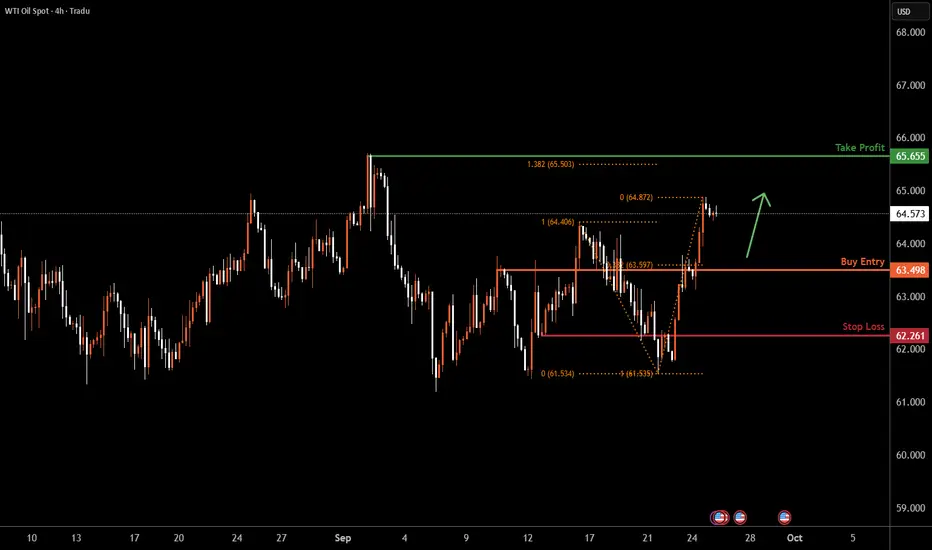
USOIL H4 | Falling towards 50% Fibonacci supportBased on the H4 chart analysis, we could see the price fall to the buy entry which is a pullback support that lines up with the 38.2% Fibonacci retracement and could bounce from this level to the take profit.
Buy entry is at 63.49, which is a pullback support that lines up with the 38.2% Fibonacci retracement.
Stop loss is at 62.26, which is a pullback support.
Take profit is at 65.65, which is a swing high resistance that is slightly above the 138.2% Fibonacci extension.
High Risk Investment Warning
Trading Forex/CFDs on margin carries a high level of risk and may not be suitable for all investors. Leverage can work against you.
Stratos Markets Limited (tradu.com ):
CFDs are complex instruments and come with a high risk of losing money rapidly due to leverage. 65% of retail investor accounts lose money when trading CFDs with this provider. You should consider whether you understand how CFDs work and whether you can afford to take the high risk of losing your money.
Stratos Europe Ltd (tradu.com ):
CFDs are complex instruments and come with a high risk of losing money rapidly due to leverage. 66% of retail investor accounts lose money when trading CFDs with this provider. You should consider whether you understand how CFDs work and whether you can afford to take the high risk of losing your money.
Stratos Global LLC (tradu.com ):
Losses can exceed deposits.
Please be advised that the information presented on TradingView is provided to Tradu (‘Company’, ‘we’) by a third-party provider (‘TFA Global Pte Ltd’). Please be reminded that you are solely responsible for the trading decisions on your account. There is a very high degree of risk involved in trading. Any information and/or content is intended entirely for research, educational and informational purposes only and does not constitute investment or consultation advice or investment strategy. The information is not tailored to the investment needs of any specific person and therefore does not involve a consideration of any of the investment objectives, financial situation or needs of any viewer that may receive it. Kindly also note that past performance is not a reliable indicator of future results. Actual results may differ materially from those anticipated in forward-looking or past performance statements. We assume no liability as to the accuracy or completeness of any of the information and/or content provided herein and the Company cannot be held responsible for any omission, mistake nor for any loss or damage including without limitation to any loss of profit which may arise from reliance on any information supplied by TFA Global Pte Ltd.
The speaker(s) is neither an employee, agent nor representative of Tradu and is therefore acting independently. The opinions given are their own, constitute general market commentary, and do not constitute the opinion or advice of Tradu or any form of personal or investment advice. Tradu neither endorses nor guarantees offerings of third-party speakers, nor is Tradu responsible for the content, veracity or opinions of third-party speakers, presenters or participants.
Bullish bounce off pullback support?WTI Oil (XTI/USD) is falling towards the pivot which aligns with the 38.2% Fibonacci retracement and could bounce to the 1st resistance.
Pivot: 63.94
1st Support: 62.09
1st Resistance: 65.90
Disclaimer:
The above opinions given constitute general market commentary, and do not constitute the opinion or advice of IC Markets or any form of personal or investment advice.
Any opinions, news, research, analyses, prices, other information, or links to third-party sites contained on this website are provided on an "as-is" basis, are intended only to be informative, is not an advice nor a recommendation, nor research, or a record of our trading prices, or an offer of, or solicitation for a transaction in any financial instrument and thus should not be treated as such. The information provided does not involve any specific investment objectives, financial situation and needs of any specific person who may receive it. Please be aware, that past performance is not a reliable indicator of future performance and/or results. Past Performance or Forward-looking scenarios based upon the reasonable beliefs of the third-party provider are not a guarantee of future performance. Actual results may differ materially from those anticipated in forward-looking or past performance statements. IC Markets makes no representation or warranty and assumes no liability as to the accuracy or completeness of the information provided, nor any loss arising from any investment based on a recommendation, forecast or any information supplied by any third-party.

