USOIL LOCAL LONG|
✅WTI OIL is expected to bounce from the demand level near $60.00, targeting the $60.70 resistance zone as bullish momentum builds. Time Frame 3H.
LONG🚀
✅Like and subscribe to never miss a new idea!✅
Trade ideas

Crude Oil Trading Strategy for TodayThe resonance of the three core driving forces opens up the space for a rebound.
The global economy is experiencing a weak recovery, with demand resilience exceeding pessimistic expectations: Despite the IEA's downward revision of demand growth for 2025-2026, the global economy has not fallen into recession. In the third quarter, crude oil demand has grown by an average of 750,000 barrels per day, with the rebound in demand for petrochemical feedstocks being a key support, breaking the market consensus of "persistent weak demand".
The cost structure of US shale oil is moving upward: Data from the analysis firm Enverus shows that due to the depletion of high-quality resources and the complexity of the extraction areas, the marginal cost of US shale oil is gradually rising from about $70 per barrel. Most small and medium-sized producers need an oil price of over $65 to make a profit on new well projects, while only large-scale enterprises can maintain a break-even point in the $50-60 range. The current oil price is approaching the cost line, and further declines will curb supply growth, forming a natural bottom support.
Net long positions have risen significantly: The latest CFTC position data shows that Brent crude oil long positions increased by 57,000 contracts, short positions decreased by 62,000 contracts, and net long positions rose by 119,000 contracts compared to the previous period. Market sentiment has shifted from extreme pessimism to a bottoming out and rebound, with continued inflows of new buying supporting oil prices.
Crude Oil Trading Strategy for Today
buy:59.5-60
tp:60.5-61
sl:61.5

Crude Oil Trading Strategy for TodayThe cooling of inflation data strengthens the logic of a rate cut.
The core PCE price index in the United States rose by 2.8% year-on-year in October (lower than the expected 3.0%), reaching a new low since March 2023 and remaining below 3% for three consecutive months, confirming that inflation is approaching the Fed's 2% target. The probability of a 25BP rate cut in December has risen from 65% to 82%, and the cumulative rate cut expectation for 2026 has reached 125BP. In a liquidity-lean environment, the valuation attractiveness of crude oil as a risky asset has significantly increased - historical data shows that the average increase in WTI oil prices during the rate-cut cycle is 12%-15%, and the current price of $61.21 is still in the early stage of valuation recovery.
The US dollar index is under pressure, and the expectation of non-US demand release is expected.
The US dollar index has fallen by 3.2% from its October high and is currently stabilizing below the 92.5 mark. The purchasing power of non-US currencies has rebounded. The purchasing costs of oil-importing countries such as India and China have decreased. In November, India's oil imports are expected to increase by 6% month-on-month (to 5.2 million barrels per day), and China's refineries have received new quotas in November (an additional 12 million tons), and the policy-driven replenishment demand will directly support oil purchases, forming a positive cycle of "weak US dollar - increased purchases - oil price rise".
Crude Oil Trading Strategy for Today
buy:60.5-61
tp:61.5-62
sl:60

Bullish bounce off?WTI Oil (XTI/USD) has bounced off the pivot, which has been identified as a pullback suport and could potentially rise to the 1st resistance.
Pivot: 60.13
1st Support: 58.86
1st Resistance: 63.19
Disclaimer:
The above opinions given constitute general market commentary, and do not constitute the opinion or advice of IC Markets or any form of personal or investment advice.
Any opinions, news, research, analyses, prices, other information, or links to third-party sites contained on this website are provided on an "as-is" basis, are intended only to be informative, is not an advice nor a recommendation, nor research, or a record of our trading prices, or an offer of, or solicitation for a transaction in any financial instrument and thus should not be treated as such. The information provided does not involve any specific investment objectives, financial situation and needs of any specific person who may receive it. Please be aware, that past performance is not a reliable indicator of future performance and/or results. Past Performance or Forward-looking scenarios based upon the reasonable beliefs of the third-party provider are not a guarantee of future performance. Actual results may differ materially from those anticipated in forward-looking or past performance statements. IC Markets makes no representation or warranty and assumes no liability as to the accuracy or completeness of the information provided, nor any loss arising from any investment based on a recommendation, forecast or any information supplied by any third-party.

Crude Oil Trading Strategy for TodayPolicy stimulus in emerging markets opens up the ceiling for growth
Policy-driven procurement in Asia becomes the core engine
To support the "doubling of refining capacity by 2030" plan, the Indian government increased the import quota of 20 million tons of crude oil (approximately 400,000 barrels per day) in November, and signed a long-term supply agreement with Iraq for "payment in rupees" (locking in 1.2 million barrels per day). In the first half of November, India's crude oil import volume increased by 18% year-on-year (reaching 5.6 million barrels per day), reaching a historical high. At the same time, Southeast Asian countries also stepped up their efforts: the Renze refinery in Vietnam (14 million tons per year) officially started production in December, driving a 22% increase in crude oil procurement volume in November compared to the previous month. Indonesia launched the "refinery tax refund policy", increasing processing profits by $8 per barrel, promoting the early release of replenishment demands from refining and chemical enterprises. The overall increase in Asian crude oil imports accounted for 75% of the global demand increase, becoming a core support for short-term demand.
"Discrepancy growth" in transportation and chemical demand
Unlike the decline in transportation fuel demand in Europe and the United States (U.S. gasoline consumption decreased by 2.1% year-on-year), the transportation fuel demand in emerging markets maintained a high growth rate: Indian diesel consumption increased by 7.8% due to infrastructure investment (road and port projects increased by 28% year-on-year), and the demand for aviation kerosene in Southeast Asia increased by 11% month-on-month due to the recovery of tourism (international flight volume recovered to 115% of 2019). More importantly, chemical demand formed a "secondary support" - China's new 1.5 million tons of ethylene plant started production in November, and the purchase volume of naphtha increased by 12% year-on-year; the integrated refining and chemical project of Reliance Industries (25 million tons per year) started raw material reserves, driving a 15% increase in the purchase volume of light crude oil (WTI-related varieties) compared to the previous month, forming a dual demand resilience of "transportation + chemical".
Crude Oil Trading Strategy for Today
buy:59.5-60
tp:60.5-601
sl:59

USOIL SUPPORT, RESISTANCE & TRENDLINE ANALYSISGo "SHORT" IF IT BREAKS 59.63 with 59.32 / 59.01 and 58.70 as the 1st, 2nd & 3rd targets respectively. It should break and sustain each level to reach the above mentioned targets.
Go "LONG" if it breaks 59.63 with 59.94 / 60.01 / 60.69 & 61.41 as the 1st, 2nd, 3rd & 4th targets respectively. It should break and sustain each level to reach the above mentioned targets.
Note: Check for candle patterns as well for proper confirmation.

Crude oil's downward space is expandingDue to a significant increase in U.S. crude oil inventories, WTI prices have extended their decline.
In the short term, crude oil’s trend saw a seesaw battle between bulls and bears near the lower edge of the range, with frequent shifts in momentum. Eventually, the bears prevailed, sending prices lower. The moving averages are in a bearish alignment, indicating an objectively downward short-term trend.
Oil prices have broken below the 60 support level. It is expected that crude oil’s intraday trend will continue to expand downward. And the short-term support is 58.5,If it breaks below 58.5, focus on the support level at 57.5, while resistance above is at 60.8.
Buy 58.5 - 58.8
SL 58
TP 59.3 - 59.8 - 60.3
Sell 60.5 - 60
SL 61
TP 59 - 58.5 - 58

UK brent Sells After forming the last Higher High, price failed to break new highs and dropped below recent Higher Lows – signaling a shift from bullish structure into a bearish phase. Price is now in Correction, pulling back into a broken support area that may act as resistance. An imbalance left below adds confluence for a continuation lower. Waiting for a Lower High to confirm bearish Continuation in line with the higher timeframe downtrend.
The daily chart shows price reacting from a key supply area, adding strong higher-timeframe confluence. With imbalance below and structure now bearish, a confirmed Lower High would validate continuation to the downside
Entry: 61.230
Stop Loss: 62.130
Take Profit: 57.200

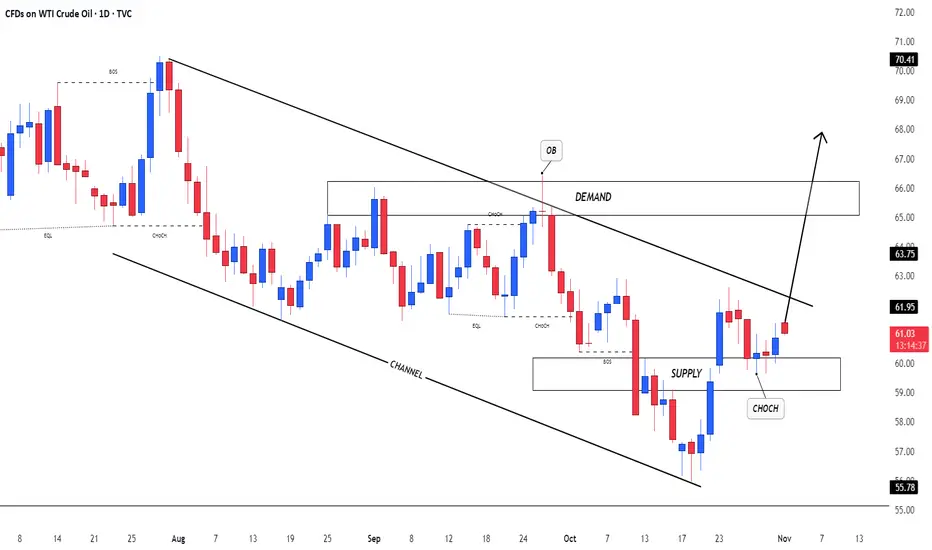
US OilCrude Oil Index
- Bearish Channel as an corrective pattern in Short Time Frame
- RSI - Divergence
- Supply Zone
- Change of Characteristics
- Order Block
Immediate data is negative, and inventory support has weakened. The inventory reduction process in the United States has come to an end, and the expectation of inventory accumulation is rising: The latest high-frequency data shows that the crude oil inventory in the Cushing area increased by 1.8 million barrels (to 36.8 million barrels, reaching a new high since October), ending the previous three-week reduction trend; the U.S. crude oil import volume remained at a high level of 6.1 million barrels per day, coupled with the refinery operating rate dropping from 88.6% to 86.2% (reduced profits led to a decrease in processing demand), short-term inventory accumulation pressure has emerged.
The weak signal on the demand side is clear: European diesel consumption decreased by 8% year-on-year, U.S. gasoline retail sales declined by 3.2% month-on-month, the demand for winter heating oil in the Northern Hemisphere did not start as expected (the spot price of heating oil in the New York port dropped by 5.3% in a week), and terminal demand is unable to support oil prices.
Crude Oil Trading Strategy for Today
sell:61-60.5
tp:60-59.5
sl:62
Short-term bullish core logic: 3 immediate signals resonatePolicy aspect: OPEC+ halts production increase takes effect, $60 defense line is firmly established
On November 3rd, OPEC+ officially announced a 2026 first-quarter production pause, with only a 12-month maintenance increase of 137,000 barrels per day. This decision precisely hedged against the "2 million barrels per day supply surplus in the first quarter" risk warned by IEA. Historical data shows that when OPEC+ voluntarily curbs production during the demand slack period, oil prices often receive a policy support premium of 1-2 weeks. Currently, $60.91 is at the stabilization stage after policy support, and $60, as the marginal cost line for US shale oil, forms a double support.
Inventory aspect: Unexpected continuous inventory reduction, demand resilience exceeds expectations
As of the week ending October 24th, US commercial crude oil inventories dropped by 6.86 million barrels (expected only a 200,000 barrel reduction), gasoline and distillate inventories decreased by 5.94 million barrels and 3.36 million barrels respectively, and all three oil product inventories were below the five-year average by 3%-8%. Although the inventory in the Cushing region increased by 1.334 million barrels month-on-month, the overall commercial inventory has cumulatively decreased by 15.9 million barrels, coupled with the import volume dropping to a 2021 low (510 million barrels per day), the short-term supply-demand tight balance pattern has not changed, providing substantial support for oil prices.
Technical aspect: Bottom formation begins, rebound momentum starts
$60.91 is at the upper edge of the "56.93-61.65" oscillation range, the daily line presents a "hammer pattern + bullish engulfing" combination pattern, and since late October, a clear bottom reversal signal has been formed;
Momentum indicators improve simultaneously: RSI has rebounded from the oversold range to 41, the MACD red bar begins to expand, and after the price stabilizes at the $60 key level, speculative long positions have returned 38,000 contracts in a week, the financial support has strengthened.
Crude Oil Trading Strategy for Today
sell:61-61.5
tp:60.5-60
sl:62
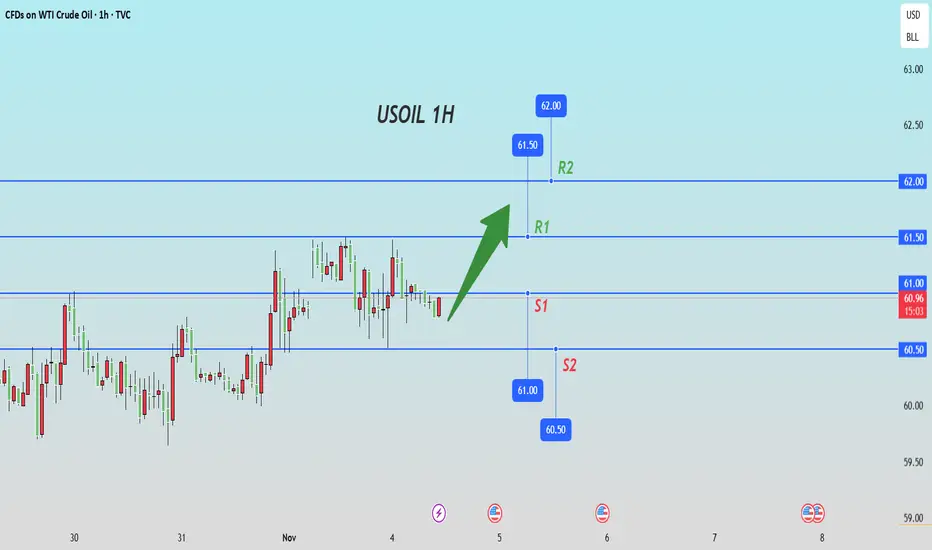
USOIL Symmetrical triangle buying from key support📊 USOIL Update (1H Timeframe)
🟢 Symmetrical Triangle Breakout Setup!
Price holding strong at the key support zone – $60.000 ✅
🎯 Technical Targets:
1️⃣ $60.800
2️⃣ $61.800
3️⃣ $62.400
🧭 Plan:
Looking for buying opportunities from the support zone as long as $60.000 holds.
⚠️ Risk Management is Key!
Always use proper SL and position sizing 🔐
💬 Like ❤️ | Follow 🔔 | Comment 💭 | Share 📢
#USOIL #CrudeOil #WTI #TechnicalAnalysis #PriceAction #ForexTrading #CommodityMarket #TradingSetup

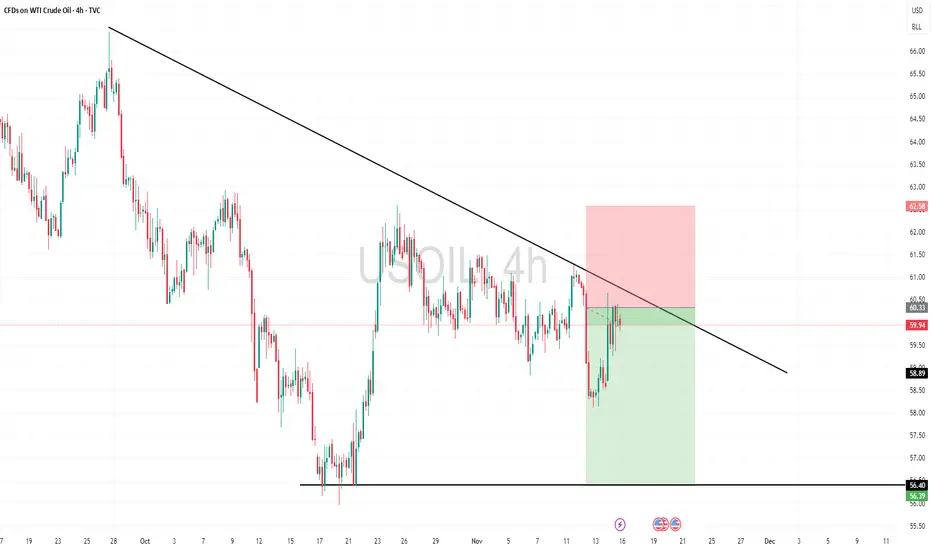
WTI Crude Oil | Flag Breakout Faces Macro ResistanceCrude broke out of its short-term flag, but momentum has been softer than expected — a possible hint of a broader consolidation phase. OPEC+’s pause on supply hikes through Q1’26 aligns with surplus projections, but fresh U.S. sanctions on Russia could flip that narrative fast.
Technical Lens:
Price broke above a descending channel, yet upside follow-through stalled beneath the $62–65 resistance band (former breakdown zone). RSI is mid-range near 55, showing balance between buyers and sellers. A larger flag may be forming within the broader $58–65 structure.
Scenarios:
If $65 holds as resistance → price could drift back toward $58–59 support to reset momentum.
If $65 breaks cleanly → opens scope toward the $68–70 handle, aligning with prior supply zone.
Catalysts:
OPEC+ output guidance revisions, U.S. sanctions enforcement on Russian crude, and global demand indicators heading into winter.
Takeaway:
WTI sits in a technical crossroads between breakout continuation and macro restraint — $62–65 remains the decision zone to watch this week.

BUY USOILOur trade for today is on OIL, as you can see, we bought to target the Daily LQ.
Follow for more trades!

USOIL Is Very Bullish! Buy!
Please, check our technical outlook for USOIL.
Time Frame: 6h
Current Trend: Bullish
Sentiment: Oversold (based on 7-period RSI)
Forecast: Bullish
The market is trading around a solid horizontal structure 60.808.
The above observations make me that the market will inevitably achieve 62.277 level.
P.S
Overbought describes a period of time where there has been a significant and consistent upward move in price over a period of time without much pullback.
Like and subscribe and comment my ideas if you enjoy them!

US OILHI GUYS,
We are still selling as illustrated months ago, nothing has changed , no correction on technical just a clean update on sell entries H4, H3 CHART and price patterns for speed on entry

US OILHI GUYS,
US OIL , we are still selling on weekly chart to area of interest as we expect RT DAILY SOON.

Usoil Daily structure tf
Wave 1/5 has build
Liquidy formed
Bias bullish
Make wait for discount entrry

US-Oil will further push Down-sideHello Traders
In This Chart xtiusd HOURLY Forex Forecast By FOREX PLANET
today XTIUSD analysis 👆
🟢This Chart includes_ (XTIUSD market update)
🟢What is The Next Opportunity on XTIUSD Market
🟢how to Enter to the Valid Entry With Assurance Profit
This CHART is For Trader's that Want to Improve Their Technical Analysis Skills and Their Trading By Understanding How To Analyze The Market Using Multiple Timeframes and Understanding The Bigger Picture on the Charts
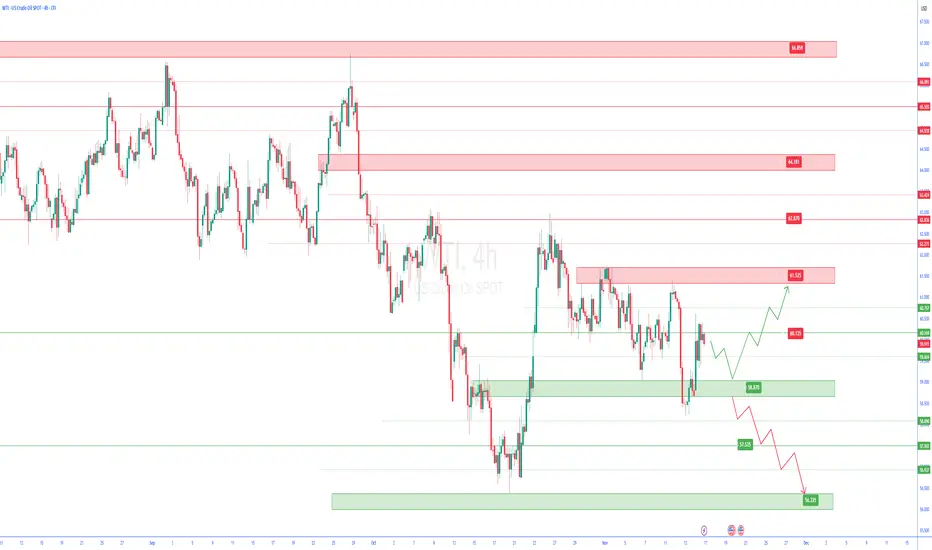
wti 4h🔹 Overall Outlook and Potential Price Movements
In the charts above, we have outlined the overall outlook and possible price movement paths.
As shown, each analysis highlights a key support or resistance zone near the current market price. The market’s reaction to these zones — whether a breakout or rejection — will likely determine the next direction of the price toward the specified levels.
⚠️ Important Note:
The purpose of these trading perspectives is to identify key upcoming price levels and assess potential market reactions. The provided analyses are not trading signals in any way.
✅ Recommendation for Use:
To make effective use of these analyses, it is advised to manually draw the marked zones on your chart. Then, on the 15-minute time frame, monitor the candlestick behavior and look for valid entry triggers before making any trading decisions.
How did crude oil take over and start rising?Rebalancing of Fed policy expectations, weakening of dollar suppression
The core inflation data in the US shows a downward trend. The probability of the Fed cutting interest rates in December remains above 60%, and overly hawkish expectations have been partially corrected. The US dollar index is experiencing pressure near the 100 mark, and the momentum of its previous strength has weakened, reducing its suppression effect on crude oil. Historical data indicates that the negative correlation between the US dollar index and crude oil prices is more significant in volatile markets. If the US dollar declines next week, it will provide liquidity support for the rebound of oil prices.
Next week, we will share the trading strategies for crude oil.
buy:59.50-59.70
tp:60.50-60.70
sl:59.95

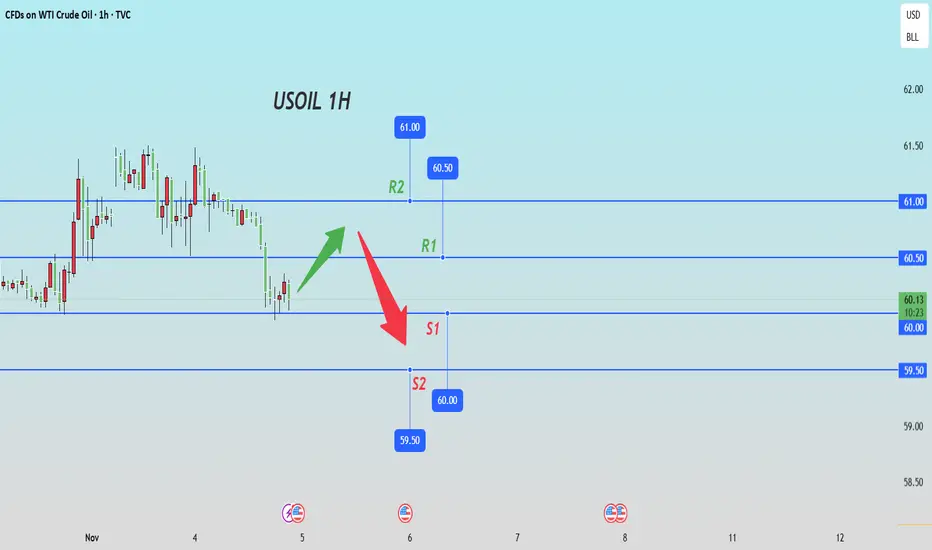
WTI Crude The Week Ahead Key Trading LevelsKey Support and Resistance Levels
Resistance Level 1: 6150
Resistance Level 2: 6210
Resistance Level 3: 6300
Support Level 1: 5936
Support Level 2: 5845
Support Level 3: 5777
This communication is for informational purposes only and should not be viewed as any form of recommendation as to a particular course of action or as investment advice. It is not intended as an offer or solicitation for the purchase or sale of any financial instrument or as an official confirmation of any transaction. Opinions, estimates and assumptions expressed herein are made as of the date of this communication and are subject to change without notice. This communication has been prepared based upon information, including market prices, data and other information, believed to be reliable; however, Trade Nation does not warrant its completeness or accuracy. All market prices and market data contained in or attached to this communication are indicative and subject to change without notice.

U S OILHI GUYS,
We expected a small triple top price pattern H4 last week,
however what has change is a market failed to form the correct sell pattern leading to a wide spread ranging as illustrated in the white box with wrong combination of sell patterns colored purple days of the week strategy.
we are currently out of the white box as of Friday yesterday market presented a proper price pattern on the on going correction.
we expect a continuation buy pattern (Monday, Tuesday) . then later in the week we then expect a sell pattern (Wednesday, Thursday) correction around level 61000
