WTI oversold bounce back capped at 6160The WTI Crude Oil is currently trading with a bearish bias, aligned with the broader downward trend. Recent price action shows a retest of the longer term support, suggesting a temporary relief rally within the downtrend.
Key resistance is located at 6160, a prior consolidation zone. This level will be critical in determining the next directional move.
A bearish rejection from 6160 could confirm the resumption of the downtrend, targeting the next support levels at 5946, followed by 5845 and 5780 over a longer timeframe.
Conversely, a decisive breakout and daily close above 6160 would invalidate the current bearish setup, shifting sentiment to bullish and potentially triggering a move towards 6215, then 6300.
Conclusion:
The short-term outlook remains bearish unless the WTI Crude price breaks and holds above 6160. Traders should watch for price action signals around this key level to confirm direction. A rejection favours fresh downside continuation, while a breakout signals a potential trend reversal or deeper correction.
This communication is for informational purposes only and should not be viewed as any form of recommendation as to a particular course of action or as investment advice. It is not intended as an offer or solicitation for the purchase or sale of any financial instrument or as an official confirmation of any transaction. Opinions, estimates and assumptions expressed herein are made as of the date of this communication and are subject to change without notice. This communication has been prepared based upon information, including market prices, data and other information, believed to be reliable; however, Trade Nation does not warrant its completeness or accuracy. All market prices and market data contained in or attached to this communication are indicative and subject to change without notice.
Trade ideas

USOIL WEEKLY🧩 1. Chart Overview
• Instrument: WTI Crude Oil (TVC: USOIL)
• Timeframe: Weekly (W1)
• Current Price: Around $60.34
• Main Idea: Price is completing a large correction and preparing for a major long-term uptrend.
⸻
⚙ 2. Elliott Wave Structure Breakdown
🔹 Wave Count
• The major Wave (A) peaked near $130–$140 (the 2022 top).
• Since then, oil has been moving in a complex correction labeled as (W)-(X)-(Y) — a typical double zigzag structure.
• You’ve marked the last part as Wave (2) nearing completion — meaning the next leg is expected to be Wave (3) to the upside (a powerful impulsive rally).
⸻
🧠 3. Wyckoff Accumulation Phase
The right side of the chart shows a Wyckoff-style pattern, indicating accumulation after a large markdown.
Key Wyckoff Labels:
• AR (Automatic Rally): The first strong bounce after the selloff, forming the upper boundary of the trading range.
• ST (Secondary Test): Retest of the lower support area.
• Spring: Final shakeout below support — trapping late sellers.
• Test / (2): The end of the correction, confirming accumulation is complete.
✅ Once the spring is confirmed, a strong markup phase (uptrend) usually begins — aligning perfectly with Elliott Wave (3).
⸻
🧭 4. BOS & CHoCH (Smart Money Concepts)
These two terms on the left side represent structure shifts:
• BOS (Break of Structure): Indicates the end of a bearish phase and start of a new bullish leg.
• CHoCH (Change of Character): Early signal of trend reversal — used by institutional traders to identify accumulation/distribution shifts.
So the previous bullish leg (2020–2022) already showed BOS and CHoCH, meaning the market structure turned bullish.
Now, we are in the re-accumulation stage before the next big push.
📈 6. Expected Path (Your Projection)
1. Current Phase: Completing the last leg of correction (Wave (2)) — forming a Wyckoff spring.
2. Next: Bounce and consolidation above $70–80 to confirm accumulation.
3. Then: Major breakout — Wave (3) — targeting $110–$140, possibly over several months into 2026–2027.
Simple Interpretation
WTI Crude Oil is finishing its large corrective phase near $60.
The structure shows a Wyckoff spring + Wave (2) bottom, meaning big accumulation is happening.
Once price breaks above $80, a strong multi-year uptrend could begin, aiming for $120–$140.

Crude Oil Trading Strategy for TodayFunds continue to accumulate: Although the non-commercial net short position of the CFTC remains negative, it has decreased by 80,000 lots in the past two days. Hedge funds have increased their long positions by 120,000 lots in the range of $59 - $60. The trend of fund rebalancing continues, and there is no withdrawal signal.
Refinery replenishment to stabilize: The 3-2-1 cracking spread in the United States remains at $23 per barrel. The processing profit of refineries has not significantly declined, and the operating rate has stabilized at 88%. Corresponding to the daily purchase volume of crude oil, it has increased by 300,000 barrels compared to the beginning of October, and the demand for active replenishment of inventories supports the price.
Crude Oil Trading Strategy for Today
buy:59.5-60
tp:61-61.5
sl:58.5

USOIL Crudeoil bullish forecast down trend breakdout🚨 USOIL (Crude Oil) Technical Update 🚨
🕒 Timeframe: 1H
📉 After a clear downtrend breakout, price has shown a strong bullish consolidation breakout from the key support zone at $60.700.
🔥 Momentum is shifting bullish, signaling potential continuation to the upside.
🎯 Technical Targets:
$61.300 — Initial resistance / short-term target
$62.000 — Mid-term bullish objective
$62.800 — Extended target / next major resistance
📊 Outlook:
As long as price holds above $60.700, buyers remain in control. Watch for sustained volume and candle confirmation for further continuation.
#USOIL #CrudeOil #TechnicalAnalysis #Forex #Commodities #Trading #Breakout #BullishMomentum 💪📈

Crude Oil Trading Strategy for TodayThe policy replenishment window has opened, and official buying has formed a bottoming force. On October 27, the US Department of Energy clearly announced that it plans to purchase 1 million barrels of crude oil to replenish the strategic petroleum reserve (SPR), with the delivery period set from December to January next year, and the purchase price locked in at around $60. Although the single purchase volume is limited, this is the first clear official replenishment action since the oil price dropped, sending a strong signal that "60 dollars is the policy bottom". At the same time, although OPEC+ has entered a production increase cycle, it only plans to increase production by 137,000 barrels per day in November, and there are differences between Saudi Arabia and Russia on the extent of production increase. The actual implementation rate may be lower than expected and is unlikely to form a substantive supply shock.
Crude Oil Trading Strategy for Today
buy:59.5-60
tp:61-61.5
sl:58.5

WTI Crude Oil (USOIL) Bearish OutlookOil is showing clear signs of weakness after rejecting the 61.80–62.00 resistance zone, which has acted as a strong supply area multiple times before. The price failed to maintain bullish momentum and is now turning lower, confirming potential bearish continuation.
The RSI is also pointing down from mid-levels, supporting further downside pressure. If sellers remain in control, a drop toward the 58.00–56.30 zone looks likely.
🔹 Resistance: 61.80 – 62.00
🔹 Support: 58.00 / 56.30
🔹 Bias: Bearish below 61.80
🔹 Timeframe: 4H
Structure remains bearish as long as price trades under the resistance zone — next wave down could be strong.

USOIL TRADE IDEAhi all
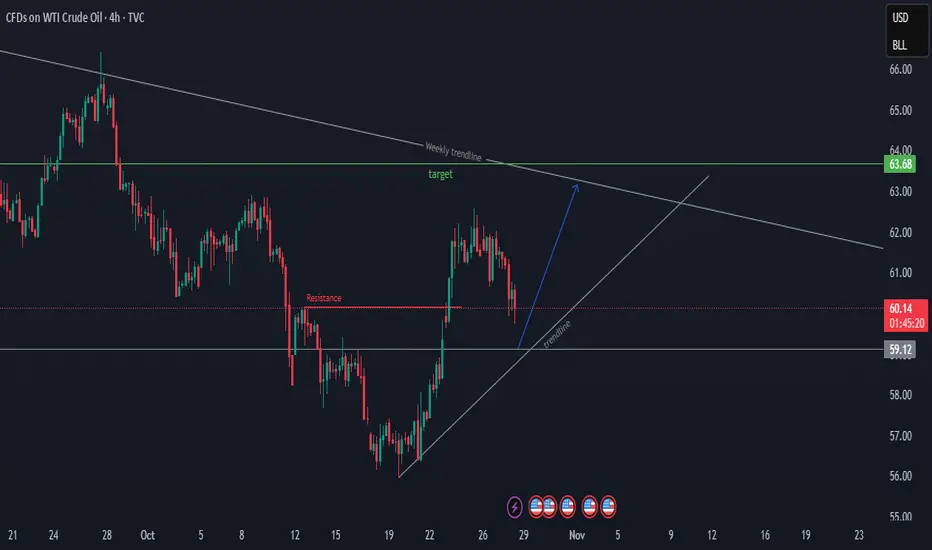
USOIL has broken through the resistance level at 60.17 on the H4 timeframe. The current decline is likely a pullback. In my view, the 59.3–59.1 range presents a good opportunity to go long on USOIL
good luck all
**My trading strategy is not intended to be a signal. It's a process of learning about market structure and sharpening my trading my skills also for my trade journal**
Thanks a lot for your support
US OIL SUPPORT, RESISTANCE & TRENDLINE ANALYSISI hope whoever followed my levels must have been a great help for them.
Go "SHORT" if it breaks 60.46 along with the trendline with 60.07 as first target and breaking that might lead to 59.69 and breaking that as well might lead to 59.30
Go "LONG" if it breaks 60.46 with 60.85 as first target and breaking that might lead to 61.18 and breaking further might lead to 61.56 and if again if breaks and sustains then we might see a good move till 62.23

USOIL Bearish swing tradeEntry from last higher low breakout
RRR 1:2
overall in bearish momentum
have touch it's major support zone before going up


US oil US Oil is forming a bullish flag pattern. Entry will be taken on the breakout of the flag formation. The risk-to-reward ratio for this setup will be 1:1.

Oil Short (B)Oil inventories supply is high, indicating a fundamental bearish bias. By analyzing the technical trend of the market, oil is currently tested the first supply zone, warranting a short to the next demand zone. This setup is basic supply demand.

Crude Oil Long Idea (WTI, 15m)After an extended correction, WTI has reached the lower boundary of the ascending channel, where buying volume spikes are appearing. The market is testing support near $60.70–$60.50, aligning with the median line structure from previous swings.
A potential reversal setup may form if price holds above this zone and reclaims $61.20.
The first bullish target lies near $62.30–$62.60, followed by the upper channel resistance around $63.50.
Bias: short-term long within the broader bullish channel; invalidation if candle closes below $60.00.
In essence — buying oil at the lower edge of the channel, expecting a rebound toward midline resistance.

Crude Oil Trading Strategy for TodayThe current WTI oil price of $61.2 is not merely a fluctuation center, but rather a "multiplier window" formed by the resonance of three core variables - "cost floor, geopolitical breakthrough, and sentiment correction" - indicating a "structural contradiction-driven short-term trend". It is clear that this is a "wave-like market phenomenon" rather than a trend reversal. However, the short-term upward momentum is highly certain:
The cost floor is clearly defined, with $60 being the "iron bottom".
The new well production break-even cost of US shale oil has reached $63 per barrel. The current price of $61.2 is already below the marginal production cost line. From the data, the number of active oil drilling rigs in the US has dropped to 424 (a decrease of 60 compared to the previous year), and if the oil price remains below $60, the shale oil production may be reduced by 1-1.5 million barrels per day next year. The supply contraction expectation has been priced in in advance. At the same time, non-OECD countries are accelerating their replenishment of stocks at low prices, forming "non-tradable inventories" to absorb excess supply, further strengthening the support at $60. The geopolitical sanctions are intensifying, leading to a structural rift in the supply side.
After the US imposed secondary sanctions on Russian oil, India's 1.7 million barrels per day Russian oil long-term contract faces the risk of termination. This part of the demand is now shifting to the spot market in the Middle East, directly pushing the Dubai crude oil premium to $2.1 per barrel (a 3-month high). More importantly, the actual spare capacity of OPEC+ has been seriously overestimated - Saudi Arabia's actual spare capacity is only 60-100 thousand barrels per day, far below the claimed 2.43 million barrels per day, and the OPEC+ has only increased production by 61% for five consecutive months, highlighting the capacity bottleneck and inability to fill potential supply gaps.
The market sentiment is overly pessimistic, with a significant recovery space.
As of October 23rd, the speculative net long position has dropped to a historical low. When Brent oil price fell below $60, 80% of traders held a bearish stance, forming a typical "extreme emotional state". However, the month spread structure still remains positive (Backwardation), not entering the Contango structure, indicating that the spot market does not have a real surplus. The previous decline was more dominated by sentiment, and the demand for recovery is strong.
Crude Oil Trading Strategy for Today
buy:61-61.3
tp:61.6-61.9
SL:60

Capital.com: Crude Oil Sells US OIL Sell Setup – Bearish Structure
US Oil is showing signs of renewed bearish momentum after rejecting a key daily resistance zone. On the 1-hour timeframe, price has confirmed a lower high formation, followed by a decisive break below a key intraday support level—now acting as resistance. This shift in structure suggests potential continuation to the downside, with momentum favoring sellers as long as price remains below the reclaimed zone.
Technical Highlights:
Bearish structure confirmed on the 1H timeframe
Clean break and retest of structure
Momentum building for a potential push toward lower levels
Trade Setup:
Entry: 61.02
Stop Loss: 61.56
Target Levels:
Take Profit 1: 60.59
Take Profit 2: 56.34
This setup offers a favorable risk-to-reward ratio within a well-defined bearish structure. Wait for candle confirmation below resistance if not already in the trade, and always manage your risk according to your plan.
Drop your thoughts or questions below — and if you found this helpful, hit boost and follow for more structured US Oil trade ideas.
Stay sharp. Trade with precision. 🛢️📉

WTI OIL OIL DEFENDED 56$-55$ ZONE ,THE NEXT TECHNICAL BUY POSITION WILL BE 60.79$-61$ ,IF THE LAYER IS RESPECTED I WILL HOLD BUY TILL WE BREAKOUT OF 62.188$ PER BARREL hoping to challenge the long term descending trendline holding price as supply roof and dynamic resistance to upswing.
buy target could exceed 66.219-65.567$
WTI (West Texas Intermediate) crude oil is a major benchmark for oil prices, representing light, sweet crude oil primarily produced in the U.S. It is widely used globally to price various grades of crude oil.
As of late October 2025, WTI crude oil prices have been trading around $61.745 per barrel. The recent price movement reflects several fundamental factors:
Supply Constraints: Ongoing production cuts by OPEC+ members and U.S. sanctions on key oil-producing countries are tightening supply, supporting prices.
Demand Dynamics: Global economic concerns, including slowing growth in major economies, have weighed on demand outlook, causing price volatility.
Inventory Levels: U.S. crude inventory data and storage capacity utilization have affected market sentiment with fluctuating stockpile levels.
Geopolitical Risks: Tensions in the Middle East and trade uncertainties continue to keep risk premium in prices.
Energy Transition Policies: Shifts toward renewable energy and emission reduction targets are influencing longer-term demand forecasts.
In summary, WTI prices near $61-62$ are driven by a mix of supply discipline, cautious demand outlook, and geopolitical uncertainties, creating a balanced but volatile oil market environment
This fundamental backdrop suggests that price action in WTI will remain sensitive to OPEC+ decisions, U.S. economic data, and geopolitical developments.
#USOIL #WTI #OIL #UKOIL

CRUDE OIL Potential Short! Sell!
Hello, Traders!
CRUDE OIL Price is reacting to a clear Horizontal Supply Area after liquidity sweep above the recent swing high. Smart money positioning suggests a short-term redistribution phase as sell-side liquidity below $61 becomes the draw.Time Frame 4H.
Sell!
Comment and subscribe to help us grow!
Check out other forecasts below too!
Disclosure: I am part of Trade Nation's Influencer program and receive a monthly fee for using their TradingView charts in my analysis.

USOIL WILL FALL|SHORT|
✅CRUDE OIL/b] after engineering liquidity above the recent high, price reacted sharply from the 4H supply area, suggesting distribution by institutional players. With buy-side liquidity swept, the market now looks poised to rebalance inefficiency below the $61 handle. Time Frame 4H.
SHORT🔥
✅Like and subscribe to never miss a new idea!✅

USOIL Market Direction: Bearish Tilt Amid Downward Momentum?USOIL Market Direction: Bearish Tilt Amid Downward Momentum?
Current Price Snapshot
As of October 15, 2025, USOIL (WTI Crude Oil) is trading around $58.20 per barrel, reflecting a modest intraday uptick of approximately 0.9% from yesterday's close at $58.66. This follows a 1.39% decline on October 14, extending a broader monthly drop of over 7%. The price has been consolidating in a descending channel, with recent lows testing the $57.29–$57.60 support zone, prompting a short-term corrective bounce.
Technical Indicators
- **Trend Structure**: USOIL remains below a key descending trendline on shorter timeframes (H1–H4), signaling sustained downward pressure. A breakdown below $57.65 could accelerate the slide toward $56.00 or lower, aligning with a potential descending flag pattern.
- **Momentum Oscillators**: The RSI (14-period) is climbing from oversold territory around 31, currently near 35–40, suggesting a temporary relief rally but lacking conviction for a full reversal. The ADX at 41.78 confirms a strong prevailing downtrend.
- **Moving Averages**: Price is below the 50-day SMA ($61.55) and 200-day EMA ($59.15), with bearish crossovers reinforcing the negative bias. Key resistance clusters at $60.44–$60.75 (Fibonacci retracement levels) cap upside potential.
- **Support/Resistance**: Immediate support at $57.29–$57.80; breach targets $56.00. Overhead resistance at $60.75, with a pivot at $61.50. A close above $60.75 would invalidate the bearish setup, but current action shows rejection at these levels.
Fundamental Drivers
- **Supply Dynamics**: OPEC+ is gradually unwinding production cuts, adding ~0.6 million barrels per day (b/d) in 2025, while non-OPEC output (led by the US at 13.5 million b/d) surges by 2.0 million b/d. This floods the market, driving global inventories higher and exerting downward force on prices. Recent US inventory builds (e.g., +1.8 million barrels in commercial crude) further signal softening demand.
- **Demand Outlook**: Resurfacing US-China trade tensions are clouding economic recovery prospects, capping industrial fuel needs. Global growth slowdowns, coupled with accelerated renewable energy investments, are projected to weaken crude consumption through 2026.
- **Geopolitical Factors**: While sanctions on Russia and Middle East risks provide occasional support, they are outweighed by ample supply. EIA forecasts Brent (closely correlated to WTI) averaging $62/bbl in Q4 2025, dropping to $52/bbl in 2026, implying further WTI weakness toward $56–$59 by year-end.
- **Macro Influences**: A strengthening USD (amid Fed hawkishness) makes oil less attractive to non-US buyers, adding to the bearish case. Broader forecasts from Reuters and LongForecast see WTI averaging $64.65 for 2025 but ending October near $52.76, a 15.5% monthly decline.
Sentiment from Market Chatter
Real-time discussions on platforms like X highlight mixed but predominantly cautious views. Some traders eye short-covering bounces toward $60, citing oversold RSI and potential OPEC data surprises, but consensus leans bearish, with calls for sub-$60 targets due to inventory builds and trade war fears. Retail signals show sporadic buy setups, but institutional positioning favors shorts.
Overall Direction and Outlook
**Bearish** – USOIL's trajectory today points downward, with the corrective uptick likely fizzling at $60 resistance. Expect continued pressure toward $57–$56 unless a decisive break above $60.75 emerges, which would shift bias to neutral.
Monitor upcoming EIA inventory data and US-China headlines for volatility spikes. Position sizing should account for low ATR (0.40), indicating subdued near-term swings. This assessment draws from a synthesis of price action, indicators, supply-demand fundamentals, and market sentiment for a comprehensive view.


DOWN TRENDCrude oil price has reached major supply zone and has accumulated because of the strong zone. price has broken the liquidity structure indicating a bearish reversal for a long retracement

Will oil continue to rise? Yes, definitely.
Hi my Dears
Following recent trade policies, it seems that there is still room for oil to grow and we should see oil prices rise. The first price target we can hope for is $63.
Do you think it could happen?

USOIL – Daily Rejection & 4H Bearish Engulfing: Short Setup from 💬 Trade Description:
Price on **USOIL** recently pushed into a **daily supply zone** around the **62.00 area**, which had previously acted as a strong rejection point.
On the **daily timeframe**, a **clear pin-bar rejection** formed, showing that buyers lost control and sellers are stepping back into the market.
Dropping down to the **4-hour timeframe**, price created a **bearish engulfing candle** directly inside that same daily supply zone — confirming a strong **shift in momentum** and offering a precise entry opportunity.
This setup aligns perfectly with the **higher-timeframe bearish structure**, where the market continues to print **lower highs and lower lows**.
The reaction from the 62.00 zone suggests a potential continuation to the downside as price seeks liquidity near the **next major demand zone around 57.00**.
⚙️ Trade Breakdown:
* **Weekly Bias:** Bearish — market creating lower highs.
* **Daily Confirmation:** Pin bar rejection from daily supply.
* **4H Entry Trigger:** Bearish engulfing after retest.
* **Entry:** After 4H candle close.
* **Stop Loss:** Above the 4H engulfing high.
* **Take Profit:** Targeting 57.00 (next demand zone).
---
## 🧩 Technical Insights:
* The **daily pin bar** served as higher-timeframe confirmation that sellers were defending a premium level.
* The **4H engulfing** offered an early confirmation of short-term structure shift.
* The **trade idea** follows a simple, high-probability model:
**“Daily confirmation → 4H execution → Patience for follow-through.”**
---
## 💭 Trader’s Note:
Patience was key on this one. I waited for the daily signal first before dropping to the 4H to catch the clean bearish momentum. This is how I’m structuring all my trades now — only executing when the higher-timeframe aligns with the lower-timeframe trigger.
Discipline > Frequency.
Quality > Quantity.
