USOIL trade ideas
US OIL LONG SETUP Oil price had been in a falling channel and held the Trendline Support, making attempts to form an ascending wedge, from where I took the long position and price moved up initially but couldn't break the zone to continue upward.

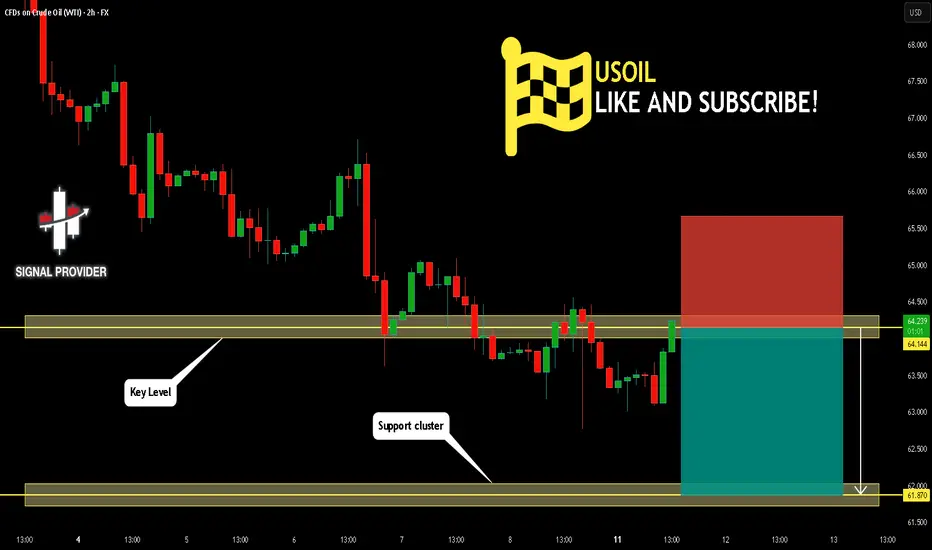
USOIL Is Going Down! Sell!
Take a look at our analysis for USOIL.
Time Frame: 2h
Current Trend: Bearish
Sentiment: Overbought (based on 7-period RSI)
Forecast: Bearish
The price is testing a key resistance 64.144.
Taking into consideration the current market trend & overbought RSI, chances will be high to see a bearish movement to the downside at least to 61.870 level.
P.S
Overbought describes a period of time where there has been a significant and consistent upward move in price over a period of time without much pullback.
Disclosure: I am part of Trade Nation's Influencer program and receive a monthly fee for using their TradingView charts in my analysis.
Like and subscribe and comment my ideas if you enjoy them!
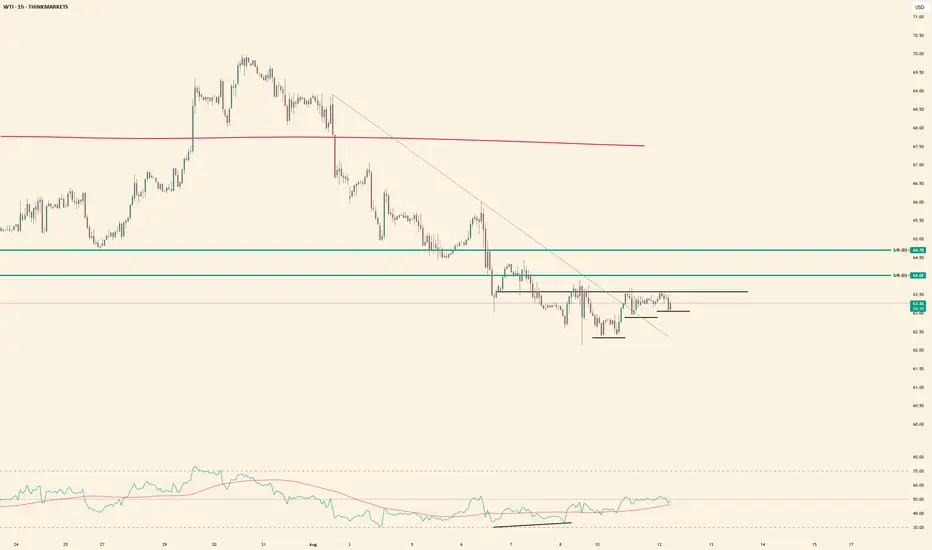
US OILS Detailed AnalysisTechnical Summary:
The primary trend of WTI is bearish, and the prices on a 4H chart also continue their downtrend within a declining wedge pattern.
However, prices are retracing after testing the lower fib level 0.0 (61.33) and are currently trending above a crucial psychological & historically tested support of 62.00.
If prices remain able to sustain higher, then it might test important resistance at 63.00, with a near hurdle at the fib level 0.236 (63.45).
Indicator Interpretation:
The prices are rising after testing the lower Bollinger band, signaling a bullish reversal.
Alternate Scenario
If crude oil breaks the crucial support zone between 62.0 - 61.8, then it could signal rising bearish pressure.
Key Levels
Resistance
R1 = 62.45
R2 = 63.15
Support
S1 = 62.00
S2 = 61.30
Facts & Figures:
The world produces about 95–100 million barrels of crude oil per day, with major producers including the U.S., Saudi Arabia, Russia, and Canada.

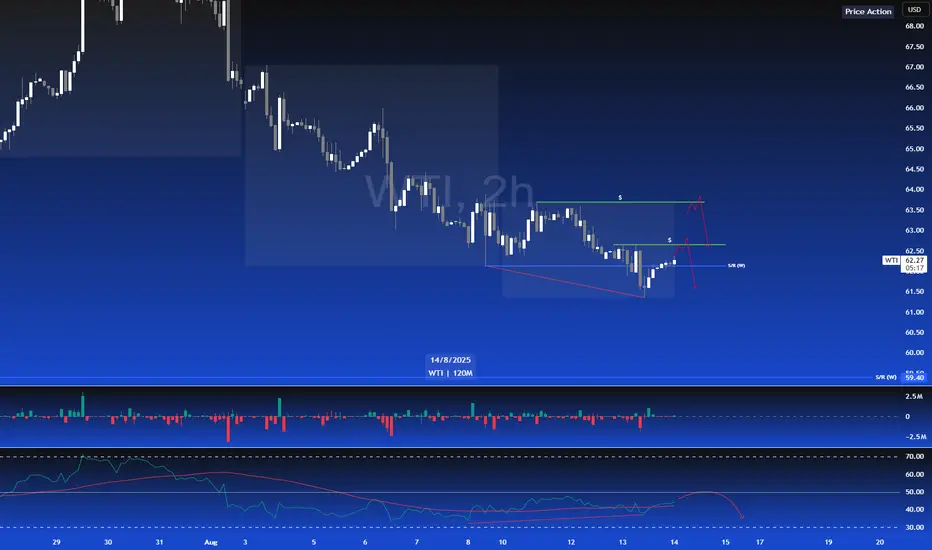
Hellena | Oil (4H): SHORT to support area of 61.937 (Fibo lvl).Hello, colleagues!
Well, I think that the previous scenario is still relevant and the “ABC” correction is developing according to the scenario.
At the moment, I see a five-wave structure in the downward wave “C”. I expect a small correction to the area of 67.287, then a continuation of the downward movement to the area between 61.8% and 100% of the levels of Fibonacci extension - the support area of 61.937.
Manage your capital correctly and competently! Only enter trades based on reliable patterns!

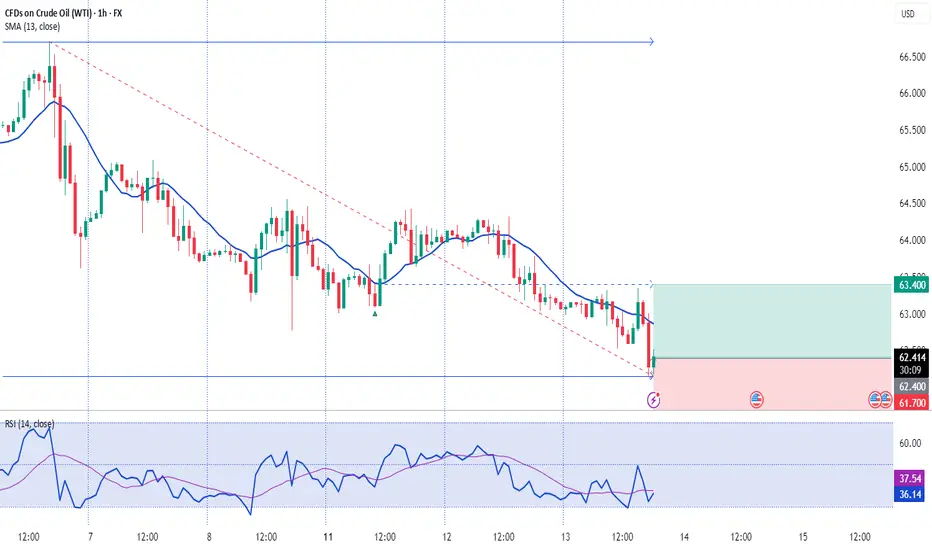
WTI Crude Intraday Buy: Oversold Extremes Signal Dip-BuyTrade Idea - WTI Crude – Buy Limit
Entry: 62.000
Target: 65.260
Stop Loss: 61.000
Type: Intraday
Trade Idea:
The rally was sold and the dip bought, resulting in mild net losses yesterday.
Bespoke resistance is located at 65.26.
There is scope for mild selling at the open, but losses should be limited.
Price is trading at oversold extremes, and the preferred trade is to buy on dips targeting a rebound towards resistance.
Resistance Levels: 63.620 / 65.260 / 66.140
Support Levels: 62.190 / 62.000 / 61.580
Next Volatile Events:
14/08/2025 13:30 – Producer Price Index ex Food & Energy (YoY), US
Disclosure: I am part of Trade Nation's Influencer program and receive a monthly fee for using their TradingView charts in my analysis.

Waiting for pullback USOILPrice has come down the last few days i think it needs a breather. Im looking at these levels for a possible stop hunts before resuming the trend.
Whats your thougts?
USOIL : Back below $63.50Price is now dipping below $63.50 for the second time. I think this time it would just go all the way.
This is the best recession indicator.
Be careful if you are into RISK assets.
Brace for impact.
Good luck.

USOIL - BEARISH MOVE!Hello Traders!
After strong selling pressure,
The USOIL broke the support level (64.970 - 63.983).
This key level becomes new resistance!
So, I expect a new bearish move📉
___________
TARGET: 60.85🎯

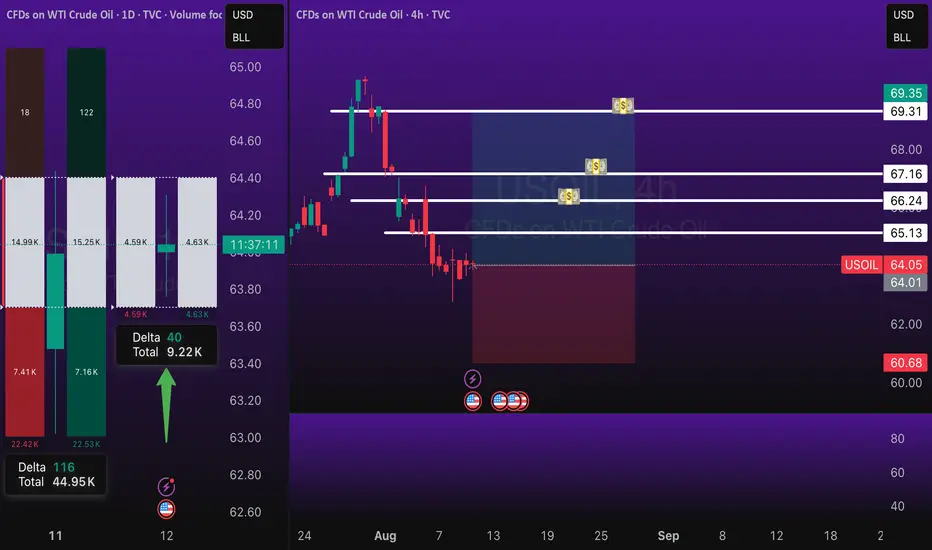
EXPECT A BULLISH MOMENTUM SOON ON WTIPrice is forming a falling wedge pattern on WTI and I anticipate a quick turnaround in price. Technically, a buy opportunity is envisaged from the current market price. Target profit is at $64.8 per barrel.

Crude Oil Analysis (WTI / USOIL)
Crude oil prices are currently trading near a key resistance area at $63.30, with the overall trend still bearish, awaiting today’s crude oil inventory report.
🔻 Bearish Scenario:
If the price breaks below $62.60 and holds, it may target the $62.00 level, which could act as a potential rebound area.
🔺 Bullish Scenario:
If the price regains momentum and breaks above $63.30 with a confirmed hold, it could retest the $64.30 level.

WtiIf price drops below 62.782 then the ending diagonal scenario will be canceled.
Let's see how wti prices to Crude inventory after couple of hours.

Market Analysis: WTI Crude Oil Struggles In RedMarket Analysis: WTI Crude Oil Struggles In Red
WTI Crude oil is also down and remains at risk of more losses below $62.00.
Important Takeaways for WTI Crude Oil Price Analysis Today
- WTI Crude oil prices extended losses below the $65.00 support zone.
- A major bearish trend line is formed with resistance at $63.05 on the hourly chart of XTI/USD.
WTI Crude Oil Price Technical Analysis
On the hourly chart of WTI Crude Oil, the price struggled to continue higher above $66.00 against the US Dollar. The price formed a short-term top and started a fresh decline below $65.00.
There was a steady decline below the $64.50 pivot level. The bears even pushed the price below $63.50 and the 50-hour simple moving average. Finally, the price tested the $62.15 zone, and the price is now consolidating losses.
On the upside, immediate resistance is near the 23.6% Fib retracement level of the downward move from the $65.98 swing high to the $62.15 low at $63.05. There is also a major bearish trend line at $63.05 and the 50-hour simple moving average.
The main hurdle is $63.50. A clear move above the $63.50 zone could send the price toward the 61.8% Fib retracement level at $64.50.
The next key resistance is near $66.00. If the price climbs further higher, it could face sellers near $68.00. Any more gains might send the price toward the $70.00 level.
Immediate support is near the $62.15 level. The next major level on the WTI crude oil chart is near $61.20. If there is a downside break, the price might decline toward $60.00. Any more losses may perhaps open the doors for a move toward the $55.00 zone.
This article represents the opinion of the Companies operating under the FXOpen brand only. It is not to be construed as an offer, solicitation, or recommendation with respect to products and services provided by the Companies operating under the FXOpen brand, nor is it to be considered financial advice.

USOIL LONG FROM SUPPORT
USOIL SIGNAL
Trade Direction: short
Entry Level: 62.65
Target Level: 68.77
Stop Loss: 58.58
RISK PROFILE
Risk level: medium
Suggested risk: 1%
Timeframe: 1D
Disclosure: I am part of Trade Nation's Influencer program and receive a monthly fee for using their TradingView charts in my analysis.
✅LIKE AND COMMENT MY IDEAS✅

WTI Crude downtrend capped at 6600The WTI Crude Oil is currently trading with a bearish bias, aligned with the broader downward trend. Recent price action shows a retest of the resistance, suggesting a further selling pressure within the downtrend.
Key resistance is located at 6600, a prior consolidation zone. This level will be critical in determining the next directional move.
A bearish rejection from 6600 could confirm the resumption of the downtrend, targeting the next support levels at 6200, followed by 6100 and 6000 over a longer timeframe.
Conversely, a decisive breakout and daily close above 6600 would invalidate the current bearish setup, shifting sentiment to bullish and potentially triggering a move towards 6710, then 6800.
Conclusion:
The short-term outlook remains bearish unless the pair breaks and holds above 6600. Traders should watch for price action signals around this key level to confirm direction. A rejection favours fresh downside continuation, while a breakout signals a potential trend reversal or deeper correction.
This communication is for informational purposes only and should not be viewed as any form of recommendation as to a particular course of action or as investment advice. It is not intended as an offer or solicitation for the purchase or sale of any financial instrument or as an official confirmation of any transaction. Opinions, estimates and assumptions expressed herein are made as of the date of this communication and are subject to change without notice. This communication has been prepared based upon information, including market prices, data and other information, believed to be reliable; however, Trade Nation does not warrant its completeness or accuracy. All market prices and market data contained in or attached to this communication are indicative and subject to change without notice.

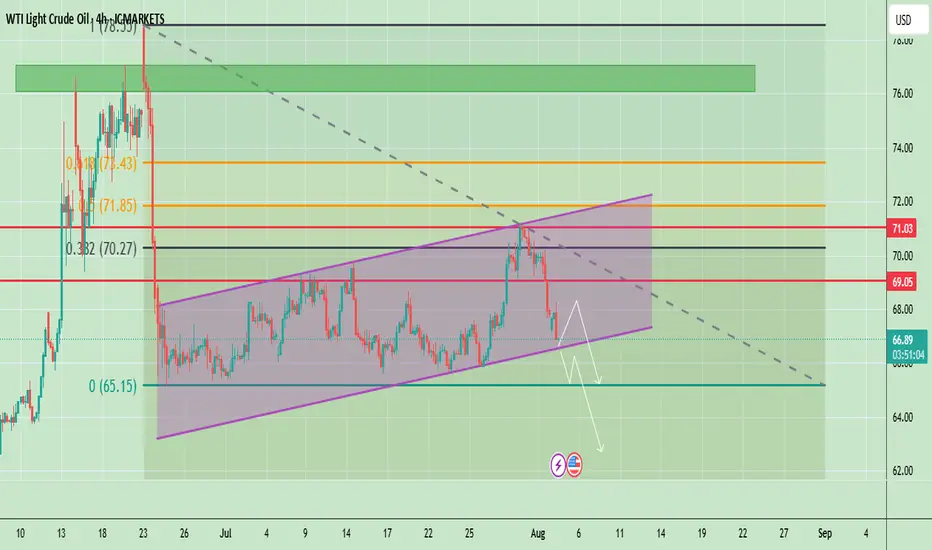
Oil at Key Support – Bounce or Breakdown?Crude oil is trading around $66.94, showing a bearish correction after failing to hold above $69.05. The chart shows price respecting an ascending channel but currently testing its lower boundary. The recent drop signals weakening bullish momentum, and a confirmed break below the channel could accelerate selling pressure toward lower levels.
📈 Potential Scenarios
- Bullish Rebound: If price holds above the channel support (~$66.00–$66.50) and breaks back above $69.05, it may target $71.03 and possibly $72.00.
- Bearish Breakdown: A confirmed close below $66.00 can accelerate the downside toward $65.00, with extended targets near $63.50–$62.00.
📊 Key Technical Highlights
- Price rejected from the channel top and is now testing lower support.
- Key resistance zones: $69.05 (immediate), $71.03 (major).
- Key support zones: $66.00 (channel), then $65.00–$63.50 (breakdown targets).
- Momentum indicators show weakening buying pressure, favoring cautious trading.
🔑 Key Levels to Watch
- Resistance: $69.05 → $71.03 → $72.00
- Support: $66.00 → $65.00 → $63.50
🧭 Trend Outlook
- A short-term relief bounce is possible, but failure to reclaim $69.05 keeps sellers in control.
- Breaking below the channel would shift the overall outlook to bearish for August.
Note
Please risk management in trading is a Key so use your money accordingly. If you like the idea then please like and boost. Thank you and Good Luck!
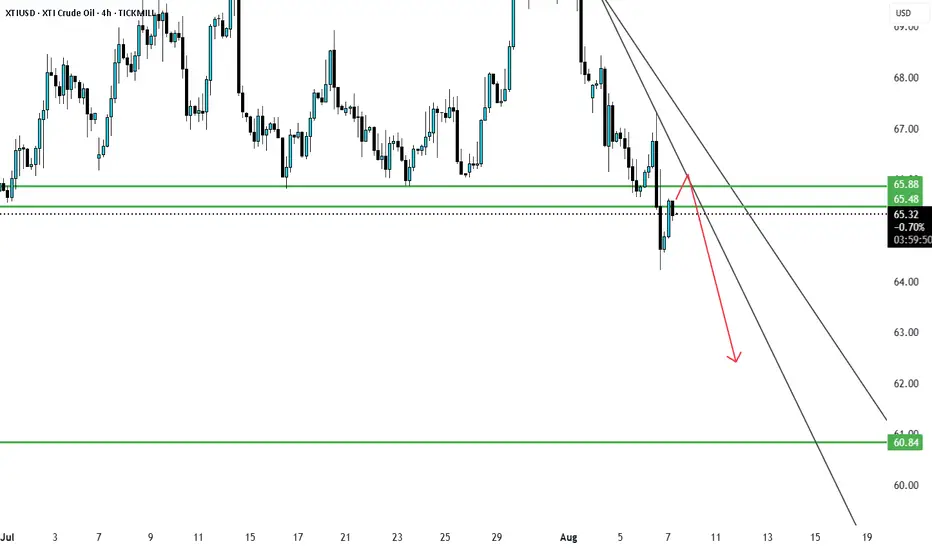
XTIUSD Broken Major support and retesting currentlyXTI/USD has broken a major support level and is currently retesting it. The price is expected to resume its downward movement toward the next support zone. Upcoming news tomorrow may influence the market, so please trade with caution.
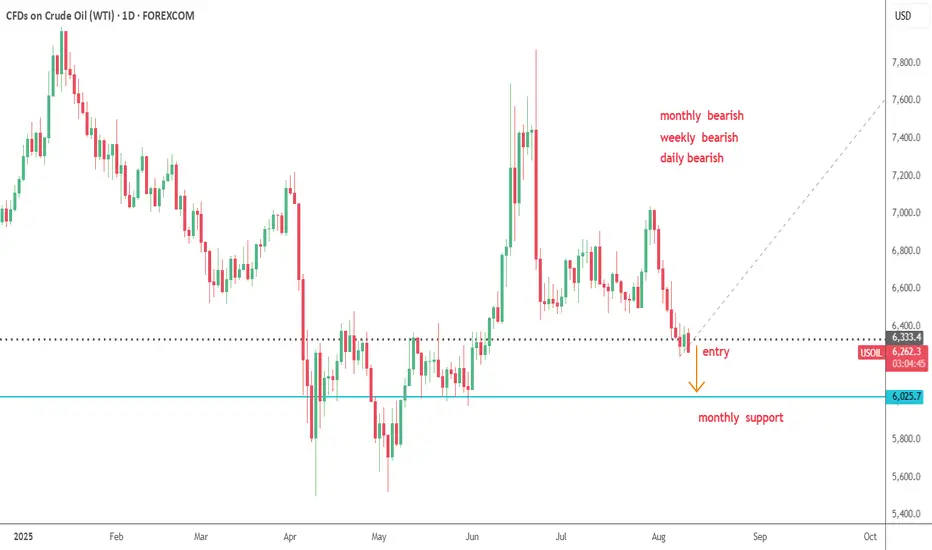
USOIL--SHORT--monthly,weekly, daily bearish
--expecting to fall towards blue monthly support
--entry and tp are as shown on chart
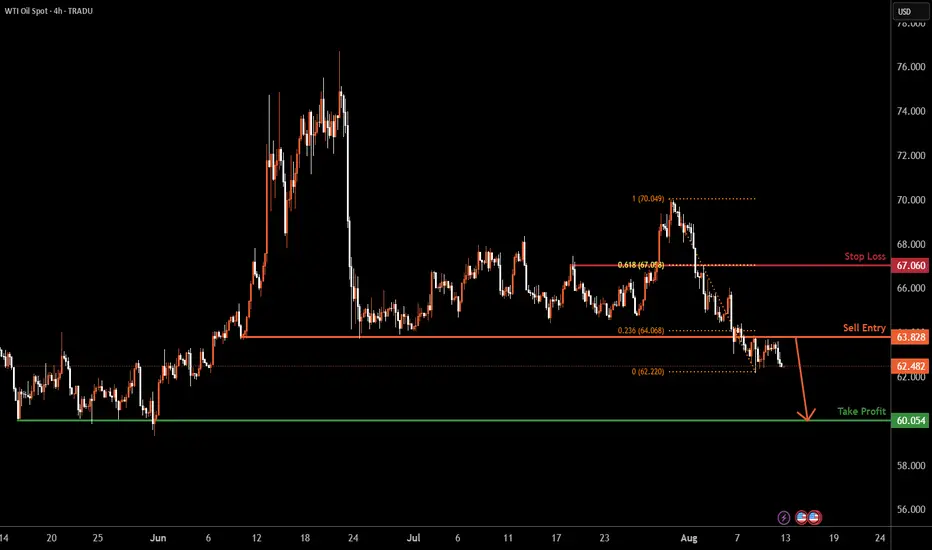
USOIL H4 | Potential bearish dropBased on the H4 chart analysis, we can see the price has rejected off the sell entry which acts as a pullback resistance that lines up with the 23.6% Fibonacci retracement and could drop to the downside.
Sell entry is at 64.13, which is a pullback resistance that lines up with the 23.6% Fibonacci retracement.
Stop loss is at 67.06, which is a pullback resistance that aligns with the 61.8% Fibonacci retracement.
Take profit is at 60.05, which is a multi-swing low support.
High Risk Investment Warning
Trading Forex/CFDs on margin carries a high level of risk and may not be suitable for all investors. Leverage can work against you.
Stratos Markets Limited (tradu.com ):
CFDs are complex instruments and come with a high risk of losing money rapidly due to leverage. 65% of retail investor accounts lose money when trading CFDs with this provider. You should consider whether you understand how CFDs work and whether you can afford to take the high risk of losing your money.
Stratos Europe Ltd (tradu.com ):
CFDs are complex instruments and come with a high risk of losing money rapidly due to leverage. 66% of retail investor accounts lose money when trading CFDs with this provider. You should consider whether you understand how CFDs work and whether you can afford to take the high risk of losing your money.
Stratos Global LLC (tradu.com ):
Losses can exceed deposits.
Please be advised that the information presented on TradingView is provided to Tradu (‘Company’, ‘we’) by a third-party provider (‘TFA Global Pte Ltd’). Please be reminded that you are solely responsible for the trading decisions on your account. There is a very high degree of risk involved in trading. Any information and/or content is intended entirely for research, educational and informational purposes only and does not constitute investment or consultation advice or investment strategy. The information is not tailored to the investment needs of any specific person and therefore does not involve a consideration of any of the investment objectives, financial situation or needs of any viewer that may receive it. Kindly also note that past performance is not a reliable indicator of future results. Actual results may differ materially from those anticipated in forward-looking or past performance statements. We assume no liability as to the accuracy or completeness of any of the information and/or content provided herein and the Company cannot be held responsible for any omission, mistake nor for any loss or damage including without limitation to any loss of profit which may arise from reliance on any information supplied by TFA Global Pte Ltd.
The speaker(s) is neither an employee, agent nor representative of Tradu and is therefore acting independently. The opinions given are their own, constitute general market commentary, and do not constitute the opinion or advice of Tradu or any form of personal or investment advice. Tradu neither endorses nor guarantees offerings of third-party speakers, nor is Tradu responsible for the content, veracity or opinions of third-party speakers, presenters or participants.
116 to be reached in november 2022Look how those fibonacci timezones (zone 2) are doing they're job
The next target is 98 hit march/22 (Topzone 3)
Followed by correction to 80 in may/22 (bottomzone 3)
and eventually we will make a new high aournd 116 in november 2022 (topzone 5)
Let's see if this works out guys, i'm curious
cheers

Crude Oil Analysis (WTI / USOIL)Crude oil is currently trading near a key resistance area around $64.00, with the overall trend still bearish.
🔹 Bearish Scenario:
If the price breaks below $63.60 and holds, it may target $62.80 followed by $62.00.
🔹 Bullish Scenario:
If the price manages to break above $64.58 and sustain the move, it could retest the $65.00 zone, and with continued bullish momentum, extend toward $66.30.

USOIL - Are we having a bullish preasure??Market has started to consolidate creating higher lows on the 1 hour. Is this a sign market might turn?
USOIL Long trade Risking 1% to make 1.6% ProfitTVC:USOIL Long trade, with my back testing of this strategy, USOIL is long.
This is good trade.
Don't overload your risk like Greedy gambler!!!
Be Disciplined Trader, what what you can afford.
Use proper risk management
Looks like good trade.
Lets monitor.
Use proper risk management.
Disclaimer: only idea, not advice