USOIL - Short from bearish order block !!Hello traders!
‼️ This is my perspective on USOIL.
Technical analysis: Here we are in a bearish market structure, so I look for a short . My point of interest is if price continue the retracement to fill the imbalance higher and then to reject from bearish order block + liquidity zone.
Like, comment and subscribe to be in touch with my content!
USOIL trade ideas

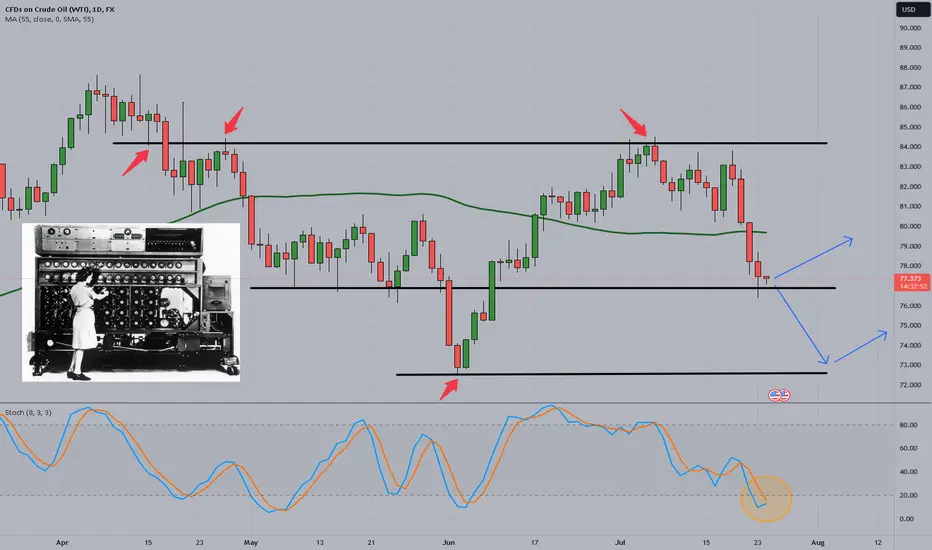
WTI OIL Correction is over. Buy strongly.WTI Oil (USOIL) followed our July 02 (see chart below) sell signal to perfection as it got rejected on the Lower Highs trend-line and Resistance 1 and broke today below the 0.618 Fib, hitting our 77.00 Target in the process:
For that projection we used the February 05 Low as a benchmark, which also hit the 0.618 Fib and rebounded on the 1W MA200 (red trend-line). That has been the multi-year Support level for WTI, so we currently won't get a better long-term buy signal than this.
As a result, we are now turning bullish again on Crude, targeting the -0.5 Fib extension (as on the April 05 High) at 90.50.
Note also that the 1D RSI is almost oversold at 30.00, a clear cyclical buy signal in the recent past (green circles).
-------------------------------------------------------------------------------
** Please LIKE 👍, FOLLOW ✅, SHARE 🙌 and COMMENT ✍ if you enjoy this idea! Also share your ideas and charts in the comments section below! This is best way to keep it relevant, support us, keep the content here free and allow the idea to reach as many people as possible. **
-------------------------------------------------------------------------------
💸💸💸💸💸💸
👇 👇 👇 👇 👇 👇

CRUDE OIL (WTI): Massive Breakout Sell?!📉USOIL has dropped below an important daily support level and has now turned into resistance.
It is likely that a bearish trend will persist, with the next support level at 75.50.

Possible Decline in OIL price to 72$CHoCH in the 4hr timefrme, also a break of structure, indicating a possible decline in oil price to 72$.
Remember: Risk Management very important

OIL: Day 3 short in the market, inside day and potential FGDHi everyone and welcome to my channel, please don’t forget to support all my work subscribing and liking my post, and for any question leave me a comment, I will be more than happy to help you!
“Trade setups, not movements”
1. DAY OF THE WEEK (Failed Breakout, False Break, Range Expansion)
Monday DAY 1 Opening Range
Tuesday DAY 2 Initial Balance
Wednesday DAY 3 (reset DAY 1) Mid Point Week
Thursday DAY 2 ✅ no daily cycle
Friday DAY 3 Closing Range
2. SIGNAL DAY
First Red Day
First Green Day ✅
3 Days Long Breakout
3 Days Short Breakout ✅
Inside Day ✅
3. WEEKLY TEMPLATE
Pump&Dump
Dump&Pump ✅
Frontside
Backside
4. THESIS:
Long: primary, considering the overall template and signal day, I would be looking for a long trade if the market will consolidate till 9am at least for a potential dump and pump template, long trade back to Asia high.
Short: secondary, no daily high has been triggered yet, Oil can potential keep going down. I do not exclude a blow off with the original trend. However, is not a setup I mastered
Please note that the purpose of my analysis is to help me and you hunting the best trade setup for the day, none of my technical aspects are a way to forecast any directional market movement.
Gianni

Looking to start your day with an edge in trading?Good morning FX traders! 🌍 Looking to start your day with an edge in currency trading? Here's the best way to read market sentiment every morning:
1️⃣Economic calendar: Begin by checking the economic calendar for scheduled releases of important economic indicators, such as interest rate decisions, employment data, inflation figures, and GDP reports. These events can shape currency sentiment. Compare overnight data to your previous session's baseline bias.
2️⃣Central bank communications: Monitor upcoming and review overnight statements, speeches, and press conferences from central banks, especially those of major economies. Central bank actions and policymakers' comments can heavily influence currency market sentiment. Here too, compare your new bias to previous baseline to see if anything has changed.
3️⃣Technical analysis: Utilize technical tools like support and resistance levels, trendlines, and Fibs to analyze currency pairs' price action. Patterns and key indicators like RSI, Stochastics or MACD can offer insights into market sentiment. Reading price action momentum is important in order to come up with the best trade ideas. TradingView makes this extremely easy!
4️⃣Sentiment indicators: Keep an eye on sentiment indicators specifically tailored for currency markets, such as the COT report (Commitments of Traders), which reveals the positioning of large traders in futures markets. It can indicate prevailing sentiment. You can also use Central Banks odds trackers (such as FEDwatch), the FEAR/GREED meter and your own risk reading markers (I mostly use equities, Yen, commodity currencies and bond yields).
5️⃣News wires and social media: Follow trusted news wires and forex-focused social media accounts to stay updated on geopolitical developments, breaking news, and market chatter. This can provide valuable context and sentiment analysis, especially if you cannot afford a squawk service.
Remember, currency market sentiment is influenced by a multitude of factors. Stay well-informed, evaluate various sources, and trust your own analysis. Adapt swiftly and make prudent trading decisions. Wishing you profitable trades this week!
WTI OIL Still bearish but watch this level for a reversal.WTI Oil (USOIL) is posting today the 2nd straight green 1D candle following yesterday's EIA report but the short-term pattern remains a (dashed) Channel Down, which keeps the trend bearish. Ever since the July 05 rejection at the top (Lower Highs trend-line) of the 1-year Triangle pattern, we've been aiming for a 1W MA200 (red trend-line) contact, similar to the February 05 2024 Low.
As long as the 1D RSI remains below its MA trend-line, we will remain bearish, moving however our medium-term Target a bit higher to 78.50.
If however the RSI breaks above its MA, we will close the short immediately and buy instead on the bullish break-out, targeting 87.60 (Resistance 2).
Keep also an eye on the RSI's Symmetrical Support level (43.35) for a potential reversal.
-------------------------------------------------------------------------------
** Please LIKE 👍, FOLLOW ✅, SHARE 🙌 and COMMENT ✍ if you enjoy this idea! Also share your ideas and charts in the comments section below! This is best way to keep it relevant, support us, keep the content here free and allow the idea to reach as many people as possible. **
-------------------------------------------------------------------------------
💸💸💸💸💸💸
👇 👇 👇 👇 👇 👇

Hellena | Oil (4H): Short to support area 72.631 (Wave 3).Dear colleagues, I am still hoping for a downward movement, it's just that I have revised the wave formation because the price has gone quite high.
At the moment, I believe that the price is now completing the movement in the senior wave "2". After reaching the resistance area of 84.00 - 85.00, I expect the beginning of the big wave "3"!
Therefore, I suggest to take what happened as an opportunity to enter a short position in the most profitable way!
Manage your capital correctly and competently! Only enter trades based on reliable patterns!

USOIL Potential Uptrend Line Breakout At $76.54 25.07.2024USOIL potential uptrend line breakout at $76.54 on 1hr chart.
If the breakout holds:
Price may drop to $75.61.
Breaking $75.61 could lead to further decline.
If the breakout fails:
Price may rise to $77.71.
Breaking $77.71 could push price up to $79.20.
Apply risk management
Risk Warning: Trading in CFDs is highly speculative and carries a high level of risk. It is possible to lose all of your invested capital. These products may not be suitable for everyone, and you should ensure that you fully understand the risks taking into consideration your investment objectives, level of experience, personal circumstances as well as personal resources. Speculate only with funds that you can afford to lose. Seek independent advice if necessary. Please refer to our Risk Disclosure.
BDSwiss is a trading name of BDS Markets and BDS Ltd.
BDS Markets is a company incorporated under the laws of the Republic of Mauritius and is authorized and regulated by the Financial Services Commission of Mauritius ( FSC ) under license number C116016172, address: 6th Floor, Tower 1, Nexteracom Building 72201 Ebene.
BDS Ltd is authorized and regulated by the Financial Services Authority Seychelles (FSA) under license number SD047, address: Suite 3, Global Village, Jivan’s Complex, Mont Fleuri, Mahe, Seychelles. Payment transactions are managed by BDS Markets (Registration number: 143350)
Disclaimer

USOIL Will Go Higher! Long!
Take a look at our analysis for USOIL.
Time Frame: 1D
Current Trend: Bullish
Sentiment: Oversold (based on 7-period RSI)
Forecast: Bullish
The price is testing a key support 78.234.
Current market trend & oversold RSI makes me think that buyers will push the price. I will anticipate a bullish movement at least to 82.164 level.
P.S
Overbought describes a period of time where there has been a significant and consistent upward move in price over a period of time without much pullback.
Like and subscribe and comment my ideas if you enjoy them!

USoil will further push Down-side After Breaking SupportHello Traders
In This Chart xtiusd HOURLY Forex Forecast By FOREX PLANET
today XTIUSD analysis 👆
🟢This Chart includes_ (XTIUSD market update)
🟢What is The Next Opportunity on XTIUSD Market
🟢how to Enter to the Valid Entry With Assurance Profit
This CHART is For Trader's that Want to Improve Their Technical Analysis Skills and Their Trading By Understanding How To Analyze The Market Using Multiple Timeframes and Understanding The Bigger Picture on the Charts

WTI Oil H4 | Potential bearish reversalWTI oil (USOIL) is rising towards a pullback resistance and could potentially reverse off this level to drop lower.
Sell entry is at 79.03 which is a pullback resistance that aligns with the 38.2% Fibonacci retracement level.
Stop loss is at 80.70 which is a level that sits above the 50.0% Fibonacci retracement level and a pullback resistance.
Take profit is at 75.23 which is a pullback support that aligns close to the 78.6% Fibonacci retracement level.
High Risk Investment Warning
Trading Forex/CFDs on margin carries a high level of risk and may not be suitable for all investors. Leverage can work against you.
Stratos Markets Limited (www.fxcm.com):
CFDs are complex instruments and come with a high risk of losing money rapidly due to leverage. 68% of retail investor accounts lose money when trading CFDs with this provider. You should consider whether you understand how CFDs work and whether you can afford to take the high risk of losing your money.
Stratos Europe Ltd, previously FXCM EU Ltd (www.fxcm.com):
CFDs are complex instruments and come with a high risk of losing money rapidly due to leverage. 73% of retail investor accounts lose money when trading CFDs with this provider. You should consider whether you understand how CFDs work and whether you can afford to take the high risk of losing your money.
Stratos Trading Pty. Limited (www.fxcm.com):
Trading FX/CFDs carries significant risks. FXCM AU (AFSL 309763), please read the Financial Services Guide, Product Disclosure Statement, Target Market Determination and Terms of Business at www.fxcm.com
Stratos Global LLC (www.fxcm.com):
Losses can exceed deposits.
Please be advised that the information presented on TradingView is provided to FXCM (‘Company’, ‘we’) by a third-party provider (‘TFA Global Pte Ltd’). Please be reminded that you are solely responsible for the trading decisions on your account. There is a very high degree of risk involved in trading. Any information and/or content is intended entirely for research, educational and informational purposes only and does not constitute investment or consultation advice or investment strategy. The information is not tailored to the investment needs of any specific person and therefore does not involve a consideration of any of the investment objectives, financial situation or needs of any viewer that may receive it. Kindly also note that past performance is not a reliable indicator of future results. Actual results may differ materially from those anticipated in forward-looking or past performance statements. We assume no liability as to the accuracy or completeness of any of the information and/or content provided herein and the Company cannot be held responsible for any omission, mistake nor for any loss or damage including without limitation to any loss of profit which may arise from reliance on any information supplied by TFA Global Pte Ltd.
The speaker(s) is neither an employee, agent nor representative of FXCM and is therefore acting independently. The opinions given are their own, constitute general market commentary, and do not constitute the opinion or advice of FXCM or any form of personal or investment advice. FXCM neither endorses nor guarantees offerings of third-party speakers, nor is FXCM responsible for the content, veracity or opinions of third-party speakers, presenters or participants.

WTI Oil - 4HWTI oil completed its second bullish leg and has now formed a reversal setup. The price action shows that WTI missed the ascending channel support and is currently consolidating below the previous support zone, which has now turned into a resistance level. This suggests a potential bearish outlook as the price struggles to regain upward momentum.
With the recent break of the ascending channel, it is expected that WTI may continue its downward trajectory. The consolidation under the new resistance zone indicates seller strength, and further declines could be seen if the price fails to break back above this resistance. Traders should watch for key support levels around $81 and $78 for potential buy signals or continuation of the bearish trend.

USOIL BEST PLACE TO SELL FROM|SHORT
Hello, Friends!
USOIL is making a bullish rebound on the 1H TF and is nearing the resistance line above while we are generally bearish biased on the pair due to our previous 1W candle analysis, thus making a trend-following short a good option for us with the target being the 76.54 level.
✅LIKE AND COMMENT MY IDEAS✅

CRUDE OIL (WTI) Bearish Trend Continues
WTI Crude Oil formed a classic bearish reversal pattern
on a daily time frame - a head & shoulders pattern.
Bearish violation of its neckline is an important bearish signal.
I think that the market may reach 77.9 level next week.
❤️Please, support my work with like, thank you!❤️

Crude oil: Waiting for a rebound to continue shortingCrude oil technical analysis
Daily resistance 78.4, support below 72.7
Four-hour resistance 77.5, support below 75.5-74.7
Crude oil operation suggestions: WTI prices stopped falling due to a decline in weekly crude oil inventories last week. The U.S. Energy Information Administration (EIA) crude oil inventory change report is expected to show that inventories will increase by 700,000 barrels in the week ending July 19. Israeli Prime Minister Benjamin Netanyahu will address the U.S. Congress, seeking to turn the U.S. attention to the Middle East.
From the daily chart level, crude oil has repeatedly fluctuated and stepped down in the medium term, and the oil price has fallen below the support of the moving average system. The objective trend of the medium-term rise has changed and returned to the oscillating pattern. Crude oil is expected to maintain a wide range of oscillation in the medium term.
From the current market situation, the lower target continues to focus on breaking new lows, and the short-term long and short strength watershed focuses on the 77.5 line. The rebound above 77-77.5 remains short. Any rebound before the daily level breaks through and stabilizes this position is a short-selling opportunity.
SELL:77.0near SL:77.30
SELL:77.5near SL:77.80
Technical analysis only provides trading direction!

Heading into 38.25 Fibonacci resistance?USOUSD is rising towards the resistance level which is a pullback resistance that aligns with the 38.2% Fibonacci retracement and could reverse from this level to our take profit.
Entry: 80.40
Why we like it:
There is a pullback resistance level which aligns with the 38.2% Fibonacci retracement.
Stop loss: 81.55
Why we like it:
There is a pullback resistance level which lines up with the 61.8% Fibonacci retracement.
Take profit: 77.70
Why we like it:
There is a pullback support level which slightly above the 61.8% Fibonacci retracement.
Please be advised that the information presented on TradingView is provided to Vantage (‘Vantage Global Limited’, ‘we’) by a third-party provider (‘Everest Fortune Group’). Please be reminded that you are solely responsible for the trading decisions on your account. There is a very high degree of risk involved in trading. Any information and/or content is intended entirely for research, educational and informational purposes only and does not constitute investment or consultation advice or investment strategy. The information is not tailored to the investment needs of any specific person and therefore does not involve a consideration of any of the investment objectives, financial situation or needs of any viewer that may receive it. Kindly also note that past performance is not a reliable indicator of future results. Actual results may differ materially from those anticipated in forward-looking or past performance statements. We assume no liability as to the accuracy or completeness of any of the information and/or content provided herein and the Company cannot be held responsible for any omission, mistake nor for any loss or damage including without limitation to any loss of profit which may arise from reliance on any information supplied by Everest Fortune Group.

USOIL What Next? BUY!
My dear followers,
I analysed this chart on USOIL and concluded the following:
The market is trading on 78.58 pivot level.
Bias - Bullish
Technical Indicators: Both Super Trend & Pivot HL indicate a highly probable Bullish continuation.
Target - 79.96
Safe Stop Loss - 77.69
About Used Indicators:
A super-trend indicator is plotted on either above or below the closing price to signal a buy or sell. The indicator changes color, based on whether or not you should be buying. If the super-trend indicator moves below the closing price, the indicator turns green, and it signals an entry point or points to buy.
———————————
WISH YOU ALL LUCK

Bearish reversal for the WTI oil?The price is rising towards the pivot which has been identified as a pullback resistance and could reverse from this level to the pullback support.
Pivot: 80.83
1st Support: 77.50
1st Resistance: 83.49
Risk Warning:
Trading Forex and CFDs carries a high level of risk to your capital and you should only trade with money you can afford to lose. Trading Forex and CFDs may not be suitable for all investors, so please ensure that you fully understand the risks involved and seek independent advice if necessary.
Disclaimer:
The above opinions given constitute general market commentary, and do not constitute the opinion or advice of IC Markets or any form of personal or investment advice.
Any opinions, news, research, analyses, prices, other information, or links to third-party sites contained on this website are provided on an "as-is" basis, are intended only to be informative, is not an advice nor a recommendation, nor research, or a record of our trading prices, or an offer of, or solicitation for a transaction in any financial instrument and thus should not be treated as such. The information provided does not involve any specific investment objectives, financial situation and needs of any specific person who may receive it. Please be aware, that past performance is not a reliable indicator of future performance and/or results. Past Performance or Forward-looking scenarios based upon the reasonable beliefs of the third-party provider are not a guarantee of future performance. Actual results may differ materially from those anticipated in forward-looking or past performance statements. IC Markets makes no representation or warranty and assumes no liability as to the accuracy or completeness of the information provided, nor any loss arising from any investment based on a recommendation, forecast or any information supplied by any third-party.

USOIL BearishUSOIL has been making consecutive lower highs and lower lows i.e. bearish trend as per dow theory. A bearish flag continuation pattern has indicated further price action towards the downside. Fib retracement tool has pinpointed the entry point taken through sell limit order.

USOIL ( BREAKOUT DEMAND ZONE ) (4H)USOIL
HELLO TRADERS
Tendency , the price is under bearish pressure , after breakout demand zone .
TURNING LEVEL : the price of turning level around 76.96 , until the price trading below this level reach a support level (1) , but if the price breaking this level reach resistance level (1) .
RESISTANCE LEVEL (1) : this level around 80.49 , for reach this resistance the price it will be breaking turning level .
RESISTANCE LEVEL (2) : around 82.83 , for reach this level it will be breaking by open 4h or 1h candle above resistance level (1)
SUPPORT LEVEL (1) : as long the price trading below turning level reach this level around 75.05.
SUPPORT LEVEL (2) : this level around 72.46, for reach this level the price will be breaking by open 1h or 4h candle below support level (1) .
CORRECTIVE : the price may be corrective turning level at 76.96 , before drooping .
TARGET LEVEL :
RESISTANCE LEVEL : 80.49 , 82.83 .
SUPPORT LEVEL : 75.05 ,72.46 .


Bearish drop?WTI oil (XTI/USD) is rising towards the pivot which acts as a pullback resistance and could reverse to the pullback support level.
Pivot: 79.45
1st Support: 77.50
1st Resistance: 80.73
Risk Warning:
Trading Forex and CFDs carries a high level of risk to your capital and you should only trade with money you can afford to lose. Trading Forex and CFDs may not be suitable for all investors, so please ensure that you fully understand the risks involved and seek independent advice if necessary.
Disclaimer:
The above opinions given constitute general market commentary, and do not constitute the opinion or advice of IC Markets or any form of personal or investment advice.
Any opinions, news, research, analyses, prices, other information, or links to third-party sites contained on this website are provided on an "as-is" basis, are intended only to be informative, is not an advice nor a recommendation, nor research, or a record of our trading prices, or an offer of, or solicitation for a transaction in any financial instrument and thus should not be treated as such. The information provided does not involve any specific investment objectives, financial situation and needs of any specific person who may receive it. Please be aware, that past performance is not a reliable indicator of future performance and/or results. Past Performance or Forward-looking scenarios based upon the reasonable beliefs of the third-party provider are not a guarantee of future performance. Actual results may differ materially from those anticipated in forward-looking or past performance statements. IC Markets makes no representation or warranty and assumes no liability as to the accuracy or completeness of the information provided, nor any loss arising from any investment based on a recommendation, forecast or any information supplied by any third-party.
