Crude oil opens a path to $60Crude oil is in play after testing the $65 technical resistnace, and reverting back to the downtrend.
Having shown a large distribution day, crude oil might reverse back to the downtrend with reaching a fair price of $60, which is a fair price pointed by eia.gov for Q4, 2025.
Yesterday's proposal of the US president Donald Trump about deescalation in Gaza was approved by Israeli prime minister Netanyahu. That is a move towards decreasing geopolitical tensions in the Middle East, though the situation may be far from the resolution.
Anyways, Crude oil futures have reacted with the decline, confirming weak sentiment and overall bearish context.
One may consider a trend-following trade with a potential target of $60.
Don't forget - this is just the idea, always do your own research and never forget to manage your risk!
Trade ideas

Potential bearish drop?WTI Oil (XTI/USD) is rising towards the pivot and could reverse to the 1st support.
Pivot: 64.72
1st Support: 62.67
1st Resistance: 66.82
Disclaimer:
The above opinions given constitute general market commentary, and do not constitute the opinion or advice of IC Markets or any form of personal or investment advice.
Any opinions, news, research, analyses, prices, other information, or links to third-party sites contained on this website are provided on an "as-is" basis, are intended only to be informative, is not an advice nor a recommendation, nor research, or a record of our trading prices, or an offer of, or solicitation for a transaction in any financial instrument and thus should not be treated as such. The information provided does not involve any specific investment objectives, financial situation and needs of any specific person who may receive it. Please be aware, that past performance is not a reliable indicator of future performance and/or results. Past Performance or Forward-looking scenarios based upon the reasonable beliefs of the third-party provider are not a guarantee of future performance. Actual results may differ materially from those anticipated in forward-looking or past performance statements. IC Markets makes no representation or warranty and assumes no liability as to the accuracy or completeness of the information provided, nor any loss arising from any investment based on a recommendation, forecast or any information supplied by any third-party.

Crude oil - down trend continuesAs previously posted, Crude oil down trend continues in 4hrs time frame. It can be fall upto the green line marked support.

WTI Crude Oil🔹 I’ve marked the key resistance zones.
🔹 If I see a reversal signal at any of these levels, I’ll go short.
🔹 The breakout scenario is always valid too—if a level breaks, I’ll take the trade in the direction of the market.
🚫 No bias towards numbers, levels, or analysis.
✨ The key is to flow with the market, not fight it. If you try to stand against it, the market won’t just take your money—it will crush your confidence too.
🎯 We’re only a small part of a bigger picture. Stay flexible, stay unbiased.

WTI Wave Analysis – 29 September 2025- WTI reversed from resistance level 65.25
- Likely to fall to support level 61.70
WTI crude oil recently reversed down from the the resistance area between the resistance level 65.25 (upper border of the active sideways price range from the start of August).
The resistance level 65.25 was strengthened by the upper daily Bollinger Band and by the 50% Fibonacci correction of the downward impulse from the end of July.
WTI crude oil can be expected to fall to the next support level 61.70 (lower border of the active sideways price range).

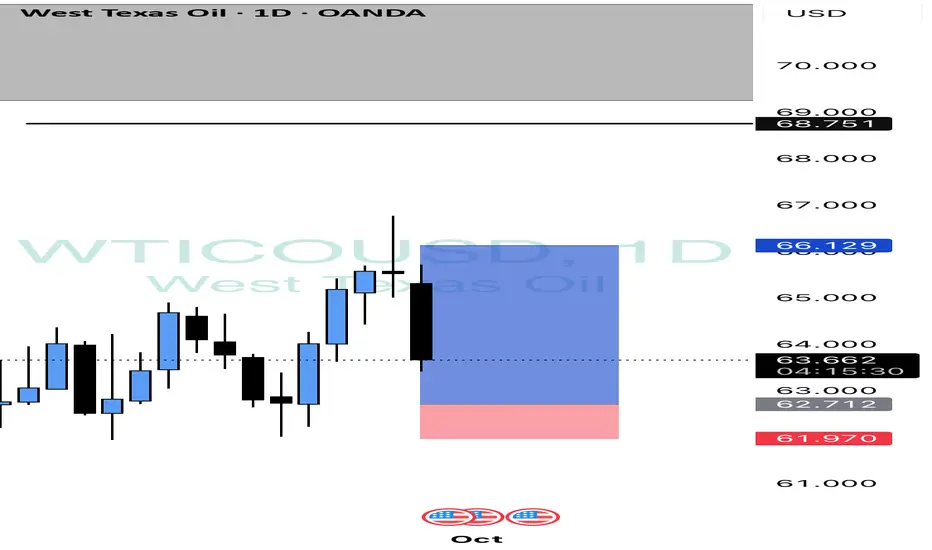
Usoil Daily 🛢️ The oil chart hit the target we had set in our previous buy setup. We still maintain a bullish outlook in this zone, and if the price drops further, it could trigger our next trade.

Usoil Daily
🛢️ The oil chart hit the target we had set in our previous buy setup. We still maintain a bullish outlook in this zone, and if the price drops further, it could trigger our next trade.
#CrudeOil #OilTrading #WTI #TechnicalAnalysis #BuySetup #TradingView #Forex #Commodities #PriceAction
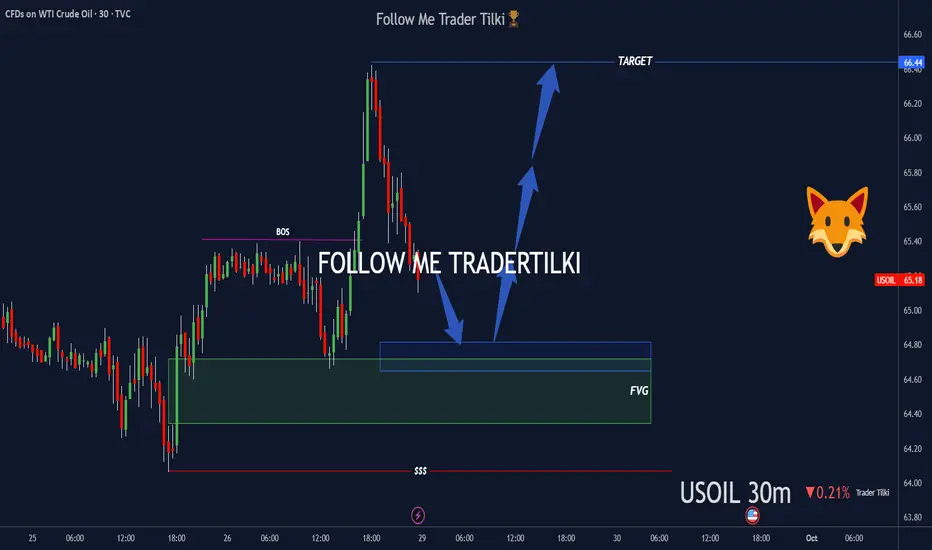
30-minute USOIL Key Buy Zones AnalysisHello Guys,
I’ve prepared a USOIL analysis for you.
I’m watching two buy zones on USOIL:
🔹 First buy zone: 64.70
🔹 Second buy zone: 64.35 or 64,00
From these levels, I’ll definitely open buy positions and take my shot.
🎯 Target level: 66.40
Every like is my biggest motivation to keep sharing these analyses.
Thanks to everyone supporting me!
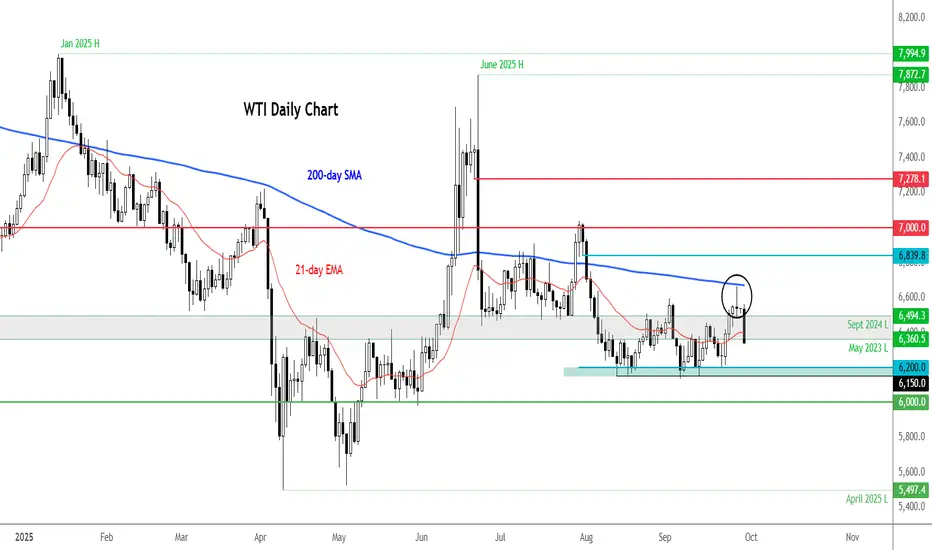
WTI extends drop after 200 MA testAfter printing an inverted hammer off its 200-day average on Friday, we have seen a sharp slide in oil prices today.
Reports that the OPEC+ plans another increase to output in November is not helping the cause, with the market already fearful over excessive supply and weak demand growth.
Key support at 61.50 to 62.00 area was tested multiple times last week and it held. A break below that zone this week could be pivotal, if seen.
Resistance seen at 65.00 now, then the area between 66.50-67.00 - marking the 200 day MA.
By Fawad Razaqzada, market analyst with FOREX.com
Overbought NO where in Sight I keep seeing people stating that Crude is overbought but on the 1day time frame it is just beginning.
If it were me I would be mindful of placing short orders for oil at this time and continue to look for long opportunities during the NY sessions.
Thats just me though 🤷🏽♀️
Supply and demand dynamics are dominating the oil marketSupply and demand dynamics are dominating the oil market
Technical Analysis
USOIL is consolidating within a horizontal channel between 61.50 and 66.00. The multi-period EMA is converging, indicating an accumulation phase before a breakout, in which the direction could determine the next trend.
Since the preceding trend was a downtrend and the price remains within a broader descending channel, the bias is more to the downside. Therefore, any rebound near the channel's upper bound is seen as a potential opportunity.
If USOIL fails to break above the horizontal channel's upper bound at 66.00, the price may reverse downwards to retest the lower bound around 61.50, with the potential to break lower towards the year's low of 55.00.
However, if USOIL breaks above the upper bound of the sideways range, it could test the upper bound of the broader descending channel around 70.50.
Fundamental Analysis
WTI crude oil prices are influenced by a mix of rising supply and price-supporting geopolitical events.
The resumption of crude exports from Iraqi Kurdistan, after a 2.5-year halt, is adding to the global supply, starting at 180,000–190,000 barrels per day (bpd) and expected to rise to around 230,000 bpd. Meanwhile, OPEC+ is considering a production increase of at least 137,000 bpd, reinforcing concerns about a year-end supply surplus.
However, news of attacks on energy infrastructure in Eastern Europe and measures to restrict fuel exports spark a short-term bullish momentum and increasing volatility.
Despite this, the factors truly dominating oil prices are weak demand and excess supply. Geopolitics remains an event risk with short-term, one-time effects. Therefore, prices continue to face headwinds overall.
Additionally, prices may fluctuate based on upcoming weekly inventory reports and dynamic production news that could exert further pressure.
Analysis by: Krisada Yoonaisil, Financial Markets Strategist at Exness

OIL Technical & Order Flow AnalysisOur analysis is based on a multi-timeframe top-down approach and fundamental analysis.
Based on our assessment, the price is expected to return to the monthly level.
DISCLAIMER: This analysis may change at any time without notice and is solely intended to assist traders in making independent investment decisions. Please note that this is a prediction, and I have no obligation to act on it, nor should you.
Please support our analysis with a boost or comment!

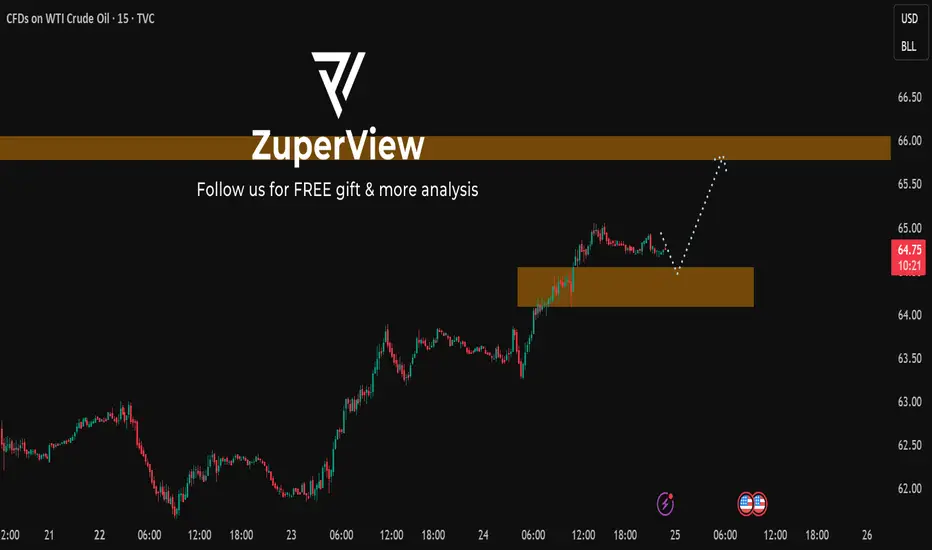
USOIL: Breaks $64.75 — Is a retest of $66 and higher level?This is my previous analysis — feel free to take a look for reference.
* Trend: assessed using at least three trend indicators, with market structure as the primary guide.
** Weak or Reversal Signals: Assessed based on one of our criteria for trend reversal signals.
*** Support/Resistance: Selected from multiple factors – static (Swing High, Swing Low, etc.), dynamic (EMA, MA, etc.), psychological (Fibonacci, RSI, etc.) – and determined based on the trader’s discretion.
**** Our advice takes into account all factors, including both fundamental and technical analysis. It is not intended as a profit target. We hope it can serve as a reference to help you trade more effectively. This advice is for informational purposes only and we assume no responsibility for any trading results based on it.
Please like and comment below to support our traders. Your reactions will motivate us to do more analysis in the future 🙏✨
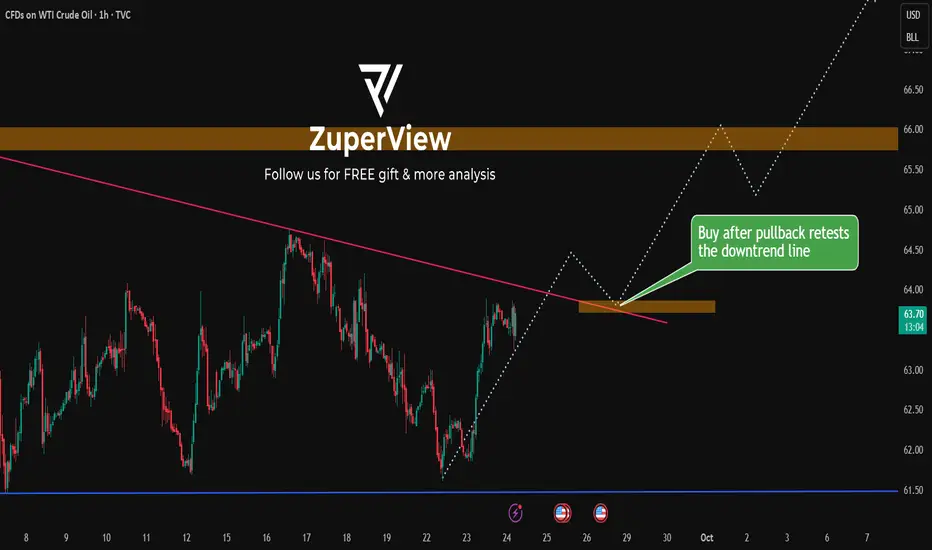
USOIL: Range-bound setup with upside test before downside risk
* Trend: assessed using at least three trend indicators, with market structure as the primary guide.
** Weak or Reversal Signals: Assessed based on one of our criteria for trend reversal signals.
*** Support/Resistance: Selected from multiple factors – static (Swing High, Swing Low, etc.), dynamic (EMA, MA, etc.), psychological (Fibonacci, RSI, etc.) – and determined based on the trader’s discretion.
**** Our advice takes into account all factors, including both fundamental and technical analysis. It is not intended as a profit target. We hope it can serve as a reference to help you trade more effectively. This advice is for informational purposes only and we assume no responsibility for any trading results based on it.
Please like and comment below to support our traders. Your reactions will motivate us to do more analysis in the future 🙏✨
US OilCrude Oil
- Break of Structure
- Completed " 12345 " Impulsive Waves
- Fair Value Gap
- Exp FIAT as an corrective pattern in Short Time Frame
- Order Block


USOIL Trading Opportunity! SELL!
My dear friends,
My technical analysis for USOIL is below:
The market is trading on 65.18 pivot level.
Bias - Bearish
Technical Indicators: Both Super Trend & Pivot HL indicate a highly probable Bearish continuation.
Target - 64.22
About Used Indicators:
A pivot point is a technical analysis indicator, or calculations, used to determine the overall trend of the market over different time frames.
Disclosure: I am part of Trade Nation's Influencer program and receive a monthly fee for using their TradingView charts in my analysis.
———————————
WISH YOU ALL LUCK

Crude oil review -DAILY- 29/09/2025Oil prices slipped at the start of the week as expectations of another OPEC+ production hike in November added to oversupply worries. West Texas Intermediate hovered near $65, with the alliance led by Saudi Arabia considering raising output beyond the already scheduled October increase of 137,000 barrels a day. Most members, aside from Saudi Arabia, are already at their production ceilings, meaning actual supply growth will likely fall short of official targets. Still, China’s strong crude purchases have helped prices remain relatively supported. The International Energy Agency warned of a record surplus in 2026 as OPEC+ revives more supply while rival producers expand output. Goldman Sachs projects crude could slide into the mid-$50s next year despite ongoing Chinese stockpiling.
On the technical side, crude oil prices have been trading in a sideways channel formation with upper and lower boundaries around $66 and $62, respectively. Currently, the price is testing the resistance of the 100-day moving average, just below the upper boundary of the channel. The Stochastic oscillator is near extreme overbought levels, while the moving averages validate an overall bearish trend.
Disclaimer: The opinions in this article are personal to the writer and do not reflect those of Exness

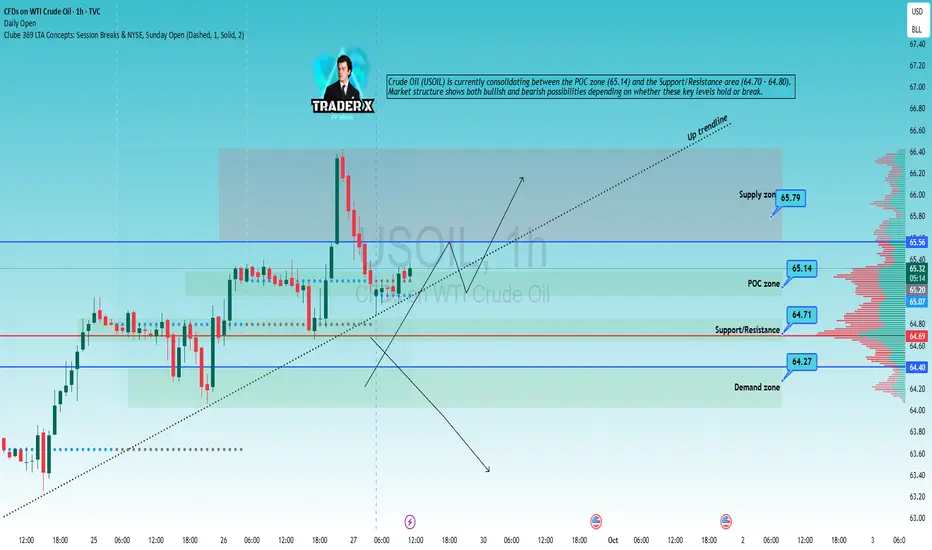
USOIL H1 – Trading Plan I SEP/29/2025Crude Oil (USOIL) is currently consolidating between the POC zone (65.14) and the Support/Resistance area (64.70 – 64.80). Market structure shows both bullish and bearish possibilities depending on whether these key levels hold or break
Here are 4 possible scenarios with entry signals to watch:
📊 Scenario 1 – Rebound from Support/Resistance
Watch zone: 64.70 – 64.80 (Support/Resistance).
Price action: Bullish reversal candlestick (Pin bar, Bullish engulfing) with volume confirmation.
Trading signal:
👉 Buy around 64.70 – 64.80
🎯 TP1: 65.14 (POC zone)
🎯 TP2: 65.56 – 65.79 (Supply zone)
⛔ SL: below 64.40 (Demand zone).
📊 Scenario 2 – Breakout above Supply Zone
Watch zone: 65.56 – 65.79 (Supply zone).
Price action: H1 candle closes above 65.80 with strong volume.
Trading signal:
👉 Buy breakout above 65.80
🎯 TP1: 66.20
🎯 TP2: 66.80
⛔ SL: below 65.40.
📊 Scenario 3 – Breakdown of Support/Resistance
Watch zone: 64.70 – 64.80.
Price action: H1 candle closes below 64.70 with strong bearish momentum.
Trading signal:
👉 Sell on pullback to 64.70
🎯 TP1: 64.40 (Demand zone)
🎯 TP2: 63.80
⛔ SL: above 65.10.
📊 Scenario 4 – Breakdown of Demand Zone
Watch zone: 64.20 – 64.40 (Demand zone).
Price action: H1 candle closes below 64.20 with increasing volume.
Trading signal:
👉 Sell breakout below 64.20
🎯 TP1: 63.60
🎯 TP2: 63.00
⛔ SL: above 64.60.
👉 Summary:
Holding above 64.70 favors Buy setups.
Breaking below 64.70 favors Sell setups.
Key short-term battle zone: 65.56 – 65.79 Supply area.
⚠️ Disclaimer:
This analysis is for educational and informational purposes only and should not be considered financial advice. Trading in financial markets involves significant risk, and you should only trade with capital you can afford to lose. Always do your own research before making any trading decisions.
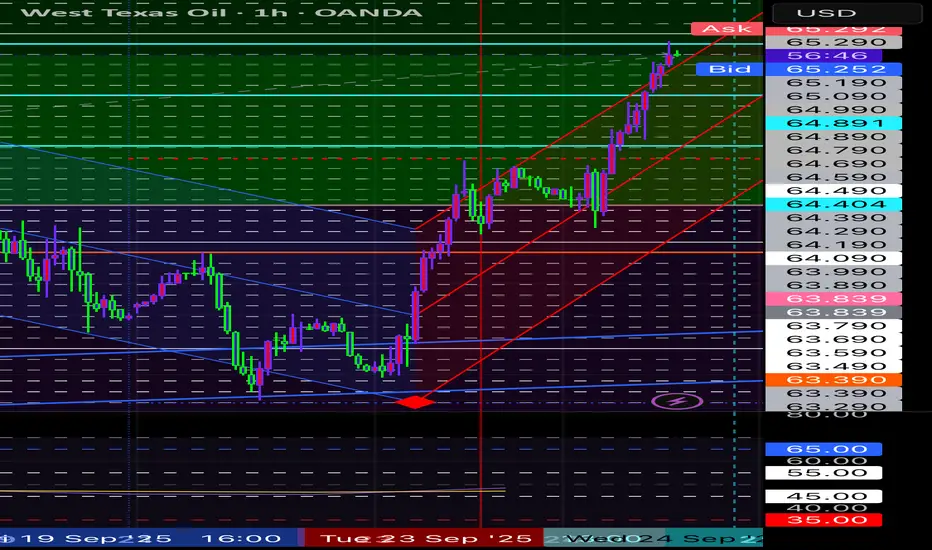
Crude Oil (WTI) Technical OutlookCrude Oil (WTI) has recently tested a critical resistance zone around $65, showing strong upside momentum after weeks of consolidation. The chart structure suggests a potential bullish breakout, with price action forming higher lows and pressing against a key supply level.
If WTI holds above $65, the next upside targets lie at:
$67.80 – intermediate resistance
$68.98 – major technical level aligned with previous supply
$70.50 – $71.00 – key psychological resistance and prior swing high
A short-term retest of $65 may act as confirmation before continuation toward the $70+ region. Failure to hold above $64.50 could invalidate the bullish scenario and open a move back toward $62.
This analysis highlights institutional order flow dynamics and key liquidity levels, indicating that crude oil may be setting up for a significant directional move. Traders should watch for clean breaks and retests at major support/resistance zones before positioning.
📌 Summary:
Bias: Bullish above $65
Targets: $67.80 → $68.98 → $70.50+
Risk: Breakdown below $64.50

USOIL: Bears Will Push
The analysis of the USOIL chart clearly shows us that the pair is finally about to tank due to the rising pressure from the sellers.
Disclosure: I am part of Trade Nation's Influencer program and receive a monthly fee for using their TradingView charts in my analysis.
❤️ Please, support our work with like & comment! ❤️

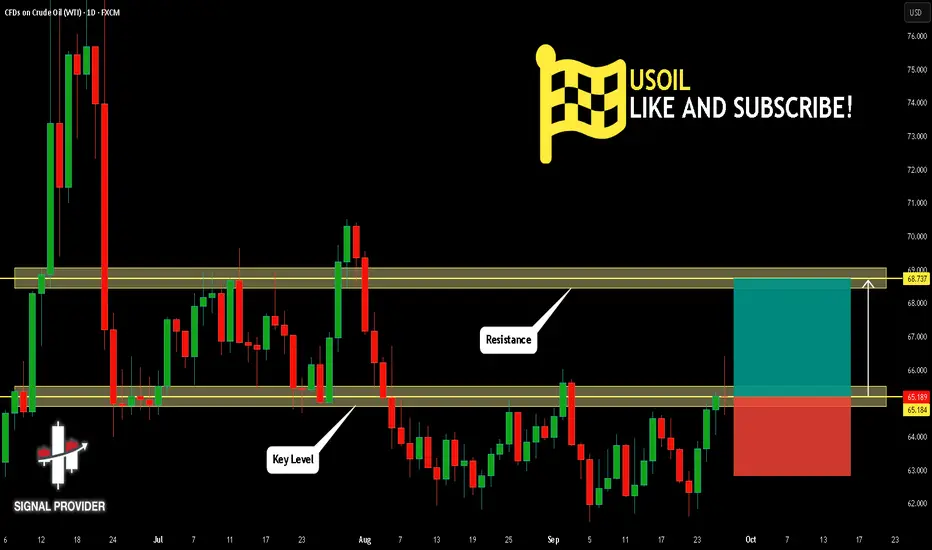
USOIL Is Bullish! Long!
Please, check our technical outlook for USOIL.
Time Frame: 1D
Current Trend: Bullish
Sentiment: Oversold (based on 7-period RSI)
Forecast: Bullish
The market is approaching a significant support area 65.184.
The underlined horizontal cluster clearly indicates a highly probable bullish movement with target 68.737 level.
P.S
Please, note that an oversold/overbought condition can last for a long time, and therefore being oversold/overbought doesn't mean a price rally will come soon, or at all.
Like and subscribe and comment my ideas if you enjoy them!
Upward trend in oilCurrently, the oil trend is bullish and we can expect a price rebound in one of the specified demand ranges.
