USOIL WILL GO DOWN|SHORT|
✅WTI OIL Price rejects supply after distribution and forms bearish orderflow, ICT suggests liquidity is being targeted below. Market likely seeks drawdown into 60.00 demand imbalance. Time Frame 4H.
SHORT🔥
✅Like and subscribe to never miss a new idea!✅
Trade ideas

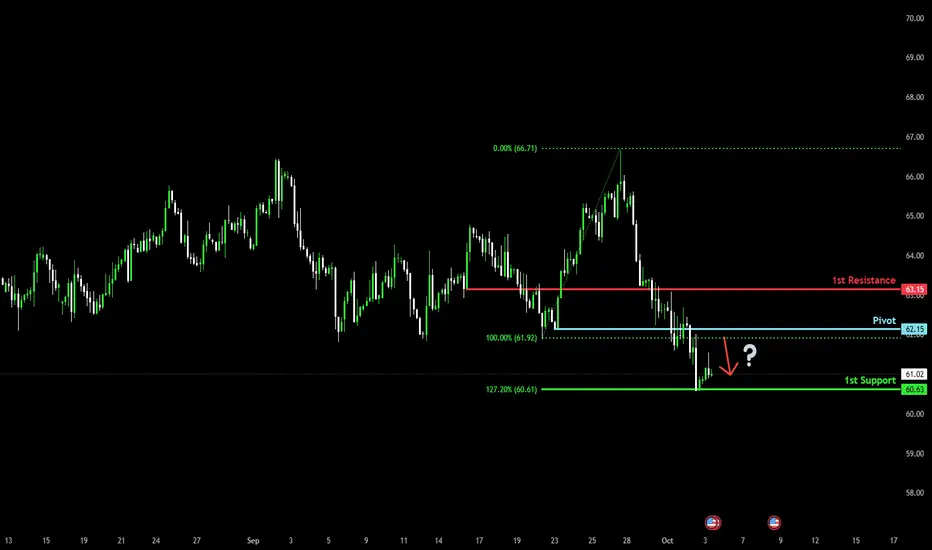
Bearish continuation?WTI Oil (XTI/USD) is rising towards the pivot, which is a pullback resistance, and could drop to the 1st support.
Pivot: 62.15
1st Support: 60.63
1st Resistance: 63.15
Disclaimer:
The above opinions given constitute general market commentary, and do not constitute the opinion or advice of IC Markets or any form of personal or investment advice.
Any opinions, news, research, analyses, prices, other information, or links to third-party sites contained on this website are provided on an "as-is" basis, are intended only to be informative, is not an advice nor a recommendation, nor research, or a record of our trading prices, or an offer of, or solicitation for a transaction in any financial instrument and thus should not be treated as such. The information provided does not involve any specific investment objectives, financial situation and needs of any specific person who may receive it. Please be aware, that past performance is not a reliable indicator of future performance and/or results. Past Performance or Forward-looking scenarios based upon the reasonable beliefs of the third-party provider are not a guarantee of future performance. Actual results may differ materially from those anticipated in forward-looking or past performance statements. IC Markets makes no representation or warranty and assumes no liability as to the accuracy or completeness of the information provided, nor any loss arising from any investment based on a recommendation, forecast or any information supplied by any third-party.
USOIL Will Go Down! Sell!
Here is our detailed technical review for USOIL.
Time Frame: 9h
Current Trend: Bearish
Sentiment: Overbought (based on 7-period RSI)
Forecast: Bearish
The market is testing a major horizontal structure 60.770.
Taking into consideration the structure & trend analysis, I believe that the market will reach 57.241 level soon.
P.S
Please, note that an oversold/overbought condition can last for a long time, and therefore being oversold/overbought doesn't mean a price rally will come soon, or at all.
Like and subscribe and comment my ideas if you enjoy them!

USOIL: Waiting for breakout after sidewaysTo better understand my current outlook on USOIL, please refer to my previous higher-timeframe and fundamental analyses.
* Trend: assessed using at least three trend indicators, with market structure as the primary guide.
** Weak or Reversal Signals: Assessed based on one of our criteria for trend reversal signals.
*** Support/Resistance: Selected from multiple factors – static (Swing High, Swing Low, etc.), dynamic (EMA, MA, etc.), psychological (Fibonacci, RSI, etc.) – and determined based on the trader’s discretion.
**** Our advice takes into account all factors, including both fundamental and technical analysis. It is not intended as a profit target. We hope it can serve as a reference to help you trade more effectively. This advice is for informational purposes only and we assume no responsibility for any trading results based on it.
Please like and comment below to support our traders. Your reactions will motivate us to do more analysis in the future 🙏✨
USOIL: Waiting for a reaction at strong supportTo better understand my current outlook on USOIL, please refer to my previous higher-timeframe and fundamental analyses.
* Trend: assessed using at least three trend indicators, with market structure as the primary guide.
** Weak or Reversal Signals: Assessed based on one of our criteria for trend reversal signals.
*** Support/Resistance: Selected from multiple factors – static (Swing High, Swing Low, etc.), dynamic (EMA, MA, etc.), psychological (Fibonacci, RSI, etc.) – and determined based on the trader’s discretion.
**** Our advice takes into account all factors, including both fundamental and technical analysis. It is not intended as a profit target. We hope it can serve as a reference to help you trade more effectively. This advice is for informational purposes only and we assume no responsibility for any trading results based on it.
Please like and comment below to support our traders. Your reactions will motivate us to do more analysis in the future 🙏✨
George Vann @ ZuperView
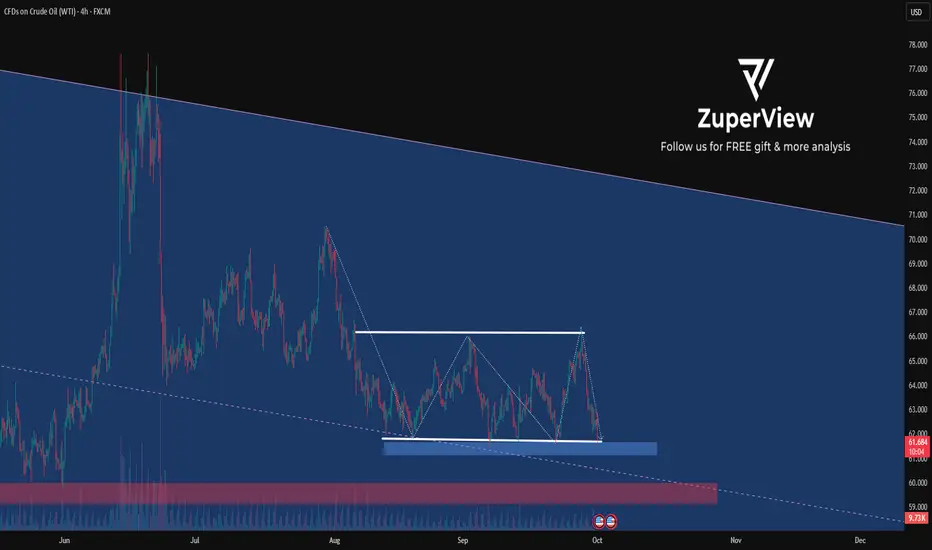
US CRUDE OIL (WTI): Strong Bearish Signal?!The price of 📉USOIL appears to be showing bearish tendencies following a consolidation period of two months.
A bearish breakout below the support level of a sideways range often serves as a dependable confirmation signal.
Consequently, a downward movement towards the support level of 59.00 is anticipated.

Hellena | Oil (4H): SHORT to support area of 60 (Wave 3).The price is still not reaching the target of 60. I decided to make a new forecast, slightly changing the labeling of waves, or rather their importance.
At this stage, as before, I think that the price will reach the area of the level 60 in the middle wave “3”.
This movement is the development of the big corrective wave “C”. In general, the plan remains the same.
Manage your capital correctly and competently! Only enter trades based on reliable patterns!


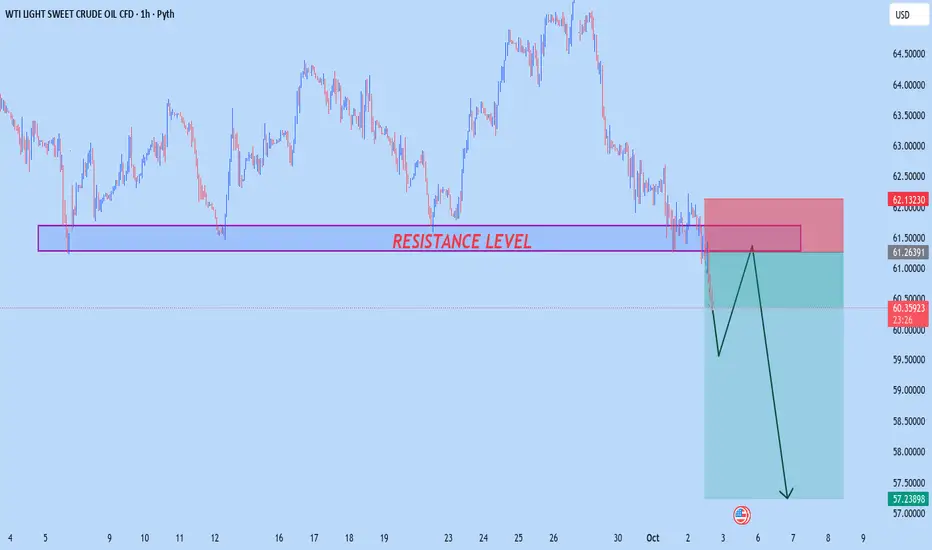
USOIL NEW OUTLOOK According to H1 analysis USOIL market break the support level and make it RESISTANCE LEVEL now market Running in selling pressure so it will be go more in sell so wait for opportunity we have chance to go sell from RESISTANCE
TRADE AT YOUR OWN RISK
REGARD ALBERT
Crude Oil – Bearish Below 61.83 as OPEC+ Meeting NearsCrude Oil – Overview
Crude prices remain under pressure as geopolitical and supply factors clash with weak demand signals.
The Trump administration will provide Ukraine with intelligence for long-range missile strikes inside Russia, raising geopolitical risk.
Markets await Sunday’s OPEC+ meeting, where another November output hike is expected despite supply glut concerns.
The latest EIA data showed crude inventories rising for the first time in three weeks, while gasoline stocks posted the biggest jump since June—signalling weaker demand.
Technical Outlook
Oil maintains a bearish bias as long as price trades below 61.83, with downside targets at 60.20 → 58.70.
A confirmed 4H close above 61.83 would flip momentum bullish, targeting 63.47 → 64.75.
Pivot: 61.83
Support: 60.20 – 58.70
Resistance: 63.47 – 64.75

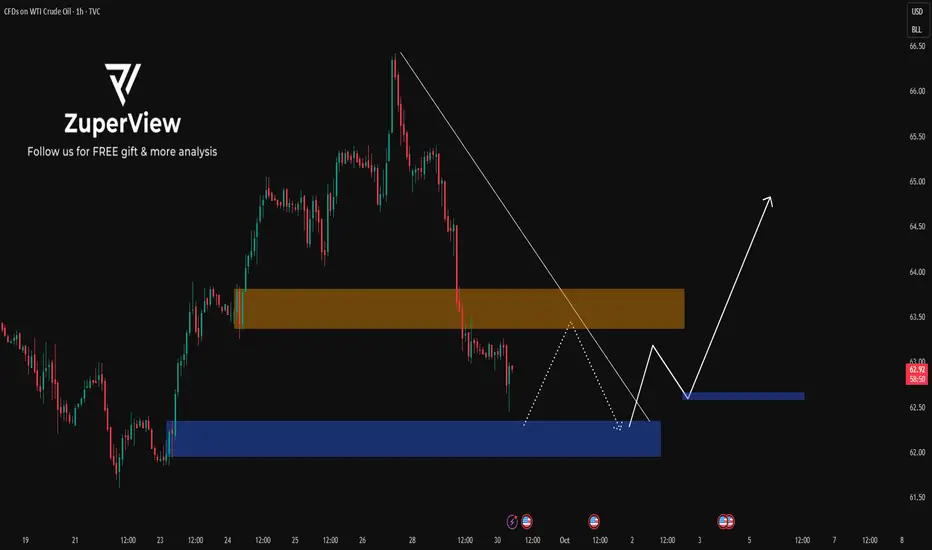
Oil prices extend losses on supply concernsOil prices extend losses on supply concerns
Oil prices slipped Thursday, extending last week’s decline on oversupply worries and uncertainty from the U.S. government shutdown. Expectations that OPEC+ may raise output by up to 500,000 bpd in November, along with forecasts of a potential glut, weighed on sentiment.
Geopolitical risks remain in focus, with the G7 vowing tighter controls on Russian oil and the U.S. set to aid Ukraine with intelligence for strikes on energy infrastructure. Still, Chinese stockpiling helped limit losses. Concerns over Russian supply disruptions and steady Chinese stockpiling provided some support, but U.S. data showing rising crude and fuel inventories added to bearish pressure.

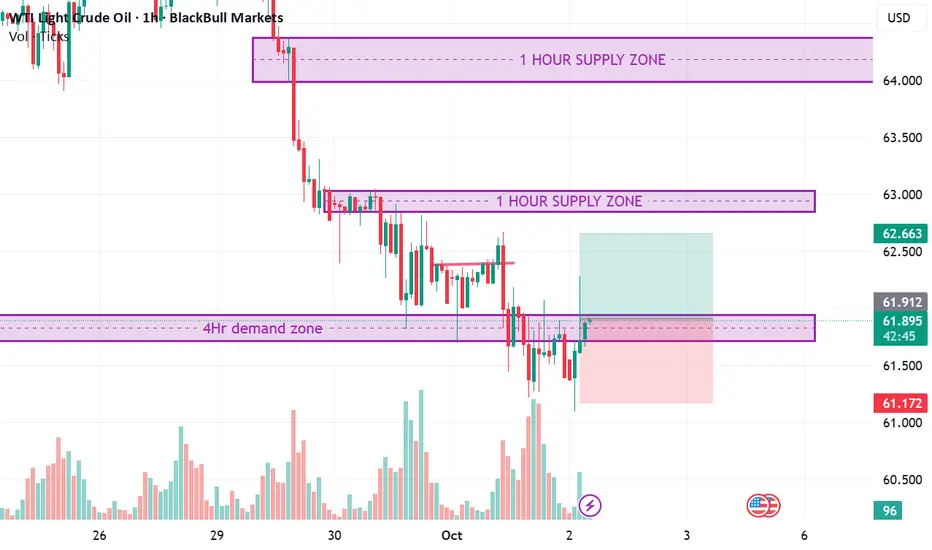
WTI RR 1:1 scalp. W bottomWTI RR 1:1 scalp. W bottom
Formation of a W bottom near an H4 demand zone area.
USOIL STRONG DEMAND AREA|LONG|
✅WTI OIL price reacts at demand level, showing signs of absorption with liquidity grabs. ICT model points to bullish orderflow aiming for the nearby target zone. Time Frame: 4H.
LONG🚀
✅Like and subscribe to never miss a new idea!✅

CRUDE OIL Free Signal! Buy!
Hello,Traders!
CRUDE OIL taps into a horizontal demand area, showing strong bullish reaction. Liquidity beneath recent lows is swept, signalling smart money positioning for upside continuation.
-------------------
Stop Loss: 61.35$
Take Profit: 62.87$
Entry: 61.94$
Time Frame: 8H
-------------------
Buy!
Comment and subscribe to help us grow!
Check out other forecasts below too!
Disclosure: I am part of Trade Nation's Influencer program and receive a monthly fee for using their TradingView charts in my analysis.

XTIUSD Weekly CLS range Manipulation - ShortXTIUSD shows clear manipulation candle on daily time frame closing within a CLS candle. Can short on pullback . Price likely will go down .

WTI Crude key support retest at 6200The WTI Crude Oil is currently trading with a bearish bias, aligned with the broader downward trend. Recent price action shows a retest of the resistance, suggesting a further selling pressure within the downtrend.
Key resistance is located at 6540, a prior consolidation zone. This level will be critical in determining the next directional move.
A bearish rejection from 6540 could confirm the resumption of the downtrend, targeting the next support levels at 6200, followed by 6070 and 6000 over a longer timeframe.
Conversely, a decisive breakout and daily close above 6540 would invalidate the current bearish setup, shifting sentiment to bullish and potentially triggering a move towards 6650, then 6830.
Conclusion:
The short-term outlook remains bearish unless WTI Crude breaks and holds above 6540. Traders should watch for price action signals around this key level to confirm direction. A rejection favours fresh downside continuation, while a breakout signals a potential trend reversal or deeper correction.
This communication is for informational purposes only and should not be viewed as any form of recommendation as to a particular course of action or as investment advice. It is not intended as an offer or solicitation for the purchase or sale of any financial instrument or as an official confirmation of any transaction. Opinions, estimates and assumptions expressed herein are made as of the date of this communication and are subject to change without notice. This communication has been prepared based upon information, including market prices, data and other information, believed to be reliable; however, Trade Nation does not warrant its completeness or accuracy. All market prices and market data contained in or attached to this communication are indicative and subject to change without notice.

XTIUSD Pull back trade LONGRecently XTIUSD has fallen heavily and now price is consoldiating and pullback is possible to 63.5 before furhter decline, let us see how it plays out. Use strict SL as recnt swing Low.

OILOil is in good buying conditions today. According to the chart, it could rise with one of the two scenarios mentioned.

USOIL continues to decline on oversupply concerns
Oil prices tumbled on oversupply fears as major producers ramped up output. Reuters reported that ahead of the OPEC+ meeting on October 5th, November production hikes could exceed the planned 137,000 barrels per day. The resumption of Kurdish oil exports and prospects of additional supply may further pressure prices.
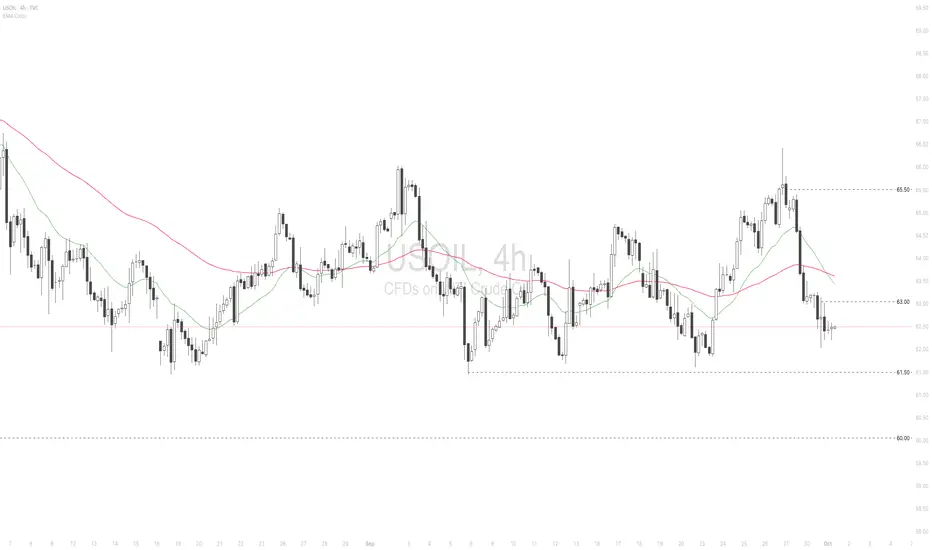
USOIL extended its decline before consolidating within the 61.50–63.00 range. The death cross of the EMAs points to a potential shift toward bearish momentum. If USOIL breaks below the 61.50 support, the price could retreat toward 60.00. Conversely, if USOIL breaks above the 63.00 resistance, the price may advance toward 65.50.
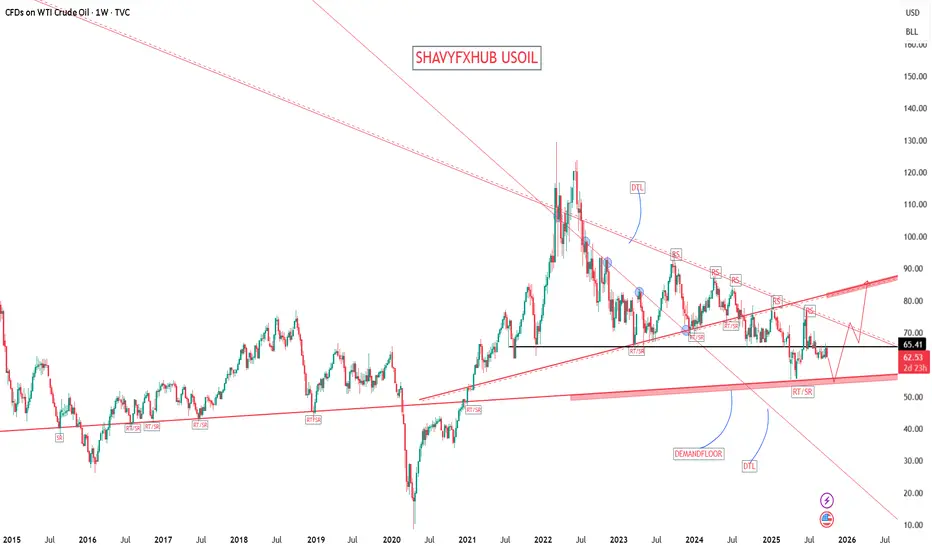
USOIL USOIL could still deep before the price rally, if we retest the floor at 54.58-55.52 then oil could swing into the descending trendline and a breakout will be communicated .
#usoil #oil
Renewed buy trigger on oilOil has been moving in this range for nearly 60 days and has now reached the bottom of the range. Based on the range strategy, the chart’s history, and the Middle East situation, it’s worth considering a long position here — it looks like a good setup. ✅

CRUDE OIL Will Grow! Buy!
Hello,Traders!
CRUDE OIL after sweeping liquidity from the horizontal demand area, price shows signs of rebalancing inefficiency. From an SMC perspective, buyers may drive the market toward the marked target zone. Time Frame 5H.
Buy!
Comment and subscribe to help us grow!
Check out other forecasts below too!
Disclosure: I am part of Trade Nation's Influencer program and receive a monthly fee for using their TradingView charts in my analysis.

WTI OIL Channel Up bottom buy signalWTI Crude Oil (USOIL) has almost touched the bottom (Higher Lows trend-line) of its September Channel Up, following a strong rejection (Bearish Led) just below the 1D MA200 (orange trend-line).
With the 4H RSI entering its medium-term Buy Zone, we have a strong short-term buy signal at our hands. Our Target is $66.50, expecting a 1D MA200 test, below the 1.1 Fibonacci extension, below which the previous Higher High was priced.
-------------------------------------------------------------------------------
** Please LIKE 👍, FOLLOW ✅, SHARE 🙌 and COMMENT ✍ if you enjoy this idea! Also share your ideas and charts in the comments section below! This is best way to keep it relevant, support us, keep the content here free and allow the idea to reach as many people as possible. **
-------------------------------------------------------------------------------
💸💸💸💸💸💸
👇 👇 👇 👇 👇 👇
