USOIL LOCAL LONG|
✅WTI OIL is expected to bounce from the demand level near $60.00, targeting the $60.70 resistance zone as bullish momentum builds. Time Frame 3H.
LONG🚀
✅Like and subscribe to never miss a new idea!✅
Trade ideas

Crude Oil Trading Strategy for TodayThe resonance of the three core driving forces opens up the space for a rebound.
The global economy is experiencing a weak recovery, with demand resilience exceeding pessimistic expectations: Despite the IEA's downward revision of demand growth for 2025-2026, the global economy has not fallen into recession. In the third quarter, crude oil demand has grown by an average of 750,000 barrels per day, with the rebound in demand for petrochemical feedstocks being a key support, breaking the market consensus of "persistent weak demand".
The cost structure of US shale oil is moving upward: Data from the analysis firm Enverus shows that due to the depletion of high-quality resources and the complexity of the extraction areas, the marginal cost of US shale oil is gradually rising from about $70 per barrel. Most small and medium-sized producers need an oil price of over $65 to make a profit on new well projects, while only large-scale enterprises can maintain a break-even point in the $50-60 range. The current oil price is approaching the cost line, and further declines will curb supply growth, forming a natural bottom support.
Net long positions have risen significantly: The latest CFTC position data shows that Brent crude oil long positions increased by 57,000 contracts, short positions decreased by 62,000 contracts, and net long positions rose by 119,000 contracts compared to the previous period. Market sentiment has shifted from extreme pessimism to a bottoming out and rebound, with continued inflows of new buying supporting oil prices.
Crude Oil Trading Strategy for Today
buy:59.5-60
tp:60.5-61
sl:61.5

US OILHI GUYS,
US OIL , we are still selling on weekly chart to area of interest as we expect RT DAILY SOON.

WTI Crude Oil Forms Major Head and Shoulders BreakdownHi guys.
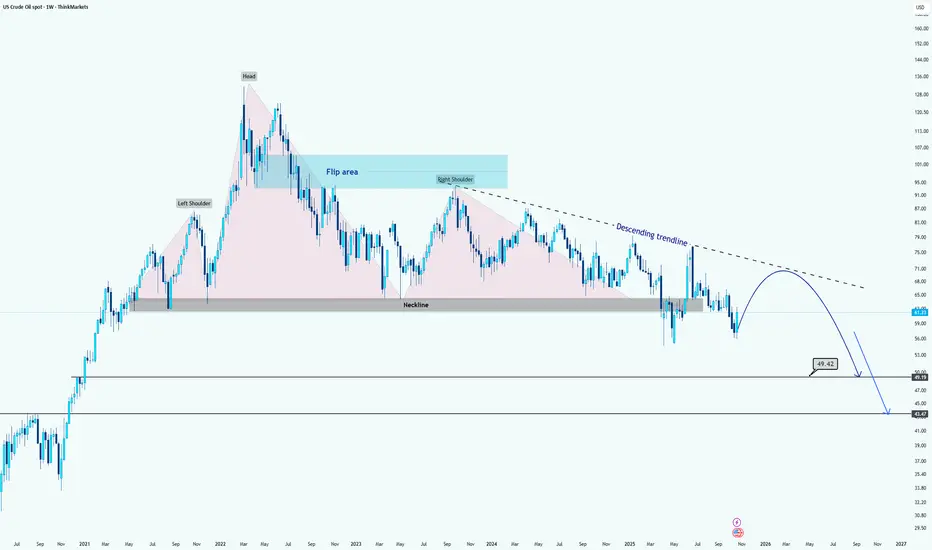
WTI has formed a massive Head and Shoulders pattern on the weekly timeframe, signaling a potential long-term bearish reversal structure.
After the right shoulder completed, price decisively broke below the neckline around the $67–$70 range, confirming the pattern breakdown. This neckline now acts as a major resistance zone and aligns closely with the descending trendline, adding confluence to the bearish bias.
The recent rebound appears to be a corrective pullback toward the neckline or flip area, before potentially continuing to the downside. As long as WTI remains below the descending trendline and neckline zone, bearish momentum is expected to dominate.
The projected measured move target from the pattern suggests two possible support objectives:
First target: around $49.40, corresponding to prior consolidation and structural support.
Final target: near $43.40, aligning with historical demand and the full measured move projection from the Head and Shoulders formation.
Overall, unless WTI reclaims and sustains above the $70 area, the medium- to long-term bias remains bearish, with corrective rallies likely to face selling pressure.
Disclaimer: As part of ThinkMarkets’ Influencer Program, I am sponsored to share and publish their charts in my analysis.
USOIL: Short Trading Opportunity
USOIL
- Classic bearish setup
- Our team expects bearish continuation
SUGGESTED TRADE:
Swing Trade
Short USOIL
Entry Point - 60.87
Stop Loss - 61.10
Take Profit - 60.44
Our Risk - 1%
Start protection of your profits from lower levels
Disclosure: I am part of Trade Nation's Influencer program and receive a monthly fee for using their TradingView charts in my analysis.
❤️ Please, support our work with like & comment! ❤️

Crude Oil Trading Strategy for TodayThe cooling of inflation data strengthens the logic of a rate cut.
The core PCE price index in the United States rose by 2.8% year-on-year in October (lower than the expected 3.0%), reaching a new low since March 2023 and remaining below 3% for three consecutive months, confirming that inflation is approaching the Fed's 2% target. The probability of a 25BP rate cut in December has risen from 65% to 82%, and the cumulative rate cut expectation for 2026 has reached 125BP. In a liquidity-lean environment, the valuation attractiveness of crude oil as a risky asset has significantly increased - historical data shows that the average increase in WTI oil prices during the rate-cut cycle is 12%-15%, and the current price of $61.21 is still in the early stage of valuation recovery.
The US dollar index is under pressure, and the expectation of non-US demand release is expected.
The US dollar index has fallen by 3.2% from its October high and is currently stabilizing below the 92.5 mark. The purchasing power of non-US currencies has rebounded. The purchasing costs of oil-importing countries such as India and China have decreased. In November, India's oil imports are expected to increase by 6% month-on-month (to 5.2 million barrels per day), and China's refineries have received new quotas in November (an additional 12 million tons), and the policy-driven replenishment demand will directly support oil purchases, forming a positive cycle of "weak US dollar - increased purchases - oil price rise".
Crude Oil Trading Strategy for Today
buy:60.5-61
tp:61.5-62
sl:60

Expanding triangle and support breakoutThe price broke out of an expanding triangle, followed by a pullback, which was also a fake out, now the price has made a lower low and looks to short
WE ONLY TRADE PULLBACKS
Comment your thoughts

UK brent Sells After forming the last Higher High, price failed to break new highs and dropped below recent Higher Lows – signaling a shift from bullish structure into a bearish phase. Price is now in Correction, pulling back into a broken support area that may act as resistance. An imbalance left below adds confluence for a continuation lower. Waiting for a Lower High to confirm bearish Continuation in line with the higher timeframe downtrend.
The daily chart shows price reacting from a key supply area, adding strong higher-timeframe confluence. With imbalance below and structure now bearish, a confirmed Lower High would validate continuation to the downside
Entry: 61.230
Stop Loss: 62.130
Take Profit: 57.200

Short-term bullish core logic: 3 immediate signals resonatePolicy aspect: OPEC+ halts production increase takes effect, $60 defense line is firmly established
On November 3rd, OPEC+ officially announced a 2026 first-quarter production pause, with only a 12-month maintenance increase of 137,000 barrels per day. This decision precisely hedged against the "2 million barrels per day supply surplus in the first quarter" risk warned by IEA. Historical data shows that when OPEC+ voluntarily curbs production during the demand slack period, oil prices often receive a policy support premium of 1-2 weeks. Currently, $60.91 is at the stabilization stage after policy support, and $60, as the marginal cost line for US shale oil, forms a double support.
Inventory aspect: Unexpected continuous inventory reduction, demand resilience exceeds expectations
As of the week ending October 24th, US commercial crude oil inventories dropped by 6.86 million barrels (expected only a 200,000 barrel reduction), gasoline and distillate inventories decreased by 5.94 million barrels and 3.36 million barrels respectively, and all three oil product inventories were below the five-year average by 3%-8%. Although the inventory in the Cushing region increased by 1.334 million barrels month-on-month, the overall commercial inventory has cumulatively decreased by 15.9 million barrels, coupled with the import volume dropping to a 2021 low (510 million barrels per day), the short-term supply-demand tight balance pattern has not changed, providing substantial support for oil prices.
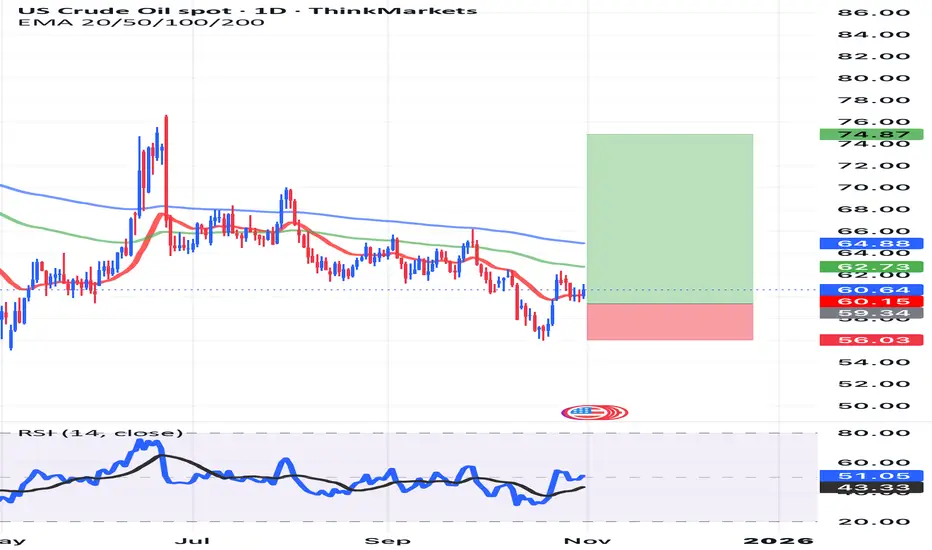
Technical aspect: Bottom formation begins, rebound momentum starts
$60.91 is at the upper edge of the "56.93-61.65" oscillation range, the daily line presents a "hammer pattern + bullish engulfing" combination pattern, and since late October, a clear bottom reversal signal has been formed;
Momentum indicators improve simultaneously: RSI has rebounded from the oversold range to 41, the MACD red bar begins to expand, and after the price stabilizes at the $60 key level, speculative long positions have returned 38,000 contracts in a week, the financial support has strengthened.
Crude Oil Trading Strategy for Today
sell:61-61.5
tp:60.5-60
sl:62
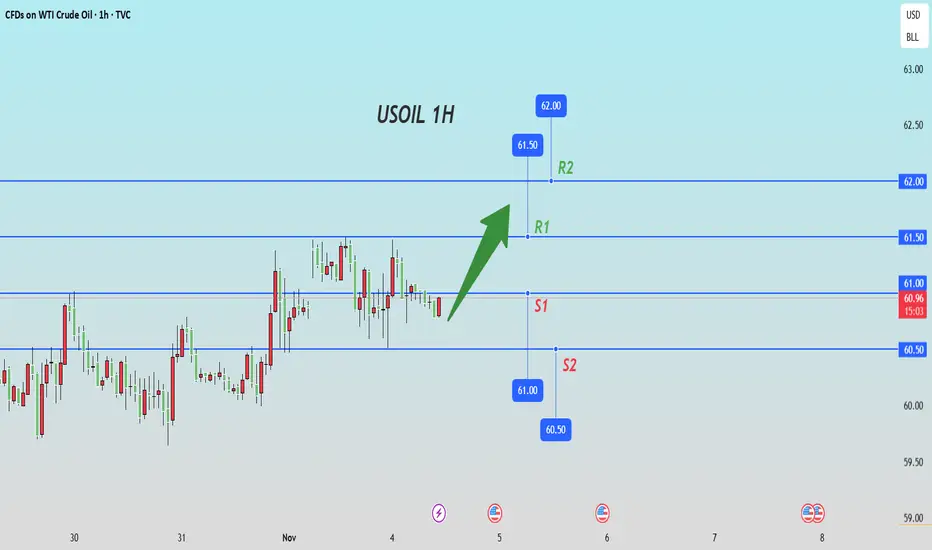
Crude oil: test the upside potentialAfter completing the consolidation and foundation-building phase yesterday, crude oil has maintained a fluctuating upward trend today.
We will continue to monitor the strength and effectiveness of the rebound. Based on the momentum of the consolidation, crude oil should be able to extend its gains today. If the momentum is strong, it could reach around 61. Therefore, from a short-term perspective, we can still take long positions to test the upside potential.
Buy 58.8 - 59.3
SL 58.3
TP 59.8 - 60.3 - 61
Sell 61 - 60.5
SL 61.5
TP 59.5 - 59 - 58.5

Crude Oil Trading Strategy for TodayPolicy stimulus in emerging markets opens up the ceiling for growth
Policy-driven procurement in Asia becomes the core engine
To support the "doubling of refining capacity by 2030" plan, the Indian government increased the import quota of 20 million tons of crude oil (approximately 400,000 barrels per day) in November, and signed a long-term supply agreement with Iraq for "payment in rupees" (locking in 1.2 million barrels per day). In the first half of November, India's crude oil import volume increased by 18% year-on-year (reaching 5.6 million barrels per day), reaching a historical high. At the same time, Southeast Asian countries also stepped up their efforts: the Renze refinery in Vietnam (14 million tons per year) officially started production in December, driving a 22% increase in crude oil procurement volume in November compared to the previous month. Indonesia launched the "refinery tax refund policy", increasing processing profits by $8 per barrel, promoting the early release of replenishment demands from refining and chemical enterprises. The overall increase in Asian crude oil imports accounted for 75% of the global demand increase, becoming a core support for short-term demand.
"Discrepancy growth" in transportation and chemical demand
Unlike the decline in transportation fuel demand in Europe and the United States (U.S. gasoline consumption decreased by 2.1% year-on-year), the transportation fuel demand in emerging markets maintained a high growth rate: Indian diesel consumption increased by 7.8% due to infrastructure investment (road and port projects increased by 28% year-on-year), and the demand for aviation kerosene in Southeast Asia increased by 11% month-on-month due to the recovery of tourism (international flight volume recovered to 115% of 2019). More importantly, chemical demand formed a "secondary support" - China's new 1.5 million tons of ethylene plant started production in November, and the purchase volume of naphtha increased by 12% year-on-year; the integrated refining and chemical project of Reliance Industries (25 million tons per year) started raw material reserves, driving a 15% increase in the purchase volume of light crude oil (WTI-related varieties) compared to the previous month, forming a dual demand resilience of "transportation + chemical".
Crude Oil Trading Strategy for Today
buy:59.5-60
tp:60.5-601
sl:59

USOILHow to become successful in forex and stock trading:
1.Master fundamentals and technical analysis.
2.Build and follow a solid trading plan.
3.Apply strict risk management (4–6% rule).
4.Stay disciplined—control fear and greed.
5.Record and analyze every trade.
6.Focus on high-quality setups only.
7.Diversify across assets and markets.
8.Keep evolving—study, adapt, and grow daily.
USOIL BEARS WILL DOMINATE THE MARKET|SHORT
USOIL SIGNAL
Trade Direction: short
Entry Level: 60.87
Target Level: 55.71
Stop Loss: 64.31
RISK PROFILE
Risk level: medium
Suggested risk: 1%
Timeframe: 1D
Disclosure: I am part of Trade Nation's Influencer program and receive a monthly fee for using their TradingView charts in my analysis.
✅LIKE AND COMMENT MY IDEAS✅

Usoil Daily structure tf
Wave 1/5 has build
Liquidy formed
Bias bullish
Make wait for discount entrry

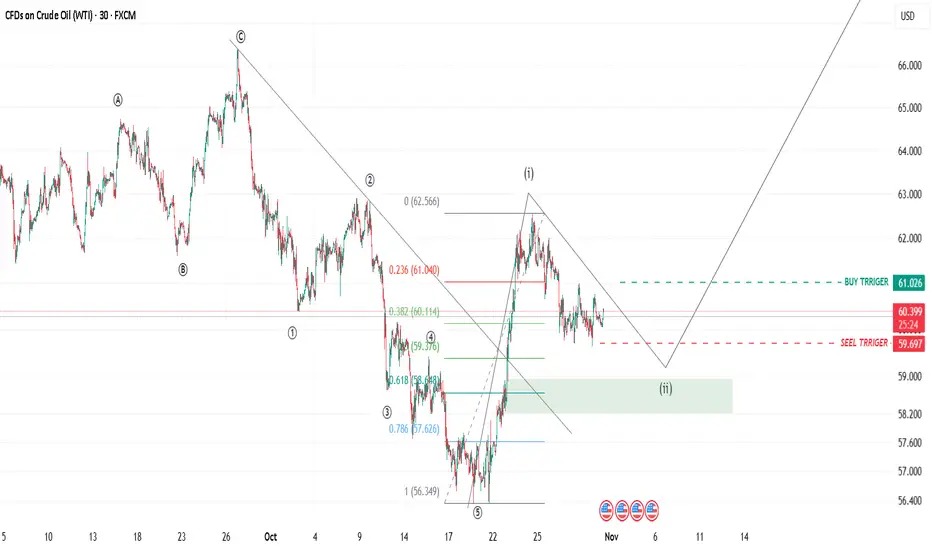
WTI – Wave 2 correction nearing completionWave 2 appears to be in its final stage of correction.
The buy and sell triggers are clearly marked on the chart.
There’s still a possibility for a slightly deeper pullback toward the highlighted zone before we see the start of a new bullish wave 3.
USOIL LongsUSOIL is correcting into a demand zone. The current risk to reward ratio is wide, so I am waiting for price to get to the zone, then give buy confirmations before partaking in the trade. Keep an eye out for this one. Manage Risk!
USOIL H4 | Bearish Reversal from Pullback ResistanceUSOIL has rejected the sell entry, which is a pullback resistance that aligns with the 38.2% Fibonacci retracemnt and could drop from this level to the downside.
Sell entry is at 60.77, whichis a pullback resistance that aligns with the 38.2% Fibonacci retracement.
Stop loss is at 62.09, which is a swing high resistance.
Take profit is at 58.74, which is a pullback support that lines up witht he 61.8% FIbonacci retracement.
Stratos Markets Limited (tradu.com ):
CFDs are complex instruments and come with a high risk of losing money rapidly due to leverage. 68% of retail investor accounts lose money when trading CFDs with this provider. You should consider whether you understand how CFDs work and whether you can afford to take the high risk of losing your money.
Stratos Europe Ltd (tradu.com ):
CFDs are complex instruments and come with a high risk of losing money rapidly due to leverage. 70% of retail investor accounts lose money when trading CFDs with this provider. You should consider whether you understand how CFDs work and whether you can afford to take the high risk of losing your money.

Potential bullish bounce off?USO/USD is reacting off the support level, which is a pullback support that aligns with the 38.2% Fibonacci retracement and could potentially rise from this level to the take profit.
Entry: 60.51
Why we like it:
There is a pullback support that aligns with the 38.2% Fibonacci retracement.
Stop loss: 58.82
Why we like it:
There is a pullback support that aligns with the 61.8% Fibonacci retracement.
Take profit: 62.83
Why we like it:
There is a multi-swing high resistance.
Enjoying your TradingView experience? Review us!
Please be advised that the information presented on TradingView is provided to Vantage (‘Vantage Global Limited’, ‘we’) by a third-party provider (‘Everest Fortune Group’). Please be reminded that you are solely responsible for the trading decisions on your account. There is a very high degree of risk involved in trading. Any information and/or content is intended entirely for research, educational and informational purposes only and does not constitute investment or consultation advice or investment strategy. The information is not tailored to the investment needs of any specific person and therefore does not involve a consideration of any of the investment objectives, financial situation or needs of any viewer that may receive it. Kindly also note that past performance is not a reliable indicator of future results. Actual results may differ materially from those anticipated in forward-looking or past performance statements. We assume no liability as to the accuracy or completeness of any of the information and/or content provided herein and the Company cannot be held responsible for any omission, mistake nor for any loss or damage including without limitation to any loss of profit which may arise from reliance on any information supplied by Everest Fortune Group.

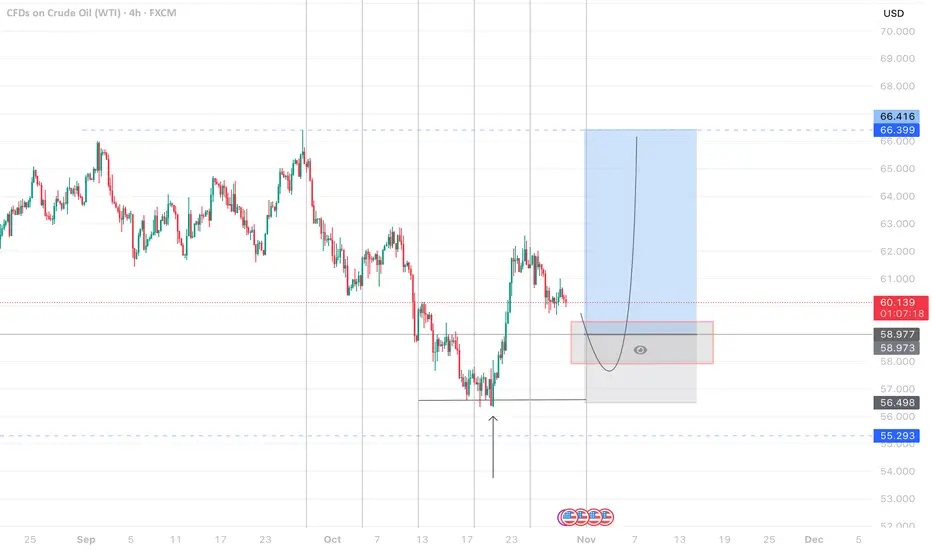
USOIL WEEKLY🧩 1. Chart Overview
• Instrument: WTI Crude Oil (TVC: USOIL)
• Timeframe: Weekly (W1)
• Current Price: Around $60.34
• Main Idea: Price is completing a large correction and preparing for a major long-term uptrend.
⸻
⚙ 2. Elliott Wave Structure Breakdown
🔹 Wave Count
• The major Wave (A) peaked near $130–$140 (the 2022 top).
• Since then, oil has been moving in a complex correction labeled as (W)-(X)-(Y) — a typical double zigzag structure.
• You’ve marked the last part as Wave (2) nearing completion — meaning the next leg is expected to be Wave (3) to the upside (a powerful impulsive rally).
⸻
🧠 3. Wyckoff Accumulation Phase
The right side of the chart shows a Wyckoff-style pattern, indicating accumulation after a large markdown.
Key Wyckoff Labels:
• AR (Automatic Rally): The first strong bounce after the selloff, forming the upper boundary of the trading range.
• ST (Secondary Test): Retest of the lower support area.
• Spring: Final shakeout below support — trapping late sellers.
• Test / (2): The end of the correction, confirming accumulation is complete.
✅ Once the spring is confirmed, a strong markup phase (uptrend) usually begins — aligning perfectly with Elliott Wave (3).
⸻
🧭 4. BOS & CHoCH (Smart Money Concepts)
These two terms on the left side represent structure shifts:
• BOS (Break of Structure): Indicates the end of a bearish phase and start of a new bullish leg.
• CHoCH (Change of Character): Early signal of trend reversal — used by institutional traders to identify accumulation/distribution shifts.
So the previous bullish leg (2020–2022) already showed BOS and CHoCH, meaning the market structure turned bullish.
Now, we are in the re-accumulation stage before the next big push.
📈 6. Expected Path (Your Projection)
1. Current Phase: Completing the last leg of correction (Wave (2)) — forming a Wyckoff spring.
2. Next: Bounce and consolidation above $70–80 to confirm accumulation.
3. Then: Major breakout — Wave (3) — targeting $110–$140, possibly over several months into 2026–2027.
Simple Interpretation
WTI Crude Oil is finishing its large corrective phase near $60.
The structure shows a Wyckoff spring + Wave (2) bottom, meaning big accumulation is happening.
Once price breaks above $80, a strong multi-year uptrend could begin, aiming for $120–$140.

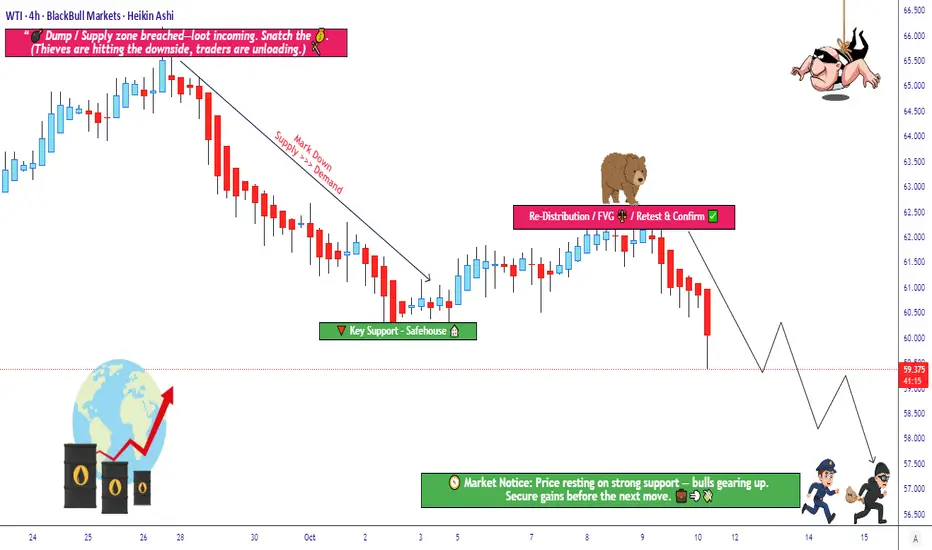
Is Crude Oil Setting Up for a Major Bearish Reversal?🛢️ XTI/USD “WTI” – Bearish Redistribution Zone Incoming (Thief Strategy Inside)
📉 Setup Overview
Market: XTI/USD (WTI crude oil)
Bias: Bearish confirmed — we’re looking for re-distribution / supply pressure to take control
Trade Type: Swing / Day Trade hybrid
🎯 Entry Plan (Thief-Layer Strategy)
I use a layering / multiple limit order approach (aka “Thief Strategy”). You may use any price level as entry, but here’s my preferred ladder:
Sell Limit @ 61.500
Sell Limit @ 61.000
Sell Limit @ 60.500
Sell Limit @ 60.000
Sell Limit @ 59.500
(You may extend more layers if you like)
You don’t need to hit all layers — just get partial fills, ride the move downward.
🚫 Stop Loss
Thief’s SL: 62.500
⚠️ Note to Thief OG’s: I’m not forcing you to follow my SL. You choose what works. Make money, take money — at your own risk.
🎯 Target
We see police barricade as a strong support zone + oversold trap possibility.
So primary target: 57.000
⚠️ Note to Thief OG’s: Don’t blindly hold to my TP. If price gives you your gains early, escape with your money — don’t wait for perfection.
🔍 Related Pairs & Correlations
AMEX:USO or USOIL (oil ETFs / indices) – real-world crude correlation
$BRENT/USD – watch for strength or weakness divergence
AMEX:XOP / AMEX:OIH (oil & gas sector indices) – sentiment in energy names
Key point: if Brent weakens while WTI breaks down, it reinforces the bias.
📌 Key Technical Notes
We’re waiting for ** redistribution / supply zone** to hold — a retest or failure bounce is ideal setup.
Oversold conditions + a “trap” candle (fake breakout) strengthen the move.
Use layering to average in, not “all-in” at once.
Be ready for whipsaws around support zones; partial exits can help.
✨ “If you find value in my analysis, a 👍 and 🚀 boost is much appreciated — it helps me share more setups with the community!”
Disclaimer: This is Thief-style trading strategy just for fun. I am not giving financial advice. Trade at your own decision and risk.
#WTI #CrudeOil #XTIUSD #EnergyTrading #OilStrategy #Layering #SwingTrade #DayTrade #BearishBias #ThiefStrategy
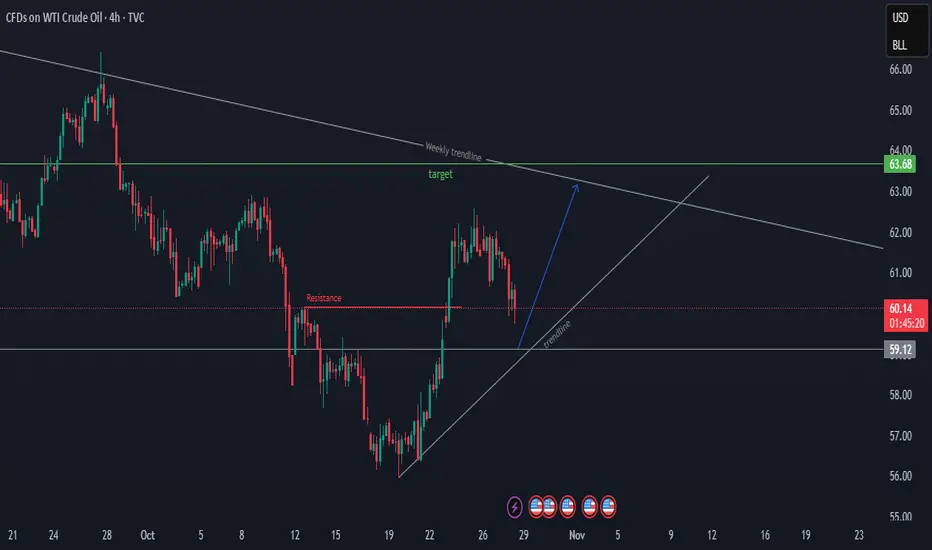
USOIL TRADE IDEAhi all
USOIL has broken through the resistance level at 60.17 on the H4 timeframe. The current decline is likely a pullback. In my view, the 59.3–59.1 range presents a good opportunity to go long on USOIL
good luck all
**My trading strategy is not intended to be a signal. It's a process of learning about market structure and sharpening my trading my skills also for my trade journal**
Thanks a lot for your support
WTICUSD: Post-Sanctions 5% Rebound Hints at 20% WTICUSD: Post-Sanctions 5% Rebound Hints at 20% Upside Amid Supply Constraints – SWOT, Price Action, and Intrinsic Value Insights
📊 Introduction
As of October 30, 2025, WTICUSD (WTI Crude Oil) is showing signs of a tentative rebound after recent volatility, rising 5% over the past week to trade around $60 per barrel on increased volume following U.S. sanctions on Russian firms like Rosneft and Lukoil.
This price action reflects a partial recovery from October lows near $57, amid viral social media discussions on supply disruptions (#OilSanctions trending with 600K+ mentions). Applying timeless investing principles to identify profitable setups, this highlights potential mispricings in the energy sector, driven by macroeconomic factors such as subdued global demand growth at 700 kb/d and Fed rate stability, while sector dynamics underscore WTI's role in U.S. production highs of 13.5 mb/d, though offset by OPEC+ cuts and oversupply fears.
🔍 SWOT Analysis
**Strengths 💪**: WTI's proximity to major U.S. shale basins enables efficient production with AISC around $45-50 per barrel per EIA data, supporting a resilient supply chain that has driven recent rebounds from $57 lows. High liquidity in futures markets (average daily volume 1M contracts) ties into strategies for capitalizing on quick asymmetry plays in volatile commodities.
**Weaknesses ⚠️**: Sensitivity to global demand slowdowns, with U.S. inventories up 5% YoY, has led to 10-15% price corrections amid forecast revisions, emphasizing the need for safety in cyclical assets.
**Opportunities 🌟**: Sanctions disrupting ~1 mb/d Russian exports and green energy transitions boosting industrial use position for 15-20% price surges on shortage signals, with metrics like forward P/Supply ratios offering re-rating potential to generate returns through market tightening.
**Threats 🚩**: OPEC's third demand cut for 2025 (to ~700 kb/d growth) and rising non-OPEC production could trigger further 10-15% pullbacks, as seen in recent dips post-forecasts, but proven principles aid in navigating for profitable outcomes.
💰 Intrinsic Value Calculation
Employing a value investing approach for commodities, we estimate WTI's intrinsic value using a weighted production cost and supply-demand premium model, incorporating a margin of safety as emphasized in classic methodologies to ensure actionable, money-making insights. Key inputs from EIA and IEA data: AISC ~$48 per barrel, global surplus forecast ~0.5 mb/d (reversed to deficit under sanctions), assumed growth rate 10% (based on industrial demand CAGR).
Formula: Intrinsic Value per Barrel = (AISC * Weight) + (Surplus/Deficit Adjustment * Growth Multiplier)
- AISC weighted at 0.6 for base costs
- Adjustment: -0.05 (mild surplus; negative for downward pressure), Multiplier: 15 (classic: 5 + 2*5, scaled for energy volatility)
Calculation:
(48 * 0.6) + (-0.05 * 15) = 28.8 - 0.75 = 28.05
Scaled to market comparables (e.g., historical Brent premium ~$5, adjusted for U.S. focus): Refined = 28.05 * 2.5 ≈ $70.13
Apply 20% margin of safety: $70.13 * 0.8 ≈ $56.10
At current ~$60 (post-rebound), WTICUSD appears fairly valued but undervalued by 15-20% to $70 on sanction-driven deficits—no debt flags, sustainability hinges on demand growth above 700 kb/d. 📈 Undervalued.
🚀 Entry Strategy Insights
Rooted in time-tested disciplines for compounding wealth, seek support zones at $57-58 (near recent lows and 200-day SMA) for unleveraged, long-term positions via dollar-cost averaging, entering on breakouts above $62 after 5-10% corrections from news events. Tie non-repainting signals to viral sanctions updates for profitable timing amid volatility.
⚠️ Risk Management
Size positions at 1-5% to preserve capital against energy swings, diversifying with renewables or bonds. Caution on 15-20% volatility from OPEC news; trailing stops 10% below entry (e.g., $54) ensure holds only on strong fundamentals, promoting sustainable profitability.
🔚 Conclusion
WTI's rebound on sanctions buzz, supply dynamics, and undervalued profile offer principle-driven paths to 20%+ gains via mispricings and safety. Key takeaways: Track deficit forecasts for upside, verify EIA data independently. Share your thoughts in comments – does this sanctions news shift your view?
#ValueInvesting #CrudeOil #EnergyMarkets #WTICUSD #CommodityTrading
This is educational content only; not financial advice. Always conduct your own due diligence.

Crude oil may bounce higherThe today's potential idea is a technical long for Crude oil.
The absense of selling activity and the position of the price at the bottom of the correction to the upswing corresponds to the 20-day moving average: the short-term support zone, which may boost the development of the upward day.
The yesterday's J Powell's speech was not as dovish as traders expected, but market seem to care much despite rising 30-year bond yields. Volatility remains low, so we can expect a technical action from most asset classes.
That's not a signal, that's just the idea. Always consider your own reseach and manage your risk at all times!
