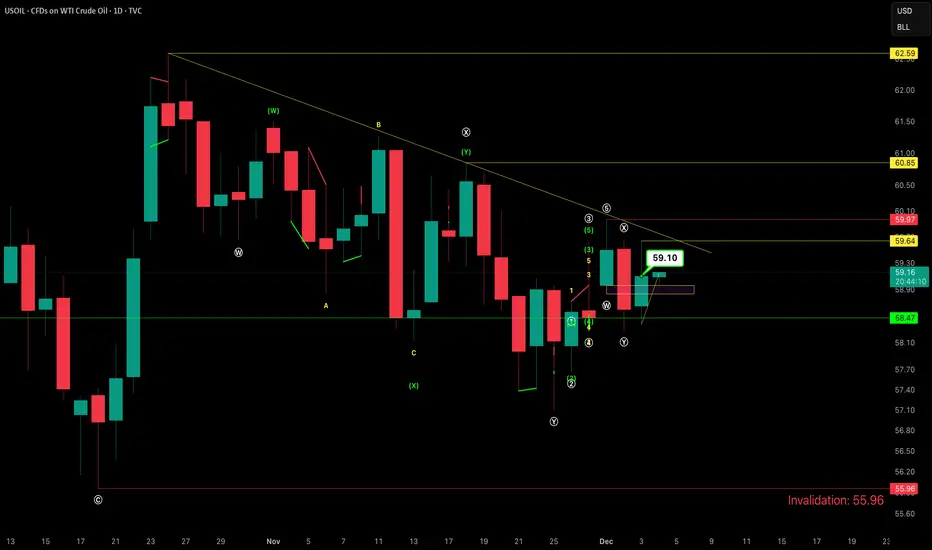
WTI OIL targeting at least $56.00 on the short-term.WTI Oil (USOIL) continues to expand its 4-month Channel Down and has repeatedly been rejected on its 1D MA50 (blue trend-line) in the past 40 days.
As mentioned before, this is similar to September's price action, which eventually tested the previous Support before breaking it and move to a new Lower Low on the 1.5 Fibonacci extension.
As a result, we are still expecting to see $56.00 on the short-term.
---
** Please LIKE 👍, FOLLOW ✅, SHARE 🙌 and COMMENT ✍ if you enjoy this idea! Also share your ideas and charts in the comments section below! This is best way to keep it relevant, support us, keep the content here free and allow the idea to reach as many people as possible. **
---
💸💸💸💸💸💸
👇 👇 👇 👇 👇 👇
Trade ideas

Oil, Numbers, and Energy Flows: Decoding December’s Symbolic PulThe 3 December 2025 candle closed at 59.10, which from a numerology perspective can be interpreted as 5 + 9 = 14, and 1 + 4 = 5, symbolising volatility and rapid shifts. The decimals — 10 = 1 + 0 = 1 — represent initiation and new beginnings.
From this, we can conclude that 4 December may bring significant volatility. Perhaps developments involving the USA and Venezuela could emerge — just a thought we wanted to share for educational purposes.
USoil: In all the cases, this looks upFor USoil, in all the cases this looks up. Any time we see a buy we will take it.
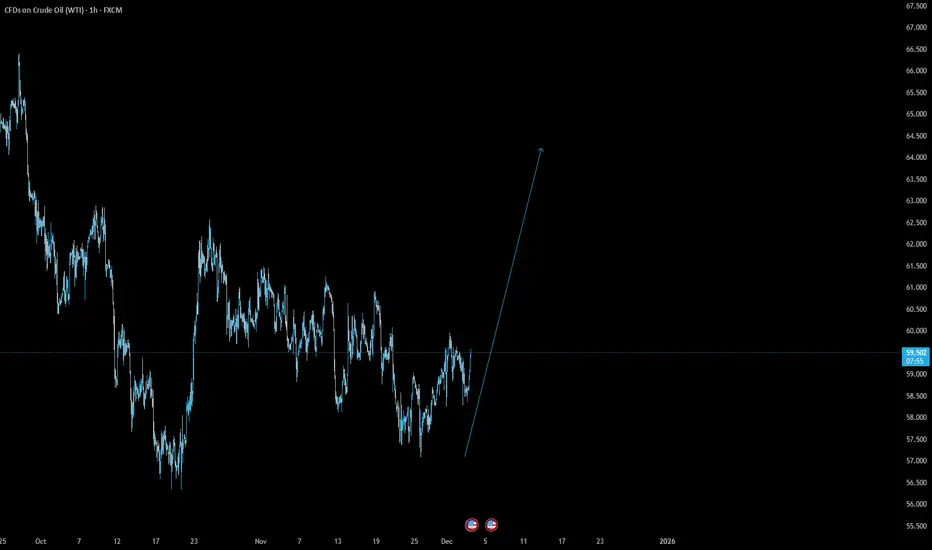
OIL IS (SOON) GOING TO 60ish.. 61, 62, 63, ....I am bullish on CrudeOil..
It has perfect wave counting 5 waves of C- correction.
And it stopped perfectly at the 78.6 Fibo levels with a strong bull candle.
Don't miss this chance.. Very good R:R from this level..
CHEEERRRSSSS...!!!!

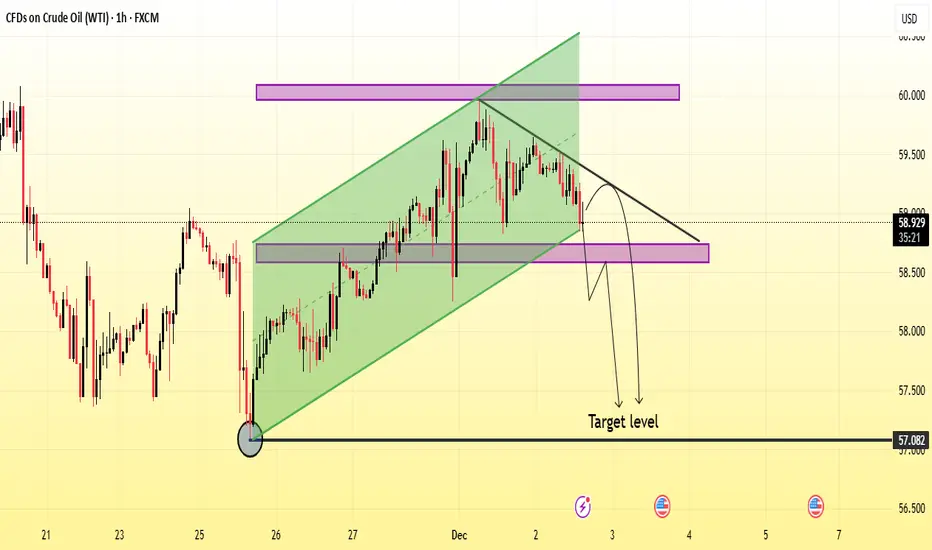
Usoil Next Selling Move Analysis Read the DescrpitionUSOIL with technical analysis drawn on it. A green rising channel highlights a previous uptrend, which has been broken downward. Pink horizontal zones mark resistance and support areas. A downward arrow points toward a labeled “Target level,” suggesting a bearish expectation after price breaks below the support zone.
❤️ please Kindly support with Boost and Comment i need your feedback ❤️
USOIL Is Bearish! Sell!
Here is our detailed technical review for USOIL.
Time Frame: 4h
Current Trend: Bearish
Sentiment: Overbought (based on 7-period RSI)
Forecast: Bearish
The price is testing a key resistance 59.116.
Taking into consideration the current market trend & overbought RSI, chances will be high to see a bearish movement to the downside at least to 58.630 level.
P.S
Overbought describes a period of time where there has been a significant and consistent upward move in price over a period of time without much pullback.
Like and subscribe and comment my ideas if you enjoy them!

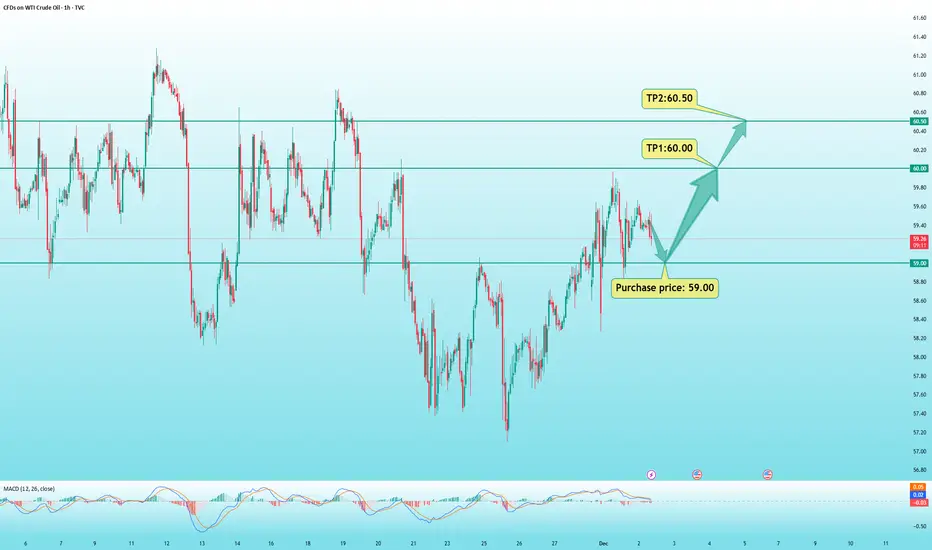
USOIL: Wait for a pullback to $59 to buy.During Monday’s Asian trading session, NYMEX West Texas Intermediate (WTI) crude oil futures rose 1.7%, trading around $59.30 per barrel. Oil prices opened strongly as OPEC+ agreed to halt production increases starting from Q1 2026, providing solid buying support at the open.
On the 1-hour chart, crude oil is showing high-level consolidation, with prices repeatedly oscillating around the moving average system, indicating a short-term neutral, range-bound objective trend.
However, from a subjective trend perspective, the bias remains to the upside. The MACD fast and slow lines have pulled back toward the zero axis and are about to form a bullish crossover, suggesting that bullish momentum is building.
There is a high probability that crude oil will break to new intraday highs today.
Intraday Trading Plan:
Buy near: $59.00
Take Profit 1: $60.00
Take Profit 2: $60.50
Stop-loss: Adjust based on individual risk tolerance
WTI Oil: Key levels for long-term buyingThis analysis is based on the Initiative Analysis (IA) method.
Hello traders and investors!
I reviewed the higher timeframes for oil, and the 2-month chart shows an interesting structure. Price is moving within a very wide sideways range, roughly from $11 to $147.
The lower boundary of this range has already been defended by buyers in the past — in 2016 and again in 2020-2021.
At the moment, seller initiative dominates within this range, with a potential target around 48.52.
The 48.52 level represents the upper boundary of a buyer zone that has not yet been tested. This zone was formed by a high-volume candle, which adds to its significance. The base of that candle — the 47.071–48.52 range — is an area where it makes sense to look for long-term buying patterns.
The 42.206 level is even more attractive for identifying long-term buying opportunities.
The first target for long-term long positions, if this scenario plays out, is 95.501, which corresponds to a test of the seller zone.
Wishing you profitable trades!

Crude Oil short...GM gents, hope you're doing alright.
It seems Crude Oil was not cheap enough, technicals indicate it can crater from here for the next 2 months give or take...
Implications on macro are bullish risk assets, with some lag after the effect of cheaper energy materializes on earnings. For now the 70% spike in Nat Gas needs to be dealt with, although it seems that market topped already.
Signal is invalidated above the red dashed line.
Best of luck!
Cheers,
Ivan Labrie.

CRUDE OIL Bearish Bias! Sell!
Hello,Traders!
CRUDE OIL taps into a fresh SMC supply pocket after a clean liquidity grab and shifts order flow bearish. The current pullback simply mitigates the breaker before another leg down unfolds toward discounted pricing. Time Frame 4H.
Sell!
Comment and subscribe to help us grow!
Check out other forecasts below too!
Disclosure: I am part of Trade Nation's Influencer program and receive a monthly fee for using their TradingView charts in my analysis.

USOIL - Type II Bulish GartleyUSOIL is completing a Bullish Gartley at the 0.786 retracement (56.70–57.30), positioned inside a strong demand zone and supported by RSI divergence + VPVR low-volume rejection.
Expectation:
A bullish reversal targeting mean reversion toward 60.00–61.00.
Entry:
Buy inside 56.70–57.30 (aggressive) or wait for bullish confirmation (conservative).
Stop Loss:
56.20–56.60 below PRZ and demand invalidation.
Targets:
TP1: 59.20–59.60
TP2: 60.80–61.20 (POC magnet)
TP3: 63.00–63.50 (runner)
Rationale:
Gartley completion + structural demand + RSI divergence + VPVR reversion =
strong probability of bullish corrective movement.

CRUDE (USOIL) – (1H) Bullish LCM Structure in PlayPrice has completed a clean Liquidity Cycle Model sequence:
1. Liquidity Sweep
Market swept the major low at 5780, clearing the downside liquidity and tapping a higher-timeframe demand.
2. Reversal Phase
Following the sweep, price reclaimed the 5811–5816 refined demand zone, creating a solid bullish shift.
3. Continuation Setup
The current pullback is respecting the refined OB at 5825 – 5810, forming the basis for continuation.
🔹 BUY SETUP (LCM)
Entry Zone: 5825 – 5815 (White Line)
Intraday Invalidation: Below 5785
hard Invalidation: Below 5760
🎯 TARGETS
TP1: 5945 Mid-range supply flip
TP2: 6025 Imbalance fill + next structural level.
TP3: 6225 – major HTF resistance and full LCM continuation target.
📌 Summary
Price swept the lows, reclaimed structure, and is now positioned for bullish expansion as long as the refined demand at 5815 holds. A break above 5890’should unlock continuation toward 5935 and 6034.
LCM rewards patience, not prediction
Pls like and comment if you find this useful, that encourages me share more.
BolaXChange 🖤🖤

Crude Oil Fails to Pull Away From This Year’s LowsBroad-based weakness in WTI crude has persisted in the short term, and the price has lost more than 3.5% over the past three trading sessions, bringing it increasingly closer to the 2025 lows around 57 dollars per barrel. For now, selling pressure remains firmly in place, partly because OPEC+, the world’s most influential oil-producing group, continues moving toward higher production levels heading into 2026. Additionally, the possibility of a peace agreement between Russia and Ukraine raises the chance that certain economic sanctions on Russia could be lifted, further increasing the outlook for global supply. As long as expectations of a potential oversupply in 2026 persist, this scenario may continue to exert downward pressure on WTI and act as a key catalyst for sustained selling pressure in the sessions ahead.
Downtrend Remains Firm
For several months, crude oil has been following a consistent downward path, and the current trendline remains strong despite occasional upward corrections that have been insufficient to break it. As a result, this bearish formation remains the most important technical factor to watch. If selling pressure continues to push prices into new lows or keeps them below 60 dollars per barrel, the bearish bias will likely continue to dominate short-term price action.
RSI
At the moment, the RSI line is fluctuating near the neutral 50 level, suggesting a balance between buying and selling impulses in the short term. If this behavior holds, it may give way to a period of price indecision.
MACD
A similar scenario is observed in the MACD, whose histogram remains near the zero line, indicating an equilibrium in short-term moving-average strength. If this pattern continues, it may lead to a period of sustained indecision in WTI over the coming sessions.
Key Levels to Watch:
61 dollars: The most relevant resistance level, aligned with the 23.6% Fibonacci retracement. A bullish breakout above this area could threaten the broader downtrend and open the door to a stronger bullish bias in WTI.
58 dollars: An intermediate barrier aligned with the downtrend line and the 50-period moving average. Price action that remains near this zone may trigger a short-term sideways range, increasing uncertainty in WTI.
57 dollars: This level corresponds to the 2025 lows and currently acts as the most important support. A break below it could confirm a dominant bearish bias and extend the downtrend into the coming sessions.
Written by Julian Pineda, CFA, CMT – Market Analyst

CFD great chartThe US Federal Reserve is expected to cut the policy rate at the last meeting of 2025.
The revised Summary of Economic Projections and Fed Chair Powell’s comments will be key as a rate cut is largely priced in.
The US Dollar could stay on the back foot unless the Fed delivers a hawkish surprise.
The United States (US) Federal Reserve (Fed) will announce its interest rate decision on Wednesday, with markets widely expecting the US central bank to deliver a final 25 bps cut for 2025. While the move is widely priced in, this may be overshadowed by the vote itself as dissent within the Committee is anticipated from both hawks and doves.

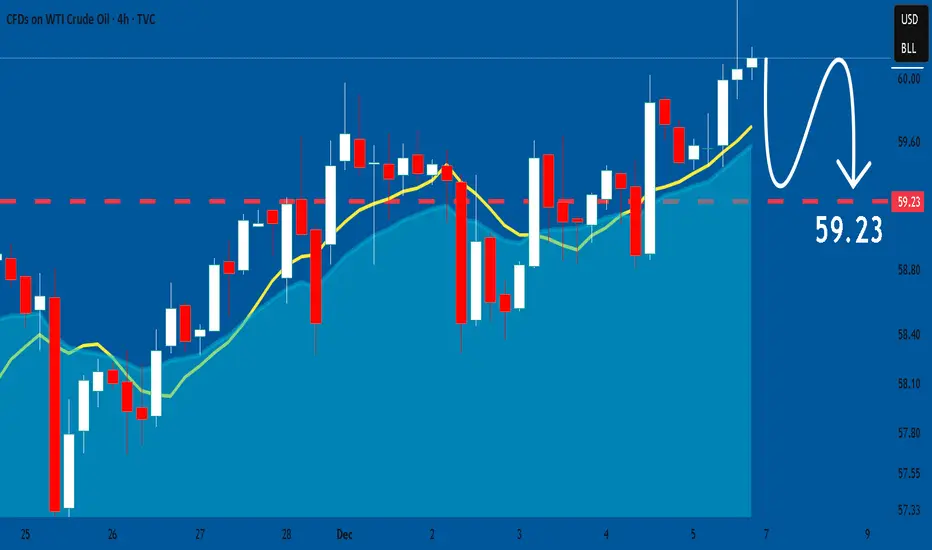
Crude oil is about to officially fall intoYesterday's decline validated our short-selling strategy and the continued validity of the current wave count. Crude oil closed with a large bearish candlestick, completely erasing the gains from Friday and Thursday of last week. It's worth noting that when there's no news or geopolitical support, the bears often outperform the bulls in terms of technical movement. Yesterday's decline also confirmed that the chart pattern wasn't a flat 3-4 wave structure, but rather a zigzag 3-4 wave. Looking at the daily chart, the price was pressured after touching the 60-day moving average, indicating that this upward move, forming a long and complete 3-4 wave, was a preparation for the 3-5 wave decline. The easing of tensions between Russia and Ukraine has also contributed to the bearish trend in crude oil. The current 3-5 wave hasn't yet gained momentum, but once it does, it could break below $55. Therefore, we will continue to trade with a bearish bias today, using small stop-loss orders to aim for larger profits.
Today's crude oil recommendation: 1. Sell at $59.20, with a stop loss of 30 points and a take profit at $57.40. (Alternatively, consider selling near $58.95).
2. If you feel that selling at $59.20 in strategy 1 is too risky, you can sell at $59.50 for a more conservative approach, with a stop loss of 30 points and a take profit at $58.

USOIL Bearish Continuation After Trendline RejectionUSOIL Trade Setup (1H Chart)
Key Levels:
Resistance Trendline: Downward sloping
Support Zone: 59.00 – 59.50
Target Zone: 58.20 – 58.40
“WTI Crude Oil continues to trade within a clear bearish structure, marked by a consistent series of lower highs. The descending trendline shows strong seller control, as price repeatedly fails to break above it.
A major support zone is highlighted around 59.00 – 59.50, where price is currently moving toward after another rejection from the trendline. This reaction confirms the bearish continuation pattern.
If the support zone breaks, the next downside target lies near 58.20 – 58.40, where previous demand and liquidity accumulation occurred.
As long as price remains below the descending trendline, the bearish bias stays intact. Only a clean 1H close above the trendline would weaken this bearish setup.”
Trend: Strong bearish continuation
Bias: Sell below trendline
Support Zone: 59.00 – 59.50
Next Targets: 58.20 → 58.40
Invalidation: Breakout and close above the descending trendline

USOIL: Market Sentiment & Price Action
The analysis of the USOIL chart clearly shows us that the pair is finally about to tank due to the rising pressure from the sellers.
Disclosure: I am part of Trade Nation's Influencer program and receive a monthly fee for using their TradingView charts in my analysis.
❤️ Please, support our work with like & comment! ❤️
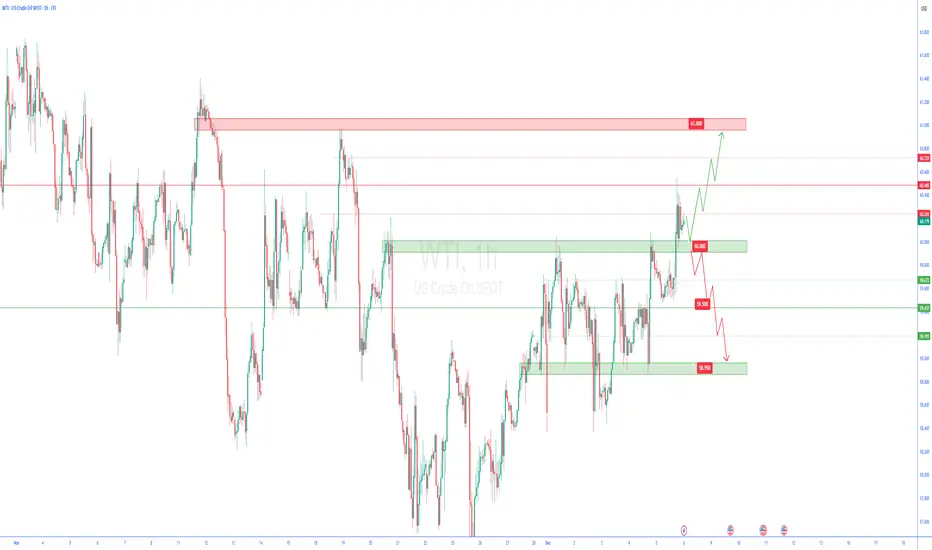
wti 1h🔹 Overall Outlook and Potential Price Movements
In the charts above, we have outlined the overall outlook and possible price movement paths.
As shown, each analysis highlights a key support or resistance zone near the current market price. The market’s reaction to these zones — whether a breakout or rejection — will likely determine the next direction of the price toward the specified levels.
⚠️ Important Note:
The purpose of these trading perspectives is to identify key upcoming price levels and assess potential market reactions. The provided analyses are not trading signals in any way.
✅ Recommendation for Use:
To make effective use of these analyses, it is advised to manually draw the marked zones on your chart. Then, on the 5-minute time frame, monitor the candlestick behavior and look for valid entry triggers before making any trading decisions.
Update on the oil analysisBased on yesterday’s analysis on oil, we said it was a good buying opportunity and that the price had a high chance of reaching $62 per barrel. Today, the price didn’t make any significant move, and we’re only seeing a lot of lower wicks on the candles, which is a good sign and shows strong buying interest.
I don’t think there will be any major movement for the rest of tonight, so we’ll keep the position open for next week and see how the move continues.

Daily Market Report — Thursday, Dec 4, 2025📉 Market Moves
WTI (CLF26): +1.22% → 2-week high
RBOB (RBF26): –0.01% → flat-to-negative
Crude rallied on geopolitics + stalled peace talks, while gasoline stayed weighed down by weak demand signals and pricing cuts from Saudi Arabia.
📊 Key Drivers
Bullish Drivers (major upside catalysts)
1. No breakthrough in US–Russia peace negotiations
Market takeaway:
War is not ending soon
Sanctions on Russian energy remain
Expected return of Russian supply is pushed further out
This was the primary reason WTI broke to a 2-week high.
2. High geopolitical tension in Russia + Venezuela
Russia:
Putin threatens to attack ships helping Ukraine
4 Russian tankers hit in Black Sea
Baltic terminal and CPC pipeline disruptions continue
Russia has lost 13–20% of refining capacity
Venezuela:
Trump declares airspace “closed”
Potential U.S. military strikes
This combination adds a multi-regional risk premium that directly supports crude.
3. Russian export collapse continues
Vortexa shows:
Russia product shipments at 1.7m bpd (3-yr low)
Structural supply tightness persists.
4. OPEC+ pauses increases for Q1-2026
This ensures:
No new supply coming
Market won't be flooded during a surplus-risk period
Bullish because it caps non-Russian supply growth.
5. Rig count collapse (4-year low)
US production risk tilts mildly downward:
Rigs now at 407, down from 627
Signals lower US output in future months
Bearish Drivers (limiting or reversing price strength)
1. Saudi Arabia cuts OSP to Asia → lowest in 5 years
This is a big demand signal:
Aramco cutting Arab Light by 30 cents
Lowest pricing since Jan 2021
Market interprets as weak Asian demand
This was the top bearish driver of the session.
2. Stronger dollar (intraday reversal from multi-week lows)
Dollar rose through the session → capped crude gains and flipped RBOB red.
3. Floating storage at a 2.5-year high
Vortexa:
124.64 million bbl, +12% w/w
The highest since mid-2023
Reinforces the “market saturated” narrative.
4. OPEC + IEA highlight global surplus outlook
OPEC’s Q3 revision → +500k bpd surplus
IEA’s 2026 surplus outlook → +4.0m bpd
Underlying long-term sentiment remains bearish.
📝 Post-Mortem — Thursday, Dec 4, 2025
Why WTI broke to a 2-week high?
War isn’t ending → sanctions remain
Russian tanker attacks escalate supply risk
CPC + terminal disruptions keep pressure on flows
Risk-on sentiment early session
OPEC+ supply cap confirmed
These outweighed the bearish factors.
Why gasoline closed flat-to-negative?
Because gasoline is demand-led:
Saudi OSP cut = huge demand warning for Asia
Dollar strengthened intraday → imports more expensive
Crack spreads soften when economic signals weaken
Thus gasoline diverged from crude and closed red.
What the session tells us
The physical supply side remains tight, but not tightening further.
The demand side is weakening, with Saudi pricing cuts confirming it.
Market is now extremely headline-sensitive, especially around peace talks.
Expect jerky, volatile sessions until clarity emerges from either:
Peace negotiations
Russia export flows
Saudi pricing shifts
OPEC+ messaging
US macro data

U.S. Crude Oil (WTI) The upside barrier is located at $59.66
U.S. crude Oil continues to post mixed results as we hold within the corrective channel formation.
We have a resistance zone between $59.66 and $59.80.
Price in this area continues to attract the sellers.
We could be analysed as holding within a large Wyckoff accumulation zone. This would have an eventual bias to break to the upside.
A 261.8% extension level is currently located at $58.22. This is close to the base of the range
Conclusion: I would expect continued mixed and volatile trading. I look for rallies to be sold within the resistance zone

Bullish breakout?WTI Oil (XTI/USD) is reacting off the pivot, which acts as a pullback support that aligns with the 50% Fibonacci retracement and could bounce to the 1st resistance.
Pivot: 59.54
1st Support: 59.01
1st Resistance: 60.82
Disclaimer:
The opinions given above constitute general market commentary and do not constitute the opinion or advice of IC Markets or any form of personal or investment advice.
Any opinions, news, research, analyses, prices, other information, or links to third-party sites contained on this website are provided on an "as-is" basis, are intended to be informative only, and are not advice, a recommendation, research, a record of our trading prices, an offer of, or solicitation for, a transaction in any financial instrument and thus should not be treated as such. The information provided does not involve any specific investment objectives, financial situation, or needs of any specific person who may receive it. Please be aware that past performance is not a reliable indicator of future performance and/or results. Past performance or forward-looking scenarios based upon the reasonable beliefs of the third-party provider are not a guarantee of future performance. Actual results may differ materially from those anticipated in forward-looking or past performance statements. IC Markets makes no representation or warranty and assumes no liability as to the accuracy or completeness of the information provided, nor any loss arising from any investment based on a recommendation, forecast, or any information supplied by any third party.

CRUDE OIL Local Short! Sell!
Hello,Traders!
CRUDE OIL price is reacting inside a major supply zone, suggesting a potential shift as liquidity begins to unwind. If orderflow confirms, price may slide back toward the target level as SMC dynamics align with bearish distribution. Time Frame 2H.
Sell!
Comment and subscribe to help us grow!
Check out other forecasts below too!
Disclosure: I am part of Trade Nation's Influencer program and receive a monthly fee for using their TradingView charts in my analysis.
