Trade ideas

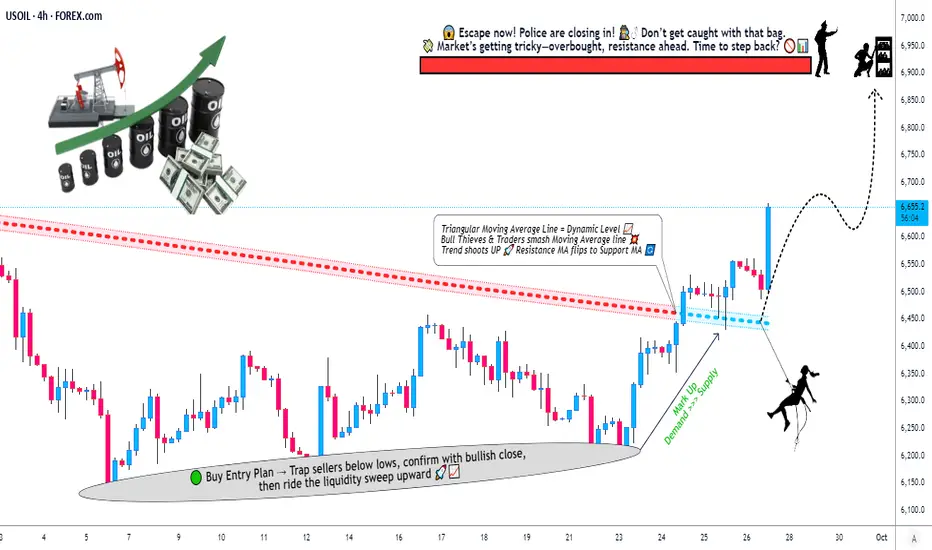
Crude Oil Trading Map: Bullish Momentum vs Key Resistance🛢️ WTI Crude Oil (USOIL/XTIUSD) – Energies Market Wealth Strategy Map ⚡
🎯 Trade Plan (Swing/Day Trade Vibe)
📌 Bias: Bullish setup confirmed by Triangular Moving Average dynamic resistance breakout.
💰 Entry (Thief Layering Strategy):
We don’t just walk in the front door — we layer like true OG’s.
Buy Limit Layers: 6450, 6500, 6550, 6600
You can always add more “layers” depending on your conviction & style.
🛑 Stop Loss (Thief Escape Plan):
Suggested SL: 6350
⚠️ Note: Dear Ladies & Gentlemen (Thief OG’s) — I’m not recommending you use only my SL. Risk is yours, profit is yours. Protect your bag your way.
🎯 Target Zone (Profit Heist Exit):
First escape point: 6900
Above here? Careful. Around 6950 sits a Police Barricade 🚔 (Resistance + Overbought Trap). That’s where the chase gets real — don’t overstay!
🔑 Key Notes for the Thief OG’s:
Layering Strategy: Spreading entries reduces exposure & maximizes flexibility.
Dynamic Resistance Breakout: Momentum shift confirms bulls are sneaking in.
Psychological Trap @6950: Overbought zones = potential reversals.
🔗 Correlation & Related Pairs to Watch:
TVC:USOIL / FXOPEN:XTIUSD (Primary Chart)
BLACKBULL:BRENT / TVC:UKOIL → Closely tracks WTI, sometimes diverges.
FX:USDJPY & TVC:DXY → Oil often inversely correlated with the US Dollar.
OANDA:XAGUSD & OANDA:XAUUSD → Commodity cousins, useful for cross-market sentiment.
FOREXCOM:SPX500 & NASDAQ:NDX → Risk-on sentiment can boost crude oil demand outlook.
✨ “If you find value in my analysis, a 👍 and 🚀 boost is much appreciated — it helps me share more setups with the community!”
⚠️ Disclaimer: This is a Thief Style Trading Strategy — just for fun and market education. Not financial advice. Trade at your own risk.
#USOIL #XTIUSD #CrudeOil #WTI #EnergyMarkets #SwingTrade #DayTrading #TechnicalAnalysis #TradingStrategy #ThiefStrategy
WTI Crude Oil – Buy SetupPrice is holding near intraday support after a strong sell-off. A potential short-term rebound could target the upper resistance zone.
Buy Entry: 57.45
Stop Loss: 57.25
Take Profit: 58.60
📈 Bias: Intraday Bullish Reversal
⚠️ Note: This analysis is for educational purposes only. Always confirm entries with your own strategy and manage risk accordingly.
#WTI #CrudeOil #XTIUSD #Scalping #TradingSetup #BuySignal

WTI to $55 amid excess supply concerns?There was some relief at the start of the week for oil prices as traders reacted to the weekend news of de-escalation in the trade war between the US and China and figured that a potential extension of the tariff truce would be net positive for the demand outlook. However, the recovery stalled as WTI prices couldn’t break above $60 per barrel and have since turned flat on the week. The bearish trend thus remains intact for oil. Here, investors are concerned about the excess supply of the stuff hitting the markets, as the OPEC+ is gradually releasing some withheld oil supplies to win back market share. The group’s plan is to increase production by a total of 1.65 million barrels per day by the end of 2025. It has already increased output by 137K bpd from October. Against a backdrop of increasing supplies, it looks like WTI is heading towards the April lows of around $55.00 again.
By Fawad Razaqzada, market analyst with FOREX.com

WTI Crude Oil range trading support at 5747The WTI Crude Oil is currently trading with a bearish bias, aligned with the broader downward trend. Recent price action shows a retest of the longer term support, suggesting a temporary relief rally within the downtrend.
Key resistance is located at 6030, a prior consolidation zone. This level will be critical in determining the next directional move.
A bearish rejection from 6030 could confirm the resumption of the downtrend, targeting the next support levels at 5747, followed by 5677 and 5606 over a longer timeframe.
Conversely, a decisive breakout and daily close above 6030 would invalidate the current bearish setup, shifting sentiment to bullish and potentially triggering a move towards 6073, then 6170.
Conclusion:
The short-term outlook remains bearish unless the WTI Crude price breaks and holds above 6030. Traders should watch for price action signals around this key level to confirm direction. A rejection favours fresh downside continuation, while a breakout signals a potential trend reversal or deeper correction.
This communication is for informational purposes only and should not be viewed as any form of recommendation as to a particular course of action or as investment advice. It is not intended as an offer or solicitation for the purchase or sale of any financial instrument or as an official confirmation of any transaction. Opinions, estimates and assumptions expressed herein are made as of the date of this communication and are subject to change without notice. This communication has been prepared based upon information, including market prices, data and other information, believed to be reliable; however, Trade Nation does not warrant its completeness or accuracy. All market prices and market data contained in or attached to this communication are indicative and subject to change without notice.

Crude Oil: Mainly Expected to Oscillate DownwardCrude oil has been in a continuous downward trend recently. Both the daily chart movement and the moving average system show a downward divergence pattern, and a new descending channel has been officially formed.
In terms of operation, we need to continue to follow the bearish trend. Today, we can take the opportunity of a rebound at the 58 level to set up short positions.
Special attention should be paid to the fact that crude oil is about to enter the contract delivery period. We need to focus on whether the delivery situation will disrupt the current trend. From the perspective of the current fundamentals and news, the long and short factors are clearly one-sided, and the overall situation still mainly depresses crude oil prices.
Sell 58.8 TP 58 - 55 SL 60.2
Daily-updated accurate signals are at your disposal. If you run into any problems while trading, these signals serve as a reliable reference—don’t hesitate to use them! I truly hope they bring you significant assistance

Oil stays pressured by a looming OPEC+ hike and US–China strainsOil stays pressured by a looming OPEC+ hike and U.S.–China strains
Fundamental Analysis
1. Oil prices remain under pressure from an upcoming OPEC+ production increase next month, even though they paused their decline over the past two days on news that India may stop buying Russian crude.
2. U.S.–China trade tension, especially tariffs threats, export restrictions, and port charges on both sides are likely weighing on global demand.
3. India has not confirmed a halt to purchases yet, but reports say some refiners may reduce imports of Russian oil.
4. Markets are awaiting EIA data, which could indicate the price direction, after the API reported a large build in crude inventories and gasoline, while distillates fell.
Technical Analysis
5. USOIL keep falling, breaking below the previous low. Price move below diverging bearish EMAs, signaling strengthening bearish momentum, signalling for further declines.
6. If USOIL breaks below the previous low at 58.00, it could test the lowest level in four and a half years at 55.00 and potentially break lower.
7. However, price could first rebound to retest the 60.00 area before resuming the longer-term downtrend.
Analysis by: Krisada Yoonaisil, Financial Markets Strategist at Exness

Copper and Oil: A Rare Divergence in the Commodity ComplexThe chart compares Copper (brown) and TVC:USOIL (blue) — two of the most cyclical commodities, both highly sensitive to global growth.
Historically, they tend to move in tandem: when economic momentum improves, both rise; when demand weakens, both fall.
But today we see an unusual divergence —
-Copper holding near multi-year highs, supported by structural deficits and energy transition demand.
-Oil trading below $60, its lowest since 2021, signaling cyclical slowdown and weak liquidity.
This gap rarely lasts long. Either copper is too optimistic, or oil is too pessimistic — one of them is likely “lying.”
Which one will be right this time?

Crude OilCrude Oil best buy aera from $52 and 2nd area is $49 this is my technical analysis. Take entry on your own risk. Thanks

Why Oil’s Drop Fuels a Global Risk-Off SentimentWTI Crude Oil Monthly Technical Outlook: Below $60 and the Broader Market Implications
As the fourth quarter of 2025 unfolds, the WTI Crude Oil (USOIL) chart offers a critical perspective on the state of global supply-demand balance and its broader impact on market sentiment. Trading near $58.5 per barrel, oil prices have fallen below a key psychological threshold, and while the move may seem technical at first, its implications reach far beyond the energy market.
The combination of weakening momentum indicators, rising supply projections, and softening global demand paints a nuanced but important story: oil’s slide below $60 is no longer just a chart event, it’s a macro signal about global growth, supply dynamics, and investor positioning.
Technical Overview: Momentum Loss Deepens
The monthly chart for WTI shows a clear picture of fatigue after multiple failed rebound attempts over the past 18 months. Since peaking near $130 in early 2022, prices have formed a persistent pattern of lower highs and lower lows, reflecting an extended process of distribution.
In recent months, WTI has failed to sustain moves above $70, with sellers consistently stepping in on rallies. The October bar extended losses toward the $58 level, marking the weakest monthly close since mid-2023.
Structurally, this decline puts WTI in a critical support zone between $55 and $57, which coincides with the base that previously stabilized prices in late 2023. Should this zone fail, the next major support rests around $50 per barrel, aligning with a key Fibonacci retracement of the 2020–2022 rally.
On the upside, the resistance band remains in the $65–$68 range, a descending trendline that has capped every rebound since early 2024. A decisive monthly close above that zone would be the first confirmation of renewed strength, but momentum indicators are still leaning toward continued weakness or sideways consolidation.
MACD and Stochastic RSI: Weakening Momentum Signals
The MACD (12,26,9) indicator remains subdued below the zero line, underscoring a prolonged loss of upside momentum. The histogram has recently turned red again, indicating that the MACD line may cross below the signal line, a potential confirmation that sellers still control the trend.
Meanwhile, the Stochastic RSI, which measures RSI velocity, has rolled over from midrange levels and is pointing lower again. Its failure to sustain a rebound above 50 shows that bullish energy has faded.
If this oscillator drops below 30, it would confirm a continuation of weak-to-neutral price action through the rest of Q4. Historically, such conditions precede prolonged consolidation phases, where volatility contracts before a new trend forms.
Together, these indicators portray a market not in full capitulation, but clearly lacking conviction for an upside breakout.
Fundamental Picture: Oversupply Meets Slowing Demand
While technical signals reveal a loss of momentum, the fundamental backdrop provides stronger clues about why oil has struggled to maintain value above $60. Recent data from major energy agencies, including the International Energy Agency (IEA), the U.S. Energy Information Administration (EIA), and multiple Reuters reports, converge on one central theme:
the global oil market is entering a surplus phase, with supply growth outpacing demand.
Large Oversupply Projections
Read full analysis on my website
darrismanresearch com
XTIUSD crossed the rtrendline LONGFinally the XTIUSD croosed the trendline and price moved above cloud and long can be entred now with target 60 and 60.5 with Fib level of 0.5 and 0.635 level.

WTI Crude Oil: What Could Happen Next?Oil prices are sitting at a really important spot right now. Here’s what to watch for:
If the price drops below $58.28, it could keep falling toward $50.
If it breaks below $50, we might see it slide into the $43–$46 range.
But if oil climbs back above $65, it could run up toward $74 again.
So in simple terms:
👉 Below $58 = could fall more
👉 Above $65 = could rise again
We’re in a “wait and see” zone ; the next move will show which way oil really wants to go.
If you’re watching this market and not sure what these levels mean for your trades, feel free to DM us ; happy to break it down in plain English or share how I’m looking at it myself.
Mindbloome Exchange

USOIL TRADE IDEAhi all
USOIL has broken through the resistance level at 60.17 on the H4 timeframe. The current decline is likely a pullback. In my view, the 59.3–59.1 range presents a good opportunity to go long on USOIL
good luck all
**My trading strategy is not intended to be a signal. It's a process of learning about market structure and sharpening my trading my skills also for my trade journal**
Thanks a lot for your support
US OIL SUPPORT, RESISTANCE & TRENDLINE ANALYSISI hope whoever followed my levels must have been a great help for them.
Go "SHORT" if it breaks 60.46 along with the trendline with 60.07 as first target and breaking that might lead to 59.69 and breaking that as well might lead to 59.30
Go "LONG" if it breaks 60.46 with 60.85 as first target and breaking that might lead to 61.18 and breaking further might lead to 61.56 and if again if breaks and sustains then we might see a good move till 62.23


US oil US Oil is forming a bullish flag pattern. Entry will be taken on the breakout of the flag formation. The risk-to-reward ratio for this setup will be 1:1.

Oil Short (B)Oil inventories supply is high, indicating a fundamental bearish bias. By analyzing the technical trend of the market, oil is currently tested the first supply zone, warranting a short to the next demand zone. This setup is basic supply demand.

Capital.com: Crude Oil Sells US OIL Sell Setup – Bearish Structure
US Oil is showing signs of renewed bearish momentum after rejecting a key daily resistance zone. On the 1-hour timeframe, price has confirmed a lower high formation, followed by a decisive break below a key intraday support level—now acting as resistance. This shift in structure suggests potential continuation to the downside, with momentum favoring sellers as long as price remains below the reclaimed zone.
Technical Highlights:
Bearish structure confirmed on the 1H timeframe
Clean break and retest of structure
Momentum building for a potential push toward lower levels
Trade Setup:
Entry: 61.02
Stop Loss: 61.56
Target Levels:
Take Profit 1: 60.59
Take Profit 2: 56.34
This setup offers a favorable risk-to-reward ratio within a well-defined bearish structure. Wait for candle confirmation below resistance if not already in the trade, and always manage your risk according to your plan.
Drop your thoughts or questions below — and if you found this helpful, hit boost and follow for more structured US Oil trade ideas.
Stay sharp. Trade with precision. 🛢️📉

UK brent Sells After forming the last Higher High, price failed to break new highs and dropped below recent Higher Lows – signaling a shift from bullish structure into a bearish phase. Price is now in Correction, pulling back into a broken support area that may act as resistance. An imbalance left below adds confluence for a continuation lower. Waiting for a Lower High to confirm bearish Continuation in line with the higher timeframe downtrend.
The daily chart shows price reacting from a key supply area, adding strong higher-timeframe confluence. With imbalance below and structure now bearish, a confirmed Lower High would validate continuation to the downside
Entry: 61.230
Stop Loss: 62.130
Take Profit: 57.200


USOIL – Daily Rejection & 4H Bearish Engulfing: Short Setup from 💬 Trade Description:
Price on **USOIL** recently pushed into a **daily supply zone** around the **62.00 area**, which had previously acted as a strong rejection point.
On the **daily timeframe**, a **clear pin-bar rejection** formed, showing that buyers lost control and sellers are stepping back into the market.
Dropping down to the **4-hour timeframe**, price created a **bearish engulfing candle** directly inside that same daily supply zone — confirming a strong **shift in momentum** and offering a precise entry opportunity.
This setup aligns perfectly with the **higher-timeframe bearish structure**, where the market continues to print **lower highs and lower lows**.
The reaction from the 62.00 zone suggests a potential continuation to the downside as price seeks liquidity near the **next major demand zone around 57.00**.
⚙️ Trade Breakdown:
* **Weekly Bias:** Bearish — market creating lower highs.
* **Daily Confirmation:** Pin bar rejection from daily supply.
* **4H Entry Trigger:** Bearish engulfing after retest.
* **Entry:** After 4H candle close.
* **Stop Loss:** Above the 4H engulfing high.
* **Take Profit:** Targeting 57.00 (next demand zone).
---
## 🧩 Technical Insights:
* The **daily pin bar** served as higher-timeframe confirmation that sellers were defending a premium level.
* The **4H engulfing** offered an early confirmation of short-term structure shift.
* The **trade idea** follows a simple, high-probability model:
**“Daily confirmation → 4H execution → Patience for follow-through.”**
---
## 💭 Trader’s Note:
Patience was key on this one. I waited for the daily signal first before dropping to the 4H to catch the clean bearish momentum. This is how I’m structuring all my trades now — only executing when the higher-timeframe aligns with the lower-timeframe trigger.
Discipline > Frequency.
Quality > Quantity.

Crude oil review -DAILY- 27/10/2025Oil prices advanced as signs of progress in U.S.–China trade negotiations lifted market sentiment and improved the outlook for global energy demand. The easing of tariff threats and plans for a potential meeting between Presidents Trump and Xi have strengthened hopes for a trade deal, calming risk assets across markets. At the same time, U.S. sanctions targeting Russia’s largest oil producers added a modest geopolitical risk premium, providing further support to prices.
However, persistent concerns about oversupply remain, with OPEC+ members continuing to raise output, and weak demand projections weighing on sentiment. While optimism around trade is providing short-term support, the broader backdrop of abundant supply and sluggish consumption is likely to keep gains limited.
On the technical side, the crude oil price has corrected to the upside after finding support on the lower band of the Bollinger Bands, which are still quite expanded, indicating that there is sufficient volatility in the market to support any significant moves in the upcoming sessions. The 50-day SMA is still trading below the 100-day SMA, validating the overall bearish trend despite the recent bullish correction. The Stochastic is pushed near the extreme overbought levels, hinting that a bearish correction might be seen going forward, and if this scenario plays out, then the first area of support might be found around the $60 price mark, which is the psychological support of the round number as well as the 38.2% of the Fibonacci retracement level. In the event of a further move lower, the next support area might be seen around $58, which corresponds to the 23.6% Fibonacci level.
Disclaimer: The opinions in this article are personal to the writer and do not reflect those of Exness

Crude oil consolidates ahead of the FEDCrude oil had reached the 50-day moving average, driven by sanctions for Russia, and creating some bullish flow amid some short coverage, as open interest for crude oil futures has been declining steadily since October 15. The effect seems temporary, as the global record surplus expectations skew expectations for lower price levels.
Thus, we may expect some rotation around the achieved level with some volatility around it. One should be careful with upside breakouts, as they have greater odds to be false, unless any game changing news will reach the market.
Don't forget - this is just the idea, always do your own research and never forget to manage your risk!
