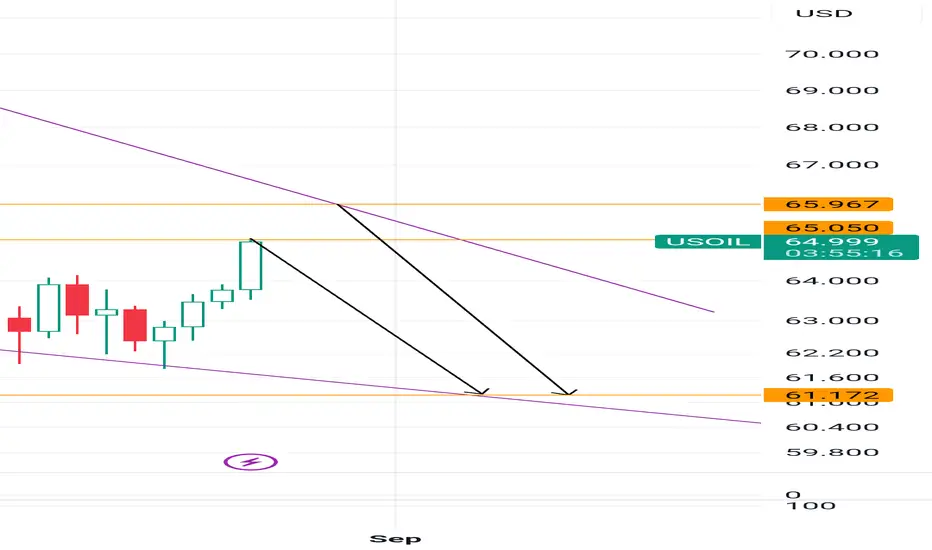
Potential bearish drop?WTI Oil (XTI/USD) has rejected off the pivot, which has been identified as a pullback resistance and could drop to the pullback support.
Pivot: 65.81
1st Support: 57.80
1st Resistance: 68.85
Disclaimer:
The above opinions given constitute general market commentary, and do not constitute the opinion or advice of IC Markets or any form of personal or investment advice.
Any opinions, news, research, analyses, prices, other information, or links to third-party sites contained on this website are provided on an "as-is" basis, are intended only to be informative, is not an advice nor a recommendation, nor research, or a record of our trading prices, or an offer of, or solicitation for a transaction in any financial instrument and thus should not be treated as such. The information provided does not involve any specific investment objectives, financial situation and needs of any specific person who may receive it. Please be aware, that past performance is not a reliable indicator of future performance and/or results. Past Performance or Forward-looking scenarios based upon the reasonable beliefs of the third-party provider are not a guarantee of future performance. Actual results may differ materially from those anticipated in forward-looking or past performance statements. IC Markets makes no representation or warranty and assumes no liability as to the accuracy or completeness of the information provided, nor any loss arising from any investment based on a recommendation, forecast or any information supplied by any third-party.
USOIL trade ideas

USOIL (WTI) Gann & Harmonic Pattern Points to Major Move!🛢️ 🛢️ USOIL (WTI CRUDE) Points to Major Move! ⚡ 📊
💹 Comprehensive Price Action Strategy | September 2025 Edition 🎯
📈 MARKET SNAPSHOT
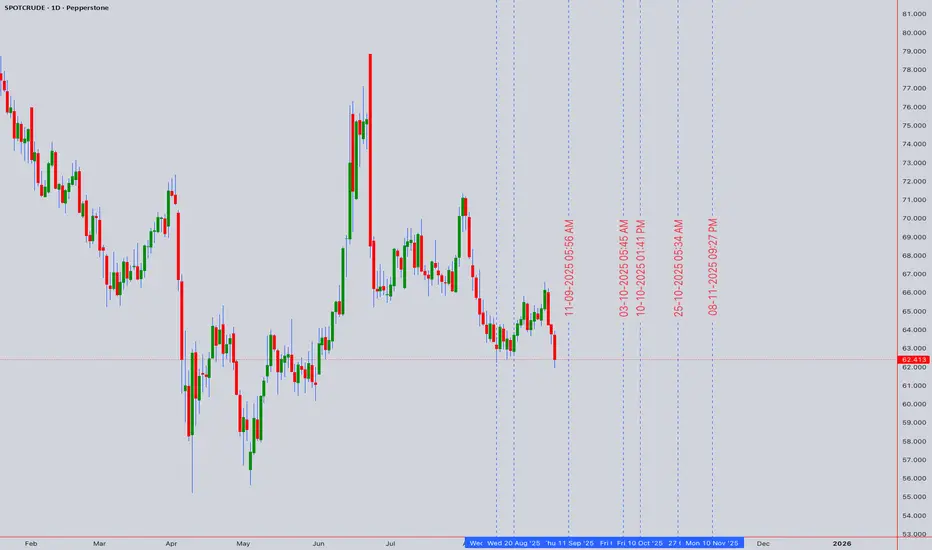
Asset: USOIL (SPOTCRUDE/WTI CASH)
Current Closing Price: $64.413
Date: September 6, 2025
Market Status: 🔴 Critical Support Zone Testing
🎯 EXECUTIVE SUMMARY
WTI Crude Oil is currently trading at $64.413, positioned at a crucial technical juncture. Our multi-timeframe analysis reveals a bearish-to-neutral bias with potential for a significant reversal if key support levels hold. The convergence of multiple technical indicators suggests heightened volatility ahead, presenting both risk and opportunity for astute traders.
📊 COMPREHENSIVE TECHNICAL ANALYSIS
🕯️ Candlestick Pattern Analysis
The recent price action has formed a Bullish Hammer pattern at the $64.00 psychological support level, suggesting potential exhaustion of selling pressure. This formation, combined with increasing volume, indicates possible accumulation phase initiation.
Key Patterns Identified:
- ✅ Bullish Hammer at support
- ⚠️ Evening Star formation on 4H chart
- 📍 Doji cluster indicating indecision
🌊 Elliott Wave Analysis
Current wave count suggests we're completing Wave 5 of a larger corrective structure:
Primary Count: Completing Wave C of ABC correction
Alternative Count: Wave 4 consolidation before final Wave 5 push
Target Zones:
- Bullish: $72.50-$74.00 (Wave 5 extension)
- Bearish: $58.00-$60.00 (Wave C completion)
📐 Harmonic Patterns
A Bullish Bat Pattern is forming on the daily timeframe:
- X: $78.45 (Recent High)
- A: $61.20 (Recent Low)
- B: $71.85 (0.618 Retracement)
- C: $64.41 (Current Price)
- D: $59.80-$60.50 (Projected - 0.886 XA)
Trading Implication: Watch for reversal signals near $60.00 for high-probability long entries.
🔄 Wyckoff Analysis
Current market structure suggests:
Phase: Potential Spring Test within Trading Range
Volume Analysis: Declining volume on recent decline = Lack of selling pressure
Smart Money Behavior: Accumulation signals emerging
Projected Move: Re-accumulation before markup phase
📊 W.D. Gann Analysis
Gann Square of 9 Calculations:
- Current Price: $64.413 sits on 225° angle
- Next Resistance: $68.00 (270° angle)
- Critical Support: $61.00 (180° angle)
Gann Time Cycles:
- September 15, 2025: Major time pivot ⏰
- September 22, 2025: Secondary cycle completion
Gann Fan Analysis:
- Price respecting 2x1 angle from July low
- Break above 1x1 angle at $66.50 signals trend change
☁️ Ichimoku Cloud Analysis
Current Position: Price below cloud - Bearish bias
Tenkan-sen: $65.80 (Immediate resistance)
Kijun-sen: $67.25 (Major resistance)
Cloud Support: $62.00-$63.50
Chikou Span: Bearish, below price 26 periods ago
📉 KEY TECHNICAL INDICATORS
📊 RSI (14-Period)
Current Reading: 42.5
Status: Approaching oversold territory
Divergence: Bullish divergence forming on 4H chart
Signal: Potential reversal zone approaching
📈 Bollinger Bands
Upper Band: $68.20
Middle Band (20 SMA): $65.85
Lower Band: $63.50
Current Position: Testing lower band
Volatility: Bands contracting - Breakout imminent
💹 VWAP Analysis
Daily VWAP: $64.85
Weekly Anchored VWAP: $66.20
Monthly VWAP: $67.50
Volume Profile POC: $65.00 (High volume node)
📊 Moving Averages Confluence
20 EMA: $65.85 ⬇️
50 SMA: $67.20 ⬇️
100 EMA: $69.50 ⬇️
200 SMA: $71.00 ⬇️
Status: Death cross on daily (50/200) - Bearish medium-term
🎯 TRADING STRATEGY
⚡ INTRADAY TRADING (5M-1H)
LONG SETUP 🟢
Entry Zone: $63.80-$64.20
Stop Loss: $63.40 (-1%)
Target 1: $64.80 (+1.5%)
Target 2: $65.40 (+2.5%)
Target 3: $66.00 (+3.5%)
Risk/Reward: 1:3.5
SHORT SETUP 🔴
Entry Zone: $65.60-$65.90
Stop Loss: $66.30 (-1%)
Target 1: $65.00 (-1.5%)
Target 2: $64.40 (-2.5%)
Target 3: $63.80 (-3.5%)
Risk/Reward: 1:3.5
📈 SWING TRADING (4H-DAILY)
BULLISH SCENARIO 🚀
Entry: $64.00-$64.50 (Current levels)
Stop Loss: $61.50 (-4%)
Target 1: $68.00 (+5.5%)
Target 2: $72.00 (+11.8%)
Target 3: $75.50 (+17.2%)
Position Size: 2% portfolio risk
BEARISH SCENARIO 📉
Entry: $65.80-$66.20 (Resistance retest)
Stop Loss: $67.50 (+2%)
Target 1: $62.00 (-6%)
Target 2: $59.50 (-10%)
Target 3: $57.00 (-14%)
Position Size: 1.5% portfolio risk
🗓️ WEEKLY FORECAST
Monday-Tuesday (Sept 9-10) 📅
- Expected Range: $63.50-$65.80
- Bias: Neutral with bullish undertone
- Key Level: Watch $64.00 support hold
Wednesday-Thursday (Sept 11-12) 📅
- Expected Range: $64.00-$67.00
- Bias: Potential breakout day
- Catalyst: EIA Inventory Data
Friday (Sept 13) 📅
- Expected Range: $65.00-$68.50
- Bias: Trend continuation
- Note: Options expiry volatility
🌍 MARKET CONTEXT & FUNDAMENTALS
Geopolitical Factors 🌐
- ⚠️ Middle East tensions supporting price floor
- 🇨🇳 China demand concerns capping upside
- 🇺🇸 SPR refill discussions providing support
Supply/Demand Dynamics ⚖️
- OPEC+ production cuts extended
- US shale production moderating
- Global inventory draws accelerating
Economic Indicators 📊
- Dollar Index weakening (Bullish for Oil)
- Global growth concerns (Bearish pressure)
- Inflation expectations rising (Supportive)
⚠️ RISK MANAGEMENT
Position Sizing Guidelines 💰
Intraday: Max 1-2% account risk per trade
Swing: Max 3-5% account risk per position
Correlation Risk: Monitor energy sector exposure
Stop Loss Strategies 🛡️
1. ATR-Based: 1.5x ATR from entry
2. Structure-Based: Below/above key S/R levels
3. Time-Based: Exit if no movement in 2-3 candles
Risk Factors ⚠️
- 🔴 Break below $61.50 invalidates bullish thesis
- 🔴 Unexpected OPEC+ policy changes
- 🔴 Rapid Dollar strengthening
- 🟢 Surprise inventory draws
- 🟢 Geopolitical escalation
🎯 KEY LEVELS TO WATCH
SUPPORT LEVELS 🟢
S1: $63.50 (Immediate)
S2: $61.50 (Critical)
S3: $59.00 (Major)
S4: $57.00 (Yearly Low)
RESISTANCE LEVELS 🔴
R1: $65.80 (Immediate)
R2: $67.25 (Daily 50MA)
R3: $69.50 (Daily 100MA)
R4: $72.00 (Major)
💡 PRO TRADING TIPS
1. 🎯 Best Entry Times: London/NY overlap (8-11 AM EST)
2. 📊 Volume Confirmation: Look for >20% above average
3. 🔄 Correlation Trades: Monitor USD/CAD inverse relationship
4. ⏰ Avoid Trading: 30 mins before/after EIA releases
5. 📈 Scale Strategy: Add to winners, not losers
🔮 MONTH-END PRICE TARGETS
September 2025 Projections:
Bullish Target: $72.00-$74.00 🎯
Base Case: $66.00-$68.00 📊
Bearish Target: $58.00-$60.00 📉
Probability Assessment:
- Bullish Scenario: 35% 📈
- Base Case: 45% ➡️
- Bearish Scenario: 20% 📉
📌 CONCLUSION & ACTION PLAN
USOIL presents a compelling risk/reward opportunity at current levels. The confluence of technical support at $64.00, combined with oversold conditions and potential harmonic pattern completion, suggests a tactical long position with tight risk management is warranted.
Recommended Strategy:
1. Primary: Accumulate long positions $63.50-$64.50
2. Alternative: Wait for breakout above $66.00 for momentum trades
3. Hedge: Consider put options if below $61.50
📝 TRADING CHECKLIST
Before entering any position:
- ✅ Confirm volume supports move
- ✅ Check RSI for divergences
- ✅ Verify multiple timeframe alignment
- ✅ Set stop loss before entry
- ✅ Calculate position size
- ✅ Review correlation with DXY
- ✅ Check economic calendar
- ✅ Assess market sentiment
🏷️ *Last Updated: September 6, 2025, 12:54 AM UTC+4*
🔔 Follow for daily updates and real-time trading signals!
For individuals seeking to enhance their trading abilities based on the analyses provided, I recommend exploring the mentoring program offered by Shunya Trade. (Website: shunya dot trade)
I would appreciate your feedback on this analysis, as it will serve as a valuable resource for future endeavors.
Sincerely,
Shunya.Trade
Website: shunya dot trade
⚠️Disclaimer: This post is intended solely for educational purposes and does not constitute investment advice, financial advice, or trading recommendations. The views expressed herein are derived from technical analysis and are shared for informational purposes only. The stock market inherently carries risks, including the potential for capital loss. Therefore, readers are strongly advised to exercise prudent judgment before making any investment decisions. We assume no liability for any actions taken based on this content. For personalized guidance, it is recommended to consult a certified financial advisor.
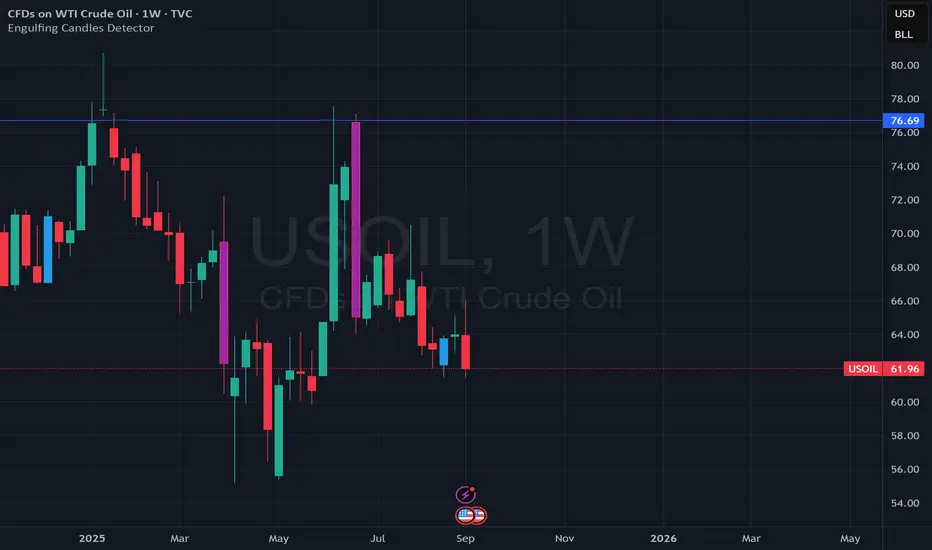
Bearish Engulfing Weekly For Oil Futures. Might be fair to target 60 or more on oil this next week. Since June oil does two bearish weeks in a row and last week was week number 1.
WTI 4HTrading Outlook for the Upcoming Week
In this series of analyses, we review trading perspectives and short-term outlooks.
As can be seen, in each analysis there is a key support/resistance zone near the current price of the asset. The market’s reaction to—or breakout from—this zone will determine the next price movement toward the specified levels.
Important Note: The purpose of these trading outlooks is to highlight key levels ahead of the price and the market’s potential reactions to them. The analyses provided are by no means trading signals!

Downtrend in oilCurrently, according to past analysis, the oil trend is still down, but we must wait for it to give us good and safe points to trade.

OILUSD – Testing 61.71, Next Support at 59.86WTI Crude extended its bearish move after rejecting the 64.57 resistance zone. Price is now testing the 61.71 support, and a breakdown here could open the way toward the 59.86 zone.
Support at: 61.71 / 59.86 🔽
Resistance at: 63.09 / 64.57 🔼
🔎 Bias:
🔽 Bearish: A clear break below 61.71 exposes 59.86 as the next target.
🔼 Bullish: Holding above 61.71 and reclaiming 63.09 would suggest a possible rebound toward 64.57.
📛 Disclaimer: This is not financial advice. Trade at your own risk.

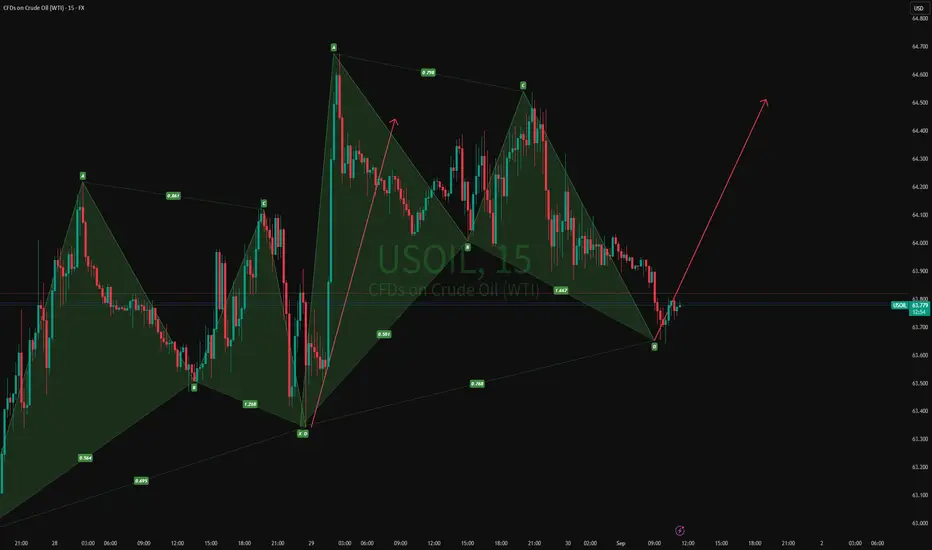
01-09-2025 USOIL The market is not always chaotic and disorderly, and there is a precise geometric beauty hidden in price fluctuations. The harmonic form long strategy is a powerful tool for accurately identifying potential market reversal points based on the Fibonacci ratio. When the form forms perfectly at the key support level, it often indicates the depletion of bearish momentum and the initiation of bullish trends.
As shown in the figure: 15M Bullish Bat
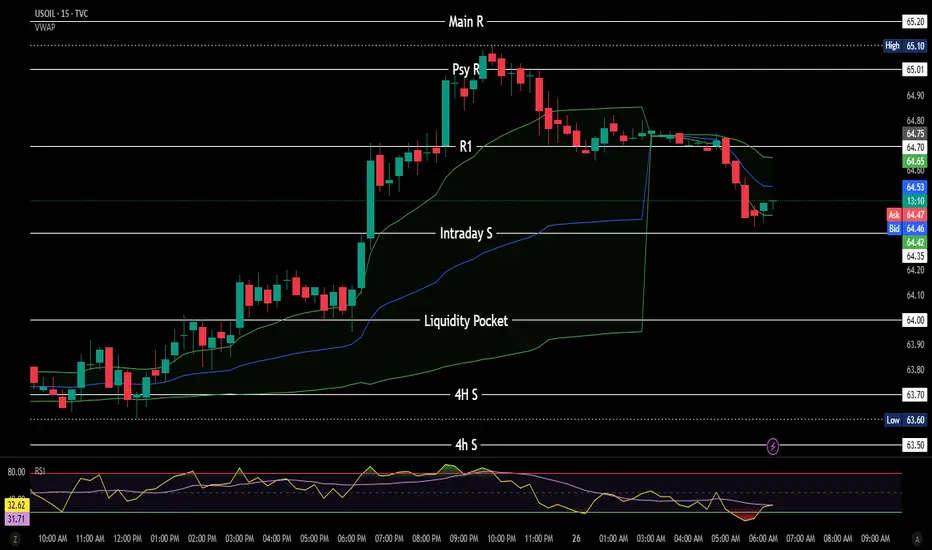
USOIL (WTI Crude) – Buy & Sell Trade Scenarios🔵 Bullish Scenario (Buy Call)
Entry Zone: Break and sustained close above 65.20 – 65.50 (current 4H resistance).
Reasoning:
Price has retested the 64.90 resistance cluster multiple times, suggesting absorption of supply.
Volume shows declining sell pressure near resistance – a sign of potential breakout.
A breakout with strong volume confirms buyers stepping in.
Target 1: 66.75 (measured move into next liquidity pool).
Target 2 (extended): 68.20 – 68.50 (previous structural pivot).
Stop Loss: Below 64.20 (false breakout protection).
R:R Potential: ~1:2.5 to 1:3
🔴 Bearish Scenario (Sell Call)
Entry Zone: Rejection at 65.00 – 65.50 resistance with bearish confirmation candle.
Reasoning:
This zone has acted as a strong supply area since mid-August.
Multiple wicks rejecting the level + increasing sell volume hint at distribution.
If price fails to close above resistance, sellers regain control.
Target 1: 63.00 – 63.20 (mid-support range).
Target 2 (extended): 62.00 – 61.90 (major support zone).
Stop Loss: Above 65.70 (wick protection).
R:R Potential: ~1:2 to 1:3
⚖️ Key Technical Takeaway
64.90 – 65.50 = Pivot zone (battle between bulls and bears).
Breakout + volume = bullish continuation to 66.75+.
Rejection + heavy volume = bearish rotation back to 62.95.

Crude holds range ahead of key OPEC+ MeetingOil prices steadied after falling in August, with West Texas Intermediate trading near $64. Markets remain pressured by oversupply concerns from OPEC+ and forecasts of a record surplus next year. Attention is on the Sept. 7 OPEC+ meeting, where restoring 1.65 million barrels a day of voluntary cuts will be debated. The US is pushing India to stop Russian oil imports, threatening secondary tariffs, while Prime Minister Modi defended ties with Moscow during a meeting with Putin in China, arguing Russian flows helped stabilize global prices. Despite some opportunistic US purchases, Indian refiners continue buying Russian crude. Meanwhile, hedge funds cut bullish bets on US crude to an 18-year low, reflecting oversupply fears and economic uncertainty.
On the technical side, the price of crude oil has been moving sideways last week and seems to be in the same situation this week if no major events take place. The combination of the 50 and 100-day simple moving averages, as well as the upper band of the Bollinger bands, is currently acting as the major resistance area around $65. TheBollinger bands are quite contracted, showing that volatility has dried up, further supporting the sideways movement in the upcoming sessions. The Stochastic oscillator is near the extreme overbought levels, but this has little to no significance since there is no volatility to support any major corrections. The Fibonacci levels are the short-term support area around $63, and the upper band of the sideways channel might be seen around $65, as mentioned.
Disclaimer: The opinions in this article are personal to the writer and do not reflect those of Exness

Crude oil retraces, but has a limited potentialCrude oil is moving in a technical upswing, transitioning to the cycle of retracement. The next resistance area would be located at around the $65-66 price area, as the downtrend is still intact. Volatility (ATR) for Crude oil has reached the level of March 2025: the lowest level of the year. That brings the beginning of either a broader breakout or a new wave of selling closer.
According to seasonal charts, Crude oil might get under pressure in October, while September usually delivers a sideways action, especially if there are no related drivers and navarres.
Don't forget - this is just the idea, always do your own research and never forget to manage your risk!

WTI 4HTrading Outlook for Major Currency Pairs and Indices, Especially Gold and Silver, in the Upcoming Week
In this series of analyses, we have reviewed short-term trading perspectives and market outlooks.
As can be seen, each analysis highlights a key support or resistance area near the current price of the asset. The market’s reaction to or break of these levels will determine the subsequent price trend up to the next specified levels.
Important Note: The purpose of these trading outlooks is to identify key price levels and potential market reactions, and the analyses provided should not be considered as trading signals.

CRUDE OIL Short From Resistance! Sell!
Hello,Traders!
CRUDE OIL made a retest
Of the horizontal resistance
Of 65.00$ from where
We are already seeing a
Bearish reaction and we
Will be expecting a
Further bearish move down
Sell!
Comment and subscribe to help us grow!
Check out other forecasts below too!
Disclosure: I am part of Trade Nation's Influencer program and receive a monthly fee for using their TradingView charts in my analysis.

US OIL LONG RESULT OIL price left a Good FVG and demand level during the pump to the upside and I patiently setup the long to catch the retracement and it moved perfectly as predicted.
_THE_KLASSIC_TRADER_.💪🔥

Crude oil strategy analysisCrude Oil News
The US S&P Global Composite PMI hit an eight-month high in August, prompting traders to reduce their bets on two Federal Reserve rate cuts this year. This eight-month high (assuming the initial composite PMI exceeds expectations) directly reflects the expansion of the US manufacturing and service sectors. This, coupled with increased activity in crude oil consumption scenarios like industrial production and freight logistics, provides substantial support for domestic crude oil demand. While this "reduced bet on rate cuts" may slightly strengthen the US dollar, the increased demand driven by economic resilience is more directly positive for crude oil.
The US and Europe have officially finalized the framework for their trade agreement. The implementation of the US-EU trade agreement will stimulate bilateral trade (e.g., increased cross-border transport of industrial and consumer goods). Increased air, sea, and road freight volumes will directly boost fuel demand. Furthermore, the agreement will drive industrial production expansion in both the US and Europe, increasing manufacturing energy consumption (including downstream crude oil products). This will improve global crude oil demand expectations and benefit oil prices.
Crude Oil Indicator Analysis
Oil prices have experienced a slight correction since yesterday's surge. While the MACD indicator has formed a golden cross and the red momentum bar has increased, it is still hovering near zero, indicating a volatile bull-bear equilibrium. Furthermore, the RSI is nearing overbought territory and is experiencing a pullback, suggesting that the 64.5 level is facing some pressure, suggesting further short-term declines.
Strategy
Previously, I suggested opening two short positions at resistance levels: one at 64.5 and then increasing the number of short positions near 65. The market peaked near 65, holding resistance, and the market gradually retreated, capturing all the profits. This was a very accurate prediction of this trend in crude oil.
As crude oil approaches 64, consider opening a bearish short position.

USOIL - OutlookAreas of interest marked on 4H.
If price drops to the discount zone, always wait for confirmation as it could go either way. (Momentum is our friend)
Avoid yellow zone.
Red zone speaks for itself, we do have EIA inventory data releasing later tonight. I would keep an eye on that for incoming volatility.
NFA


Crude oil prices are about to start fallingPreviously, market volatility increased due to news reports: Trump's direct dismissal of Federal Reserve Board Governor Tim Cook. This move undoubtedly undermined the Fed's independence. Historically, such incidents have undoubtedly put immeasurable pressure on currencies. The US dollar index plummeted in response, and gold prices followed a V-shaped trend, retracing to the 3351 level as expected and then rising to around 3386 before fluctuating and correcting. The current low is 3367, which is also the entry point for long positions we shared with you. This entry point can be entered twice, and both times it reached the target above 3380.
Crude oil fell rapidly from around 64.7, initiating a short-term correction today. The daily K-line has been rising for several consecutive days, indicating the need for a short-term correction.
Strategy
Open a short position if crude oil rebounds to 64.5. If it continues to rebound to around 65, increase the short position.
The target is around 63.

Crude Oil (WTI / USOIL) Technical AnalysisThe price of oil is currently in a downward trend on both the daily and hourly timeframes, and it is testing a support zone at $63.50.
🔹 Bearish Scenario:
If the price breaks the $63.50 support level and holds below it, we may see a target of $63.00.
🔹 Bullish Scenario:
If the price returns to break above $63.90 and holds, this could push the price toward $64.50 as an initial target, followed by a retest of $65.00.

ANALYSE US OIL us oil now on way to finish lawt wave
stopt loss : 64.332
target : 61.825
like and folow our profile for more free analyse forex crypto stocks future anything
note :for help or ask for the best place fore entre just inbox me

WTI Crude Awaits Breakout Amid Sanction RisksWTI Crude Oil – Overview
Oil Holds Steady on Fed Cut Bets and Sanction Risks
Oil prices are flat in early trade as markets weigh the likelihood of a U.S. Fed rate cut in September against potential disruptions to Russian crude flows. Brent trades at $67.18 (-0.1%), while WTI is steady at $63.64, following a 2.5% gain last week.
Fading optimism over a Russia–Ukraine summit and renewed U.S. tariff threats against India add to volatility. Markets are closely watching the Aug. 27 deadline, when secondary U.S. tariffs against India for Russian oil purchases are expected to take effect.
🔹 Technical Outlook
WTI is trading in bullish momentum as long as it holds above 63.47.
Price is likely to consolidate between 63.47 – 64.72 until a breakout.
✅ Above 64.72: Bullish continuation toward 65.83 → 67.20.
⚠️ Below 63.47: Bias turns bearish, targeting 61.83.
🔹 Key Levels
Support: 63.47 – 61.83
Resistance: 64.72 – 65.83 – 67.20
✅ Summary:
WTI crude remains range-bound but biased to the upside, supported by Fed cut expectations and geopolitical risks. A decisive break from the 63.47–64.72 range will set the next trend direction.

WTI Steadies as Rate-Cut Bets and Supply Risks CollideWTI Steadies as Rate-Cut Bets and Supply Risks Collide
WTI crude hovered around $64 on August 25, steady after last week’s gains as traders balanced U.S. rate-cut expectations with geopolitical risks. The Fed is seen 85% likely to cut rates in September, boosting demand outlooks.
Supply concerns persist after Washington threatened 50% tariffs on Indian imports over Russian oil purchases, while India signaled it will keep buying from Moscow. Stalled Russia-Ukraine talks and renewed attacks on energy infrastructure add to uncertainty.
