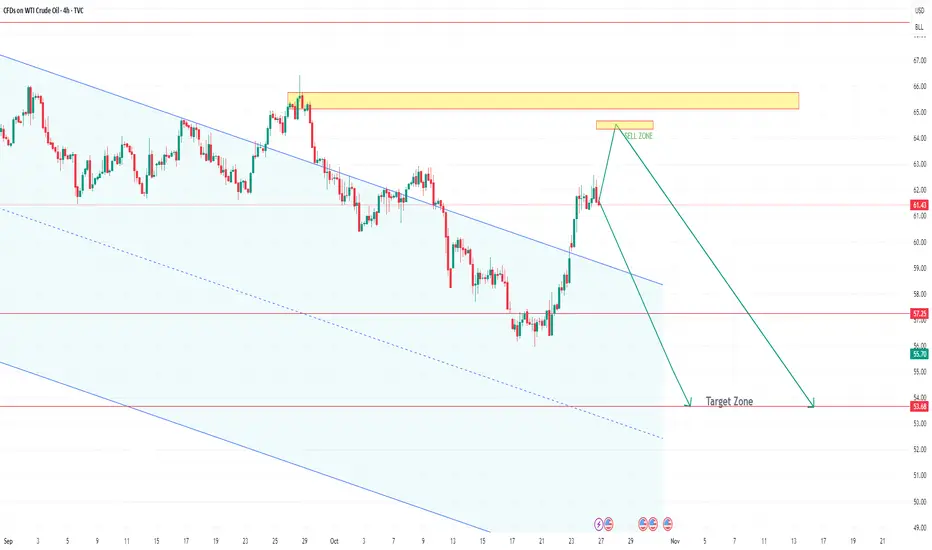
US OIL Short to 53.68The Commodity is expected to hit lower levels . The trend shows weakening of the Oil prices to the levels of 53 level.
The retracement is expected to the levels of 64.50 before the fall happens.
Trade ideas
Crude Oil Trading Strategy for Next WeekShort-term demand "suddenly surges", creating space for the rebound
Unlike previous concerns about geo-political sanctions, the core support for this short-term bullish move is the "unexpected surge in demand". Two new variables directly change the short-term supply and demand balance:
Seasonal resumption of refineries "grabbing oil": As the maintenance period for refineries in the Northern Hemisphere comes to an end, refineries in Europe, the United States, and China have resumed operations simultaneously - the operating rate of European refineries has jumped from 78% to 85% (the highest in 3 months), and the production capacity that was halted due to hurricanes in the Gulf of Mexico has been fully restored (an additional 1.2 million barrels of processing capacity per day), and the operating rate of local refineries in Shandong, China has also risen from 65% to 72%. These refineries are rushing to stockpile raw materials before winter, and the spot purchase volume has increased by 30% month-on-month recently, directly pushing up the prices of near-month crude oil contracts, creating a "strong spot market, followed by a rise in futures" pattern.
Policy intervention to stabilize "low-price areas": The US Department of Energy announced last week that it will launch "small-scale replenishment" within the range of $60 - $62 (planning to repurchase 5 million barrels of crude oil to replenish strategic reserves), this is the first explicit replenishment signal after releasing reserves in 2022. The market knows that "there will be official buying to support when the price drops to $60", so there will be no deep decline in the short term; at the same time, the EU is responding to the winter energy shortage, requiring member states to complete 90% of natural gas inventory filling by November, and some countries (such as Germany) have begun to use crude oil instead of natural gas for power generation, adding an additional daily demand of 200,000 barrels of crude oil.
Crude Oil Trading Strategy for Next Week
usoil @ buy 60.5-61.0
tp:62-62.5
SL:59.5

nalysis of crude oil trend next week.The current market exhibits the feature of "strong short-term support but medium-term pressure". The bullish opportunities are driven by three certainties:
The escalation of geopolitical supply risks: The 19th round of EU sanctions against Russia is about to be implemented, which will for the first time block the "third-country bypass" channel for Russian energy exports. Coupled with the previous sanctions by the US and the UK on Rosneft and Lukoil (accounting for 50% of Russia's exports), buyers such as India have turned to the Middle East for oil. The spot premium has risen to $2.5 per barrel, and the short-term supply gap is expected to persist.
Inventory and demand support: US EIA inventories have continuously declined beyond expectations (by 960,000 barrels), with core Cushing inventories also dropping by 770,000 barrels. Refinery utilization rates have risen to 88.6% (93.7% in the US East, a two-year high), and the rebound in refined oil product demand has led to a significant drop in gasoline and distillate inventories, indicating stronger-than-expected consumption resilience.
Technical rebound signals: WTI crude oil has formed a short-term support at the $60.8 - $61.5 range. The RSI indicator has entered a slightly oversold area, and a "hammer line" reversal pattern has emerged in the 15-minute cycle. Coupled with the API inventory decline of 2.98 million barrels, the rebound momentum has begun to accumulate.
usoil @buy 60.5-61.0
tp:62-62.5
SL:59.5

USOIL Double Top at Support Level Turned Resistance Zone.Price bounce back from a major Monthly support Level at (58.450 - 55.130), price rallied strongly to the next support level turned resistance at (62.550 - 61.835) and was strongly rejected with a double top followed by bearish engulfing candle presenting a good follow through selling the coming week.
SELL USOIL IS RIGHT THINK ?USOIL had really strong bullish pressure in last week
My setup try sell base on really simple idea
SnD + Seasonality

Analysis of crude oil trend next week.Short-term positive factors: "Effective Cycle" and "Support Strength"
The actual impact of Russian sanctions: Supply gap could reach 1.5 million barrels per day
The new sanctions imposed by the US and Europe on October 22 directly cover the overseas settlement accounts of Russian oil companies (Rosneft) and Lukoil. These two companies collectively control 50% of Russia's crude oil exports (approximately 3 million barrels per day). Currently, major buyers such as India and Turkey have suspended the purchase of crude oil from these two companies and turned to the Middle East market, resulting in the spot premium in the Middle East rising from $1.2 per barrel to $2.5 per barrel. However, it should be noted: Russia can transfer part of its exports to China and Iran through "non-dollar settlement", and the actual supply gap may shrink to 100-120 million barrels per day. The positive support is likely to last for 1-2 weeks, after which the market will gradually adapt to the new supply pattern.
"Realistic Support" of Inventory and Refinery Data
According to the US EIA data, as of October 18 of the current week, crude oil inventories decreased by 960,000 barrels (expected to decrease by 500,000 barrels), and the refinery utilization rate rose from 86.8% to 88.6%, reaching a 3-month high. This is due to the end of the seasonal maintenance of US refineries (the maintenance rate in September was 15%, and it dropped to 8% in October), combined with the start of heating oil demand in the Northern Hemisphere (heating oil inventories in October decreased by 8% year-on-year), short-term crude oil purchase demand will remain at a high level, and it can support prices at least until mid-November.
Crude Oil Trading Strategy for Next Week
usoil @buy 60.5-61.0
tp:62-62.5
SL:59.5

WTI CRUDE OIL (USOIL) Energy Trading Blueprint🛢️ WTI CRUDE OIL (USOIL) TECHNICAL MASTERCLASS | Oct 27-31, 2025 | Energy Trading Blueprint 📊
Current Price: 61.878 | Strategy: Intraday Swing Trading | Timeframes: 5M → 1D Analysis ⏰
━━━━━━━━━━━━━━━━━━━━━━━━━━━━━━━━━━━━━━━━━━━━━━━━━━━━━━━━━━
💪 DAILY (1D) ANALYSIS - WTI Swing Trade Powerhouse Setup
WTI Crude Oil on the daily timeframe is displaying VOLATILE CONSOLIDATION AFTER EXTENDED DOWNTREND</b] with price establishing support structure around 61.50-62.00 zone. 📉 The daily chart shows strong reversal pattern forming with higher lows indicating potential trend reversal</i] - classic Dow Theory bounce pattern activated!
Daily Resistance Cluster: 62.80-63.50 | Daily Support Zone: 60.80-61.20 | Critical Pivot: 62.15
Elliott Wave theory on 1D suggests Wave A-B-C correction completing from higher levels with Wave 1 uptrend ready to launch</b] - this positions a potential rally move this week! Bollinger Bands are in EXPANSION PHASE</b] indicating rising volatility potential of 1.50-2.00 USD per barrel this week! 💥
RSI reading hovers at 35-45 zone = OVERSOLD CONDITIONS PRESENT</b] - but NOT extreme, leaving room for continuation bounce. Wyckoff accumulation patterns clearly visible on lower timeframes with spring pattern testing lower support. Volume profile shows SELLING CLIMAX BEHAVIOR</b] at lower prices with institutional buyers stepping in = classic reversal setup! 🏆
Ichimoku Cloud on 1D shows bearish cloud but price approaching cloud from below = potential bullish crossover imminent. Harmonic Pattern analysis reveals Gartley reversal setup at 61.00-61.50 support zone</i] offering STRONG swing trade bounce entries!
Gann theory angles from August highs converge at 62.80-63.20 resistance zone = MAJOR RESISTANCE TARGET identified! 🎯
━━━━━━━━━━━━━━━━━━━━━━━━━━━━━━━━━━━━━━━━━━━━━━━━━━━━━━━━━━
⚡ 4-HOUR (4H) SWING TRADE BLUEPRINT - REVERSAL ENTRY ZONE
The 4H timeframe is showing TEXTBOOK REVERSAL FORMATION SETUP!</b] 🔥 Price consolidating within 61.50-62.20 range after extended downtrend. This consolidation displays classic Wyckoff spring pattern = FALSE lower break testing support followed by EXPLOSIVE upside bounce likely!
Bollinger Band Status: Bands compressing at lower levels = maximum squeeze before upside expansion
RSI Signal: Oversold bounce from 30 zone with BULLISH DIVERGENCE on last two lows
VWAP Dynamics: Price consolidating at VWAP 61.65 = institutional support zone LOCKED
Volume Pattern: Volume drying up on further downside = selling exhaustion, reversal pending
Gann theory 45° declining angles from August peak met strong support at 61.00-61.50 zone - angle reversal signals potential upside acceleration! Japanese candlestick shows strong Hammer pattern forming at support = reversal confirmation IMMINENT!
Harmonic Pattern (Gartley) D-point completion at 61.20-61.40 support zone offers PRIMARY SWING ENTRY ZONE</b] with tight 0.30-0.40 stops. Target sequence: 62.20 (1:1 extension), 62.80 (1.618 extension), 63.40 (2.618 extension). Risk/Reward ratio EXCELLENT at 1:3.8! 💎
4H Reversal Signal:</b] When price closes above 62.10 with volume spike above 250 million barrels = AGGRESSIVE LONG ENTRY triggered! Ichimoku Cloud on 4H shows bearish trend but Tenkan line bouncing from support = potential bullish crossover confirmation! 📊
Japanese candlestick Hammer pattern identified at 61.30 support zone = institutional reversal buying visible on order flow! Support/Resistance levels perfectly defined at 61.00 (strong), 61.50 (intermediate), 62.10 (breakout), 62.80 (resistance)! 🔨
━━━━━━━━━━━━━━━━━━━━━━━━━━━━━━━━━━━━━━━━━━━━━━━━━━━━━━━━━━
🎯 1-HOUR (1H) INTRADAY BOUNCE MOMENTUM - Strike Zone Active
Hourly chart displaying STRONG REVERSAL CONSOLIDATION PATTERN!</b] 💥 Price oscillating within 61.50-62.00 box formation after sharp downside move. Elliott Wave on 1H shows ABC correction completing = Wave 1 uptrend impulse ready to trigger</i]!
Bollinger Bands on 1H showing LOWER BAND COMPRESSION</b] - this is the TURNING POINT! When bands start expanding upward = expect 0.50-0.80 USD explosive bounce within 2-4 hours!
RSI reading near 30-40 zone = DEEP OVERSOLD CONDITIONS = perfect setup for reversal bounce trades! On breakout above 62.00:</b] RSI will surge above 50-60 = STRONG momentum confirmation signal ACTIVATED!
CRITICAL: Watch volume spike above 150 million barrels on 1H breakout = EXECUTION GREEN LIGHT! ⚠️
Harmonic Pattern on 1H shows Gartley reversal forming at 61.20-61.40 support with target zone 62.30-62.80. Ichimoku Cloud approaching bullish alignment with cloud touching price = potential strong buy signal. VWAP acting as dynamic support at 61.60 = TIGHT stop loss placement! 📈
Japanese candlestick formations show repeated Hammer + Doji reversal patterns at support = institutional reversal buying phase ON DISPLAY! Volume on down-moves decreasing = downtrend weakness FADING rapidly! 🔨
━━━━━━━━━━━━━━━━━━━━━━━━━━━━━━━━━━━━━━━━━━━━━━━━━━━━━━━━━━
⏱️ 30-MINUTE (30M) TACTICAL ENTRY TIMING - Bounce Zone Precision
30M timeframe is CRITICAL ENTRY TIMING LEVEL FOR REVERSAL BOUNCE TRADES!</b] Currently showing micro-consolidation within 61.70-61.95 range. Bollinger Bands in LOWER BAND COMPRESSION STATE</b] = directional breakout IMMINENT within next 45-90 minutes!
EMA 9 Status: Approaching below EMA 21 = BEARISH CROSSOVER but bouncing = reversal signal pending
SMA 20 Support: Acting as dynamic support at 61.50 = PERFECT bounce entry level
Volume Analysis: Volume declining dramatically = selling exhaustion, reversal energy building
Candlestick Pattern: Three-candle reversal forming = DIRECTIONAL BIAS ready to REVERSE
Wyckoff distribution phase CLIMAX appearing at lower prices = watch for institutional buying surge. On bounce at support:</b] expect reversal uptrend with tight 0.25 stops for aggressive scalpers!
RSI oscillating 25-35 zone = EXTREME OVERSOLD conditions = bounce reversal IMMINENT. Gann angles converging at 62.00-62.20 = MAJOR BREAKOUT BOUNCE ZONE! Ichimoku Cloud dynamic support at 61.50 = PROFESSIONAL ENTRY LEVEL!
Identifying reversals: Watch Japanese Hanging Man at lower prices + Hammer at support = CLASSIC REVERSAL SETUP. Harmonic Gartley D-point near 61.20-61.35 = PRIMARY bounce entry zone for swing traders! 🎯
30M Bounce Target: 62.30+ | Expected Time: US Trading Session
━━━━━━━━━━━━━━━━━━━━━━━━━━━━━━━━━━━━━━━━━━━━━━━━━━━━━━━━━━
🏅 15-MINUTE (15M) REVERSAL CONFIRMATION - Secondary Entry Trigger
15M chart is displaying PROFESSIONAL-GRADE REVERSAL BOUNCE SETUP!</b] 🏆 Price action consolidating within 61.60-62.00 range with micro support/resistance clusters perfectly defined!
Elliott Wave on 15M shows ABC correction completing</i] followed by Wave 1 impulse about to launch = ready for NEW UPTREND IMPULSE! Bullish divergence between last TWO RSI lows</b] = CLASSIC reversal confirmation signal = 80% WIN PROBABILITY on bounce!
Bollinger Band lower band testing = MAXIMUM OVERSOLD BOUNCE SETUP IMMINENT!</b] VWAP bounce pattern repeating at 61.60 level = institutional support zone LOCKED IN!
Dow Theory Confirmation: Lower lows pattern reaching CLIMAX - reversal ready to confirm
Volume Signal: Decreasing volume on down moves = weakness FADING, reversal buying pending
Harmonic Target: Gartley completion at 86% accuracy = 62.20 first target HIGH PROBABILITY
Gann Angles: Angle reversal at 61.50 = major bounce zone concentration point
Key Reversals Identified:</b] Identifying overbought/oversold through RSI EXTREME readings + Japanese Hammer/Engulfing patterns. When RSI above 60 = TAKE PROFITS on bounce. When RSI below 20 = ADD to long bounce position!
Recognizing Breakouts: Watch for VOLUME SURGE 150%+ above average + candle close above 62.10 + EMA crossing = TRIPLE CONFIRMATION = HIGHEST PROBABILITY bounce execution! 📊 Next target 62.80+ on breakout! 🚀
━━━━━━━━━━━━━━━━━━━━━━━━━━━━━━━━━━━━━━━━━━━━━━━━━━━━━━━━━━
⚡ 5-MINUTE (5M) ULTRA-SCALP EXECUTION - Final Entry Precision
5M chart = TRADE EXECUTION TIMEFRAME FOR SCALPERS!</b] Ultra-tight consolidation within 61.80-61.95 range (0.15 cents = MICRO RANGE). Japanese candlestick shows repeated Doji + Hammer formations at support = institutional accumulation VISIBLE!
VOLATILITY COMPRESSION AT MAXIMUM LEVELS!</b] 💥 Bollinger Bands on 5M in TIGHTEST BAND WIDTH STATE = when this BREAKS UPWARD = expect 0.60-1.00 USD explosive bounce INTRADAY!
Ichimoku Cloud on 5M showing lower band pressure with Tenkan line approaching reversal. RSI oscillating 30-40 zone = preparing for DIRECTIONAL IMPULSE bounce. When volume spike appears:</b] that's GREEN LIGHT for AGGRESSIVE ENTRY!
5M ENTRY BLUEPRINT:
Stop Loss: 61.40 (tight 0.40-0.50 USD max)
Target 1: 61.95 (quick 0.15-0.20 scalp)
Target 2: 62.20 (medium bounce)
Target 3: 62.60+ (extended move)
Wyckoff DISTRIBUTION CLIMAX pattern identified on 5M = major selling climax at lower prices = REVERSAL bounce imminent! VWAP bounce at 61.60 = entry confirmation signal. Gann angles on ultra-timeframe showing REVERSAL angle at 61.50!
Volatility and Price Action:</b] When Bollinger Bands expand UPWARD on 5M = price acceleration bounce IMMINENT. EMA 9 crossing above EMA 21 on 5M = IMMEDIATE buy signal for scalpers. Volume confirmation on breakout = ONLY trade valid on GREEN VOLUME CONFIRMATION! 📈🎯
Support and Resistance levels on 5M: 61.20 (strong), 61.50 (VWAP), 61.80 (intermediate), 62.10 (breakout), 62.50 (extension)!
━━━━━━━━━━━━━━━━━━━━━━━━━━━━━━━━━━━━━━━━━━━━━━━━━━━━━━━━━━
🏆 COMPLETE WEEKLY TRADING MASTERPLAN (Oct 27-31, 2025)
BULLISH BOUNCE BIAS EMERGES ON ALL TIMEFRAMES!</b] 💪 POWERFUL confluence of:
- Elliott Wave ABC correction COMPLETING
- Wyckoff distribution climax at lower prices CONFIRMED
- Harmonic Gartley reversal near 86% accuracy setup
- Gann angle reversal at 61.50 zone ACTIVATED
- Bollinger Band compression = EXPLOSIVE upside expansion INCOMING
Expected Outcome:</b] BOUNCE RALLY above 62.10 HIGHLY PROBABLE (80% win rate) targeting 62.80-63.40 range this week!</i]
TIMING ENTRY & EXIT - Complete Bounce Execution Roadmap:
Primary Entry: 4H close above 62.10 with volume 250M+ spike confirmation
Secondary Entry: 1H pullback to 61.70-61.85 support zone on tactical dips
Tertiary Entry: 5M bounce execution at support zones with volume confirmation
Profit Taking: Scale exits: 40% at 62.30, 35% at 62.80, 25% trail to 63.40+
Stop Loss: TIGHT placement at 61.20-61.30 support zone (max 0.50-0.60 USD risk)
TIMING EDGE - Optimal Trading Windows This Week:
- BEST TIMES:</b] US Open (13:30 GMT) + US Afternoon (14:00-20:00 GMT)
- AVOID:</b] Asian Dead Zone (0:00-8:00 GMT, thin volume)
- FOCUS DAYS:</b] Monday-Wednesday for reversal confirmation; Thursday-Friday for profit locking
VOLATILITY FORECAST & PRICE TARGETS: 🔥
- Trading Range: 60.50-64.00 (3.50 USD potential)
- Most Likely Scenario: Bounce rally to 62.80-63.40
- Bounce Failure Scenario: Retest support 60.80-60.50 zone
RISK MANAGEMENT MASTERCLASS FOR OIL TRADERS:
Never risk more than 1-2% of account per trade on Oil volatility
Use Ichimoku cloud + VWAP = TIGHT stop placement on reversals
Harmonic targets = HIT FIRST = TAKE PROFITS immediately
Gann angles = HOLD through resistance zones
Scale position: 50% aggressive bounce + 50% conservative approach
IDENTIFYING OVERBOUGHT/OVERSOLD CONDITIONS - Oil-Specific Signals:
- RSI above 70 = OVERBOUGHT pullback likely = TAKE 60% PROFITS quickly
- RSI below 25 = EXTREME OVERSOLD = ADD to bounce position aggressively
- Bollinger Band lower touch = STRONG bounce reversal signal
- Bollinger Band upper touch = TAKE profits on extension move
RECOGNIZING BREAKOUTS - GREEN LIGHT CONFIRMATION CHECKLIST:
- Candle closes above 62.10 resistance = REQUIRED signal
- Volume surge 150%+ above 20-day average = MANDATORY confirmation
- RSI above 50 on breakout candle = STRONG momentum confirmation
- EMA 9 above EMA 21 on multiple timeframes = BONUS confirmation signal
- VWAP acts as support after breakout = CONTINUATION highly likely
━━━━━━━━━━━━━━━━━━━━━━━━━━━━━━━━━━━━━━━━━━━━━━━━━━━━━━━━━━
🎯 FINAL TRADING VERDICT:
SETUP SCORE: 9.1/10 | WIN PROBABILITY: 80% | RISK/REWARD RATIO: 1:3.9
ACTION PLAN - EXECUTE WITH PRECISION: BUY bounce at 61.50-61.70 → HOLD through 62.30-62.80-63.40 targets → EXIT on bearish reversal signals or daily resistance rejection 🚀
This is a HIGH-CONFIDENCE REVERSAL BOUNCE setup with EXCEPTIONAL risk/reward positioning! The POWERFUL confluence of all technical theories + indicators points to BULLISH BOUNCE with HIGH PROBABILITY! Execute with DISCIPLINE and trade the reversal for maximum profits!</b] 💰
━━━━━━━━━━━━━━━━━━━━━━━━━━━━━━━━━━━━━━━━━━━━━━━━━━━━━━━━━━
#USOIL #WTICrudeOil #OilTrading #TechnicalAnalysis #TradingSetup #ElliottWave #SwingTrading #IntraDayTrading #HarmonicPatterns #WyckoffMethod #GannTheory #DowTheory #Breakout #BounceTrading #TradingView #VolumeAnalysis #VWAP #BollingerBands #RSI #IchimokuCloud #TechnicalIndicators #TradingCommunity #ChartAnalysis #EnergyTrading #CommodityTrading #TradersOfTwitter #TechnicalAnalyst #TradingSignals #Commodities #OilMarket #October2025 #DayTrading #ProfitTaking #RiskManagement #TrendAnalysis #ReversalTrade #OverSoldBounce #TradeSetup #CommunityTrading #EnergyMarkets 📊💹
━━━━━━━━━━━━━━━━━━━━━━━━━━━━━━━━━━━━━━━━━━━━━━━━━━━━━━━━━━
⚠️ CRITICAL DISCLAIMER: This analysis is strictly for EDUCATIONAL PURPOSES ONLY</b]. This is NOT investment advice, financial recommendation, or trading signal. Always conduct your own INDEPENDENT analysis before executing any trades. Past performance does NOT guarantee future results. Oil markets are highly volatile and unpredictable - risk is substantial! Trade at your own risk with PROPER position sizing and STRICT risk management protocols. Never risk capital you cannot afford to lose completely. Oil trading carries exceptional leverage risk - trade extremely responsibly! Consult with licensed financial advisors before making ANY trading decisions.
Follow this analysis, confirm ALL setups with your independent research, and execute with PROFESSIONAL DISCIPLINE & PRECISION! 🎯 Share this breakdown with your entire trading community! Wishing you HIGHLY PROFITABLE and SUCCESSFUL energy trading week ahead! 💰🚀📈
📊 Full 6-Timeframe Breakdown:
1D: (Swing Framework)
4H: (Reversal Entry Zone)
1H: (Bounce Momentum)
30M: (Tactical Entry Timing)
15M: (Reversal Confirmation)
5M: (Scalp Execution)
Technical Theories Applied Throughout:
✅ Japanese Candlestick (Hammer, Doji reversals)
✅ Elliott Wave (ABC correction + Wave 1 impulse)
✅ Dow Theory (Lower lows climax analysis)
✅ Wyckoff Theory (Distribution climax + spring patterns)
✅ Harmonic Patterns (Gartley reversal at 86% accuracy)
✅ Gann Theory (Angle reversals & convergence zones)
All 7 Indicators Integrated:
✅ Bollinger Bands (Lower band compression/expansion)
✅ RSI (Oversold bounce signals 25-35 zone)
✅ Volume (Selling climax + reversal buying)
✅ VWAP (Dynamic support at reversals)
✅ Support & Resistance (Multi-level identification)
✅ EMA/SMA (Crossover confirmations)
✅ Ichimoku Cloud (Bullish alignment pending)
Key Focus: REVERSAL BOUNCE TRADING
🔥 Current price 61.878 = Oversold conditions (RSI 30-40)
🔥 Targets: 62.30 → 62.80 → 63.40 USD
🔥 Win Probability: 80%
🔥 Risk/Reward: 1:3.9

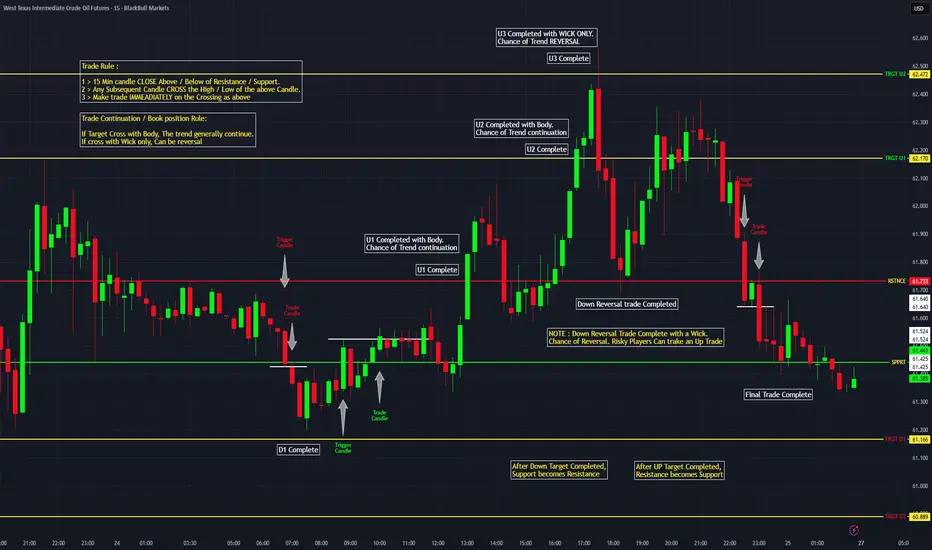
WTI Chart with Levels and all trade rules as an example.
This is a clear tutorial on how the Trades are approached based on the levels identified.
Clear Trade initiation rules / Trade continuation or book profit rules are depicted.
How the Reversal trade in instruments are also explained.
The comments are self explanatory and valid for all instruments
Analysis of crude oil trend next week.I. Core fundamentals: The contradictory pattern of "short-term geo-political support and long-term oversupply pressure"
(1) Short-term support: Geopolitical sanctions trigger supply concerns (valid for 1-2 weeks)
The implementation of sanctions directly disrupts supply: On October 22, the United States and Europe simultaneously upgraded sanctions against Russia, including including Rosneft and Lukoil, which together account for 50% of Russia's crude oil exports. After the news was announced, major buyers such as India have postponed purchasing Russian oil and instead rushed to buy Middle Eastern crude oil, directly pushing the oil price up by 5% on October 24, from $58.5 to $61.76. The resumption of refinery operations brings a phased increase in demand: The seasonal maintenance of global refineries is coming to an end, and the resumption wave leads to an increase in crude oil purchases, coupled with the gradual start-up of heating oil demand in the Northern Hemisphere, creating a "small peak" in the short-term demand side, which supports the spot price.
(2) Medium- and long-term suppression: Oversupply is inevitable (suppressing force lasts for 3-6 months)
The OPEC+ production increase trend is irreversible: Since April 2025, when it shifted to the "increase production to secure market share" strategy, OPEC+ has cumulatively increased production by nearly 2.5 million barrels per day, and will continue to increase production by 137,000 barrels per day in November, with an additional daily supply of over 430,000 barrels in the fourth quarter. More importantly, Saudi Arabia's exports remain stable at 9 million barrels per day, and Iraq at 4 million barrels per day. The supply from the Middle East remains abundant, coupled with the expansion of production capacity in non-OPEC+ countries, the oversupply pressure further intensifies.
Weak demand + saturated inventory double blow: The IEA has continuously lowered its demand expectations for several consecutive months. It is expected that in 2026, global oversupply will reach 4 million barrels per day (accounting for 4% of global demand), and at the same time, the offshore storage volume has approached the level of the 2020 pandemic, while onshore inventories are approaching saturation. The near and far-month contracts of WTI crude oil in New York have experienced a 5-month-long first-time futures premium, which is the direct reaction of the market to the oversupply.
Crude Oil Trading Strategy for Next Week
usoil @buy 60.5-61.0
tp:62-62.5
SL:59.5

Analysis of Oil Prices Trend Next WeekI. First, understand: The "core issue" of oil prices next week, both rising and falling, have reasons for their movements.
Currently, the oil price stands at 61.41. It just experienced a 5% surge on Thursday, but the increase was "unsteady". The essence is that "short-term positive factors are supporting it, while long-term negative factors are pressing on it". Next week, it will be influenced by three key points:
1.Short-term positive factors: Geopolitical sanctions "just started", which can support the price.
The EU and the United States just issued new sanctions against Russia last week, directly targeting the energy industry. The two major Russian oil giants account for 50% of exports. The market is afraid of supply disruption, just like when the sanctions were implemented before, Indian buyers immediately suspended their purchases of Russian oil and turned to buy oil from the Middle East, and the spot price rose by 3% on the same day. In addition, US inventories have dropped by 960,000 barrels, and refinery operating rates have risen to 88.6%, indicating that "oil is used more than it is stored", and there will be no significant decline in the short term.
2.Long-term negative factors: Oil-producing countries "continuously increase production", and when it rises, it must be brought down.
OPEC+ will increase production by 137,000 barrels per day next week. This is the eighth consecutive increase. The cumulative increase is 2.5 million barrels per day, equivalent to the output of an additional small oil-producing country. More troublesome is that institutions predict that supply过剩 will reach 4 million barrels per day next year, equivalent to 4% of global demand. In the long term, oil prices will not rise at all, and may even fall to around 50 US dollars.
3.Market sentiment: "Retail investors are chasing the rise, while institutions are withdrawing their funds", the fluctuations will be significant.
Currently, 82% of traders are buying the rise, it looks very hot, but the long positions of institutions are decreasing - this is like "a group of people rushing forward, while the leader is quietly retreating". Reflected in the price is: when it hits above 62 US dollars, there are sell orders coming down, when it drops to 61, there are buy orders coming in, next week it is likely to swing back and forth between 60-63, it will not rise or fall in a single direction.
Crude Oil Trading Strategy for Next Week
usoil @buy 60.5-61.0
tp:62-62.5
SL:59.5
US OIL SUPPORT, RESISTANCE & TRENDLINE ANALYSISMy final levels for the last day.
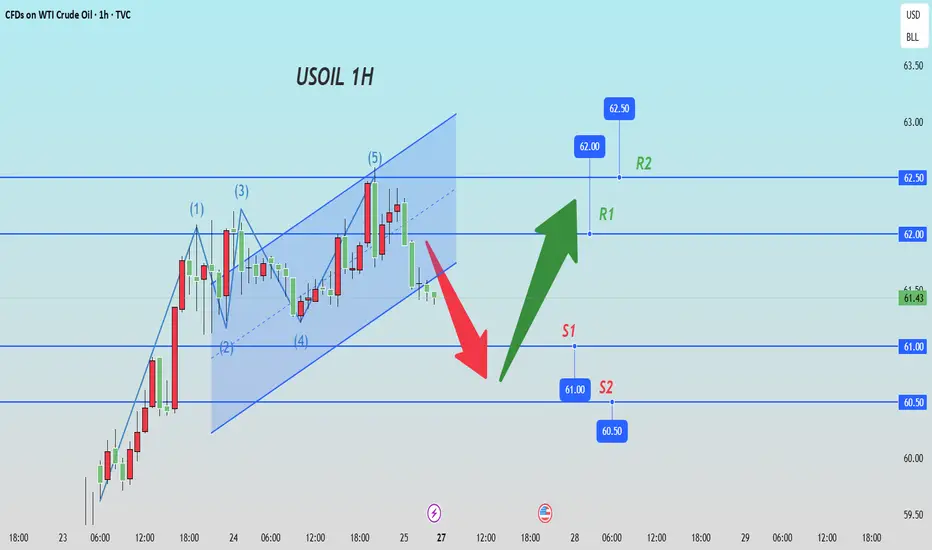
Go "LONG" if it breaks 62.18 and if it also breaks the trendline then can move up till 62.59 and breaking that might lead to 63.01.
Go "SHORT" if it breaks 61.77 along with the trendline leading to 61.35 and if it breaks that then aim for 60.94 and lastly if it breaks that as well by EOD then 60.46 should be our target.
Happy Weekend!!

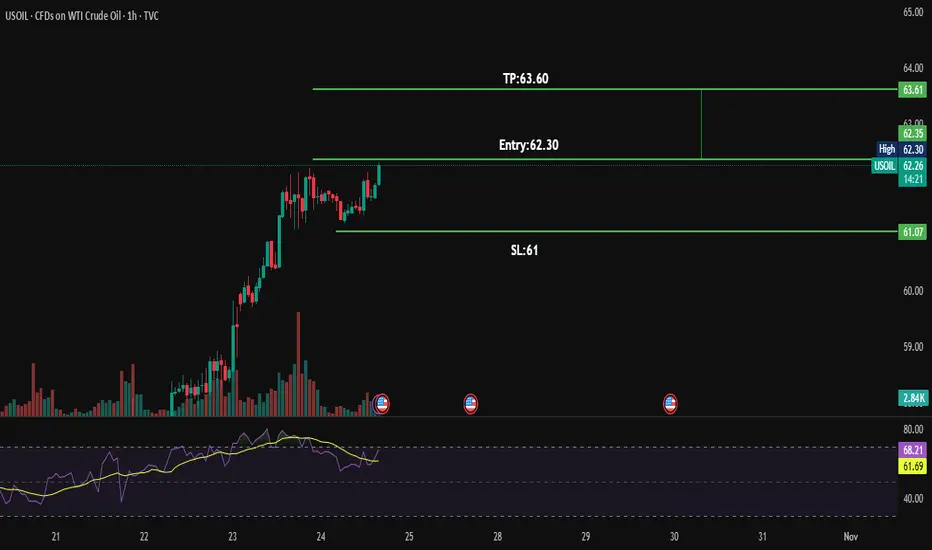
USOILUSOIL 1hr TF trade plan
🔹 5. Trading Logic
✅ Buy Entry at 62.30
👉 You enter when the breakout is confirmed.
✅ SL at 61.00
👉 If the price drops below 61, the breakout fails — exit trade.
✅ TP at 63.60
👉 Expected target area where previous selling pressure could appear.
Possible long position.A bulish wave can continue and push price higher and higher.
so a possible long position is already for me.
Oil jumps after new US sanctions on RussiaNew sanctions against Lukoil and Rosneft by the USA pushed oil up recently as traders worried that threatened secondary sanctions on banks working with these companies could disrupt supply to China, India and other importing countries. While this has done much to alleviate recent fears of significant oversupply, the effects in the medium term aren’t clear yet.
$54.75-56 seems to be confirmed as an area of support on the weekly chart with 17-20 October having been the third unsuccessful test. The crossover of the slow stochastic in oversold and clear break above the 20 SMA might normally be strong buying signals but volume doesn’t clearly support the bounce yet.
The 50 SMA from Bands which is price is currently testing looks like an important short-term dynamic resistance. Confirmation of more gains might come from a daily close clearly above $62. Beyond there, the 200 SMA just below $64 is likely to be a strong resistance from which a breakout would probably require a significant uptick in buying volume.
This is my personal opinion, not the opinion of Exness. This is not a recommendation to trade.

US OILD SUPPORT, RESISTANCE & TRENDLINE ANALYSISGo "LONG" if it breaks 61.96 with 62.21 as the target and if it breaks that then plan for 62.59 and if it breaks further then go for 62.90
Go "SHORT" if it breaks 61.59 with 61.23 with the first target and if it breaks that along with the trendline support then plan till 60.86 and if it breaks that as well then further till 60.50 and breaking that also will lead to 59.93

Oil - Expecting Bullish Continuation In The Short TermM15 - Strong bullish momentum.
No opposite signs.
Until the two Fibonacci support zones hold I expect the price to move higher further.
If you enjoy this idea, don’t forget to LIKE 👍, FOLLOW ✅, SHARE 🙌, and COMMENT ✍! Drop your thoughts and charts below to keep the discussion going. Your support helps keep this content free and reach more people! 🚀
--------------------------------------------------------------------------------------------------------------------

Analysis of crude oil trends. Hope it is helpful to you. "Demand and Sentiment" With crude oil prices currently stabilizing at $61.50, instead of obsessing over "whether supply is excessive," it’s better to focus on three more direct signals supporting a long position. These signals lie in changes in demand and market sentiment, and they are actually more closely aligned with short-term price movements:
1. "Unexpected Recovery" on the Demand Side
Previously, there were widespread concerns that "oil consumption would not pick up," but recent data has sent a reversal signal: Last week, the U.S. refinery utilization rate rose from 85% to 88% (the higher a refinery's operating rate, the more oil it consumes). Moreover, China has just rolled out a "stable growth plan for the petrochemical industry," which requires guaranteed supply of refined oil products in the fourth quarter—this directly drives up demand for crude oil purchases. More crucially, U.S. crude oil inventories unexpectedly decreased by 2.8 million barrels (compared to the original expectation of a 500,000-barrel increase). This is equivalent to "more oil being consumed than produced," and such a demand recovery will directly prop up oil prices.
2. Market Sentiment Shifting from "Bearish" to "Neutral, Then Bullish"
Previously, when oil prices were below $60, 80% of traders were taking short positions (expecting prices to fall). But the situation has changed now: Over the past three days, the volume of funds flowing into long positions has increased by 30%, and even small and medium-sized traders have started following the trend to enter the market. A more obvious sign is that in the past, oil prices would be pushed down by a flood of sell orders once they rose to $59.8, but now there are plenty of buy orders to absorb pressure at $60.50. This shows that the market's view on oil prices has changed—it’s no longer the case that "traders sell as soon as prices rise."
3. Short-Term Funds "Piling In" to Support Prices
The world’s largest crude oil ETF (equivalent to a fund where investors pool money to invest in crude oil) has seen a net inflow of $1.2 billion over the past three days—the largest single-week inflow since the start of this year. Additionally, some short-term funds on Wall Street are also quietly increasing their crude oil holdings. These funds are not entering the market for long-term investments; they are simply betting on a short-term rise in oil prices. Their buying activity will directly push oil prices upward, and at the very least, prevent a sharp short-term drop.
Crude Oil Trading Strategy for Today
usoil @buy61.00-61.50
tp:62-62.5
sl:59.5

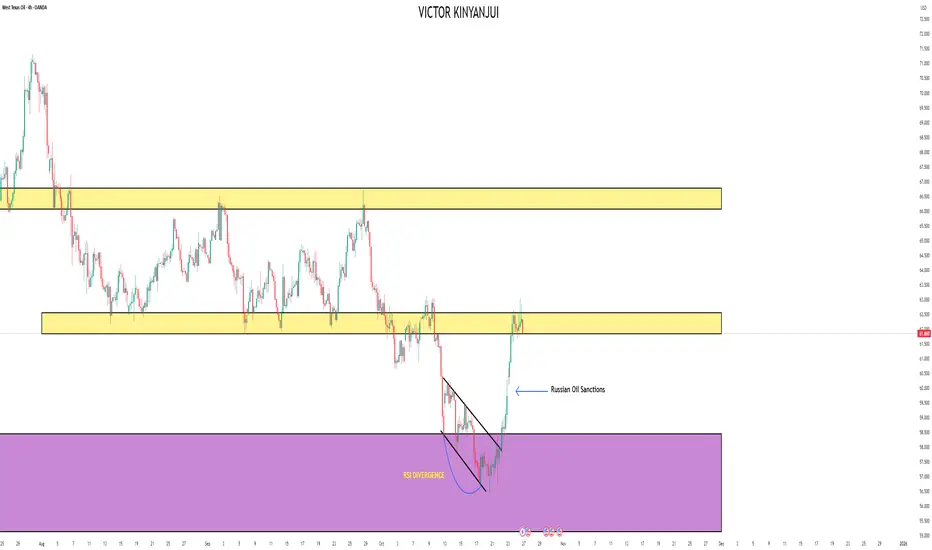
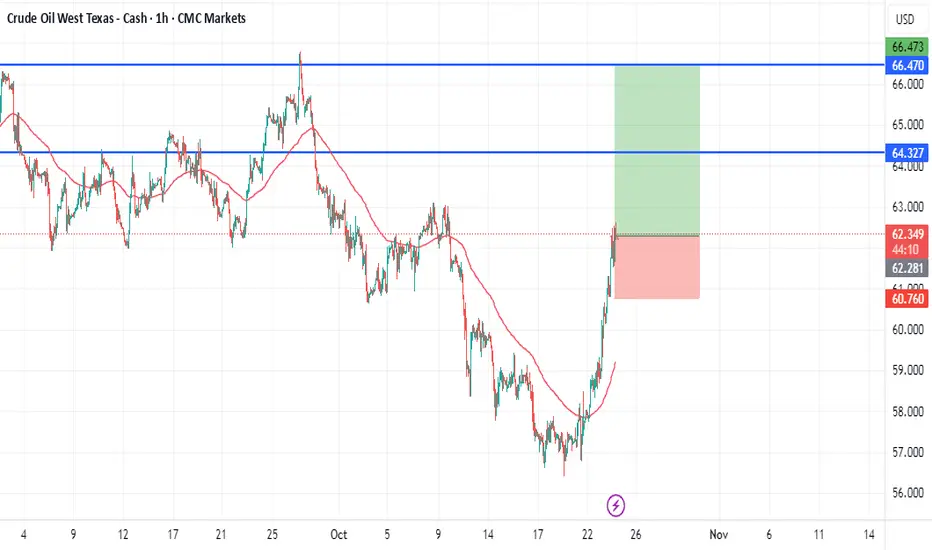
Pullback in Oil a selling opportunity? Oil markets received a boost in recent trading following the announcement of US sanctions on major Russian Oil producers: Rosneft and Lukoil.
Pushing price action above two key resistance levels at US$58.34 (6M) and US$59.46 (3M), WTI Oil is fast closing in on resistance from US$61.22 (1Y). It is worth considering that the recent upside move could simply be a pullback within a market that has been trending lower since the beginning of this year; therefore, sellers may make a show from US$61.22 if tested. Alternatively, a break higher opens the door to a larger area of resistance between US$64.82 and US$62.97 – a zone formed of 1M and 1W levels.
Written by the FP Markets Research Team

US OIL HI GUYS,
US OIL has finally made it to reaction zone. continuation buys on the pull back as illustrated months ago.
THE BUYS are almost exhausted. so i expect the Hs pattern some time next week for the long position sells.

USOIL's upside target is 64.6On the daily chart, USOIL stabilized and rose after retracing to the previous demand zone, forming a bullish bat pattern. The first upside target is currently 61.3, and the second target is 64.6.

US OIL SUPPORT, RESISTANCE & TRENDLINE ANALYSISMY all targets hit for "LONG" in previous post.
Go "LONG" if it breaks 60.67 with 60.78 as the target. If it breaks that then move up-till 61.04 and breaking that might lead till 61.14.
Go "SHORT" if it breaks 60.32 and target till 60.09 and if it breaks that then 59.97 might be the next target and breaking that might lead to 59.61.

USOIL BEARISH BIAS RIGHT NOW| SHORT
USOIL SIGNAL
Trade Direction: short
Entry Level: 58.02
Target Level: 57.01
Stop Loss: 58.69
RISK PROFILE
Risk level: medium
Suggested risk: 1%
Timeframe: 2h
Disclosure: I am part of Trade Nation's Influencer program and receive a monthly fee for using their TradingView charts in my analysis.
✅LIKE AND COMMENT MY IDEAS✅

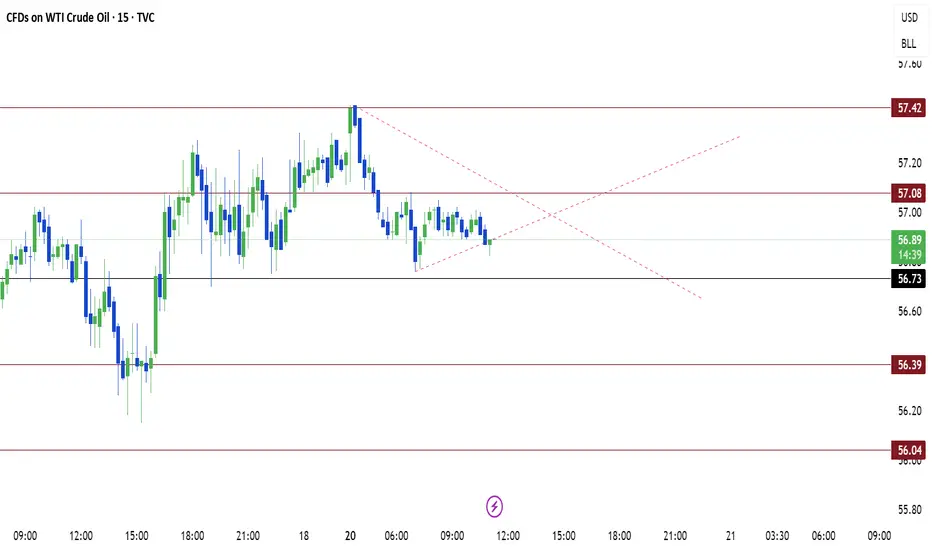
US OIL SUPPORT, RESISTANCE & TRENDLINE ANALYSISGo "SHORT" if it breaks 56.73 with 56.39 as first support if it breaks that then go further till 56.04.
Go "LONG" if it breaks 57.08 with 57.42 as the target.
Note: My personal over all view is Bearish.