Bull Run Stumbles: S&P 500 Heads Toward a Potential Correction After a rough day on Wall Street, the S&P 500 dropped about 1.2%, pulling U.S. markets lower. But there’s more behind this fall than just profit-taking.
What’s Really Happening?
Warning Signs from Wall Street
Two top banking leaders raised caution. Morgan Stanley’s Ted Pick expects a 10–15% correction, calling it a “healthy normalization.”
Goldman Sachs’ David Solomon warned that tech stocks are showing bubble-like behavior, with prices running much faster than earnings.
AI Boom Driving Market Concentration
The AI craze and tech optimism have made a few mega-cap companies dominate the market. In fact, just 10 big tech firms now make up nearly 40% of the S&P 500’s total value, making the market more fragile.
Fed Confusion Adds to Uncertainty
The Federal Reserve is sending mixed signals — some officials talk about possible rate cuts by December, while others say rates should stay high because the economy is still strong.
Adding to the mess, a partial U.S. government shutdown has delayed key data, leaving investors and the Fed guessing about what’s really happening in the economy.
What the Chart Reveals
From a technical standpoint, the U.S. market’s rally has been nothing short of extraordinary. Since the April bottom near 4,835, the index has soared nearly 42%, touching a recent peak around 6,920 — and even gained about 12–13% before the latest (April 2025) pullback began.
But now, the momentum seems to be fading. The chart is flashing early warning signals — RSI divergence suggests that while prices made new highs, the underlying strength (momentum) did not. That often hints at a potential trend reversal.
If this weakness deepens, the index could correct swiftly by around 10%, targeting the 6,200–6,100 zone. And if the “healthy normalization” predicted by Morgan Stanley’s Ted Pick (a 15% drop) plays out, the index might slide further to around 5,700 — a level that would reset valuations to more reasonable territory after the sharp run-up.
Valuation Check
Let’s set aside all the opinions and headlines for a moment and focus on the key valuation metrics that truly help us understand the real picture of the U.S. market.
The Price-to-Earnings (P/E) Ratio — The Market’s Mood Meter
P/E Ratio = Current Market Price/Earnings Per Share (EPS)
So, Current Market Price = P/E Ratio*EPS
Currently, the S&P 500’s P/E ratio stands at 30.8x, with an EPS of $222.5.
When you multiply the two — 30.8 × 222.5 = roughly $6,800 — it perfectly aligns with the index’s recent market level.
Now, to find out what the fair value of the market should be, let’s use the 5-year median P/E ratio, which is around 25.4x.
Fair Market Price = 25.4*222.5 = 6,650.
This aligns perfectly with the technical chart levels, suggesting that a 15% correction would be a healthy pullback to help cool down the overheated U.S. market.
The Buffett Indicator — Market Cap vs. GDP
One of Warren Buffett’s favorite valuation tools compares the total U.S. stock market capitalization to the country’s GDP — essentially measuring how large the market has grown relative to the real economy.
At present, this ratio stands at around 224%, far above the long-term fair value range of 100–120%. Even when compared to its 5-year median level of 192%, the market still appears significantly overvalued.
To return to its median level, the ratio would need to drop by roughly:
100 = 16.6%
That’s roughly a 15–16% correction, which again perfectly aligns with both the technical chart signals and Ted Pick’s projection of a healthy market normalization.
The Bottom Line
The U.S. market’s extraordinary rally has been built on a mix of AI optimism, liquidity hopes, and investor euphoria, but the fundamentals are starting to whisper caution.
Both valuation metrics and technical signals point to the same conclusion — the market is stretched, and a 10–15% correction wouldn’t be a disaster; it would be a return to balance.
History shows that every overheated bull run needs a pause — not to end the story, but to give it a stronger foundation.
So if the coming months bring some red on the screen, smart investors will see it not as fear, but as the market taking a deep breath before its next big move.
Trade ideas

Blockchain’s Role in Different Trading Segments1. Introduction: Redefining Trust in the Trading World
The modern trading ecosystem — spanning financial markets, commodities, forex, and digital assets — relies heavily on trust, transparency, and speed. For decades, intermediaries such as brokers, clearing houses, and central depositories have played a vital role in ensuring smooth settlements and recordkeeping. However, this system is often plagued by inefficiencies, high transaction costs, and occasional lapses in security or accountability.
Enter blockchain technology — a decentralized ledger system that offers immutable, transparent, and secure recordkeeping. By eliminating the need for traditional intermediaries, blockchain has the potential to revolutionize how trades are executed, verified, and settled across different segments of the global financial market.
Blockchain’s role in trading is not confined to cryptocurrencies. Its applications now extend to stock markets, commodity exchanges, forex trading, derivatives, and even carbon credit and energy trading. Each of these sectors can benefit from blockchain’s ability to automate trust and reduce systemic inefficiencies.
2. Understanding Blockchain in the Context of Trading
At its core, blockchain is a distributed database shared among a network of participants. Once data — such as trade details or payment confirmations — is recorded on the blockchain, it cannot be altered without the consensus of the network. This ensures that all trading participants operate from a single, verified source of truth.
In trading terms:
Each transaction (buy or sell order) is a “block.”
These transactions are chained together chronologically.
The system is decentralized, meaning no single entity can manipulate data.
This architecture has far-reaching implications for global markets:
Instant settlements instead of multi-day clearing cycles.
Elimination of counterparty risk, as smart contracts execute automatically.
Lower transaction costs due to reduced intermediary dependence.
Enhanced auditability, since all data is time-stamped and verifiable.
3. Blockchain in Stock Market Trading
The traditional equity trading system involves multiple intermediaries — brokers, stock exchanges, clearing corporations, and custodians — all performing specific functions such as matching orders, confirming trades, and settling securities. While effective, this system is slow and costly.
How Blockchain Transforms Stock Trading
Real-Time Settlement: Blockchain can reduce the settlement period from the current T+2 (trade date plus two days) to near-instantaneous settlement (T+0). This significantly reduces liquidity risk and capital lock-in.
Tokenization of Assets: Shares can be represented as digital tokens on a blockchain. This enables fractional ownership, making high-value stocks accessible to smaller investors.
Decentralized Exchange Platforms: Decentralized stock trading platforms can facilitate peer-to-peer transactions without intermediaries, ensuring transparency and reducing costs.
Immutable Recordkeeping: Corporate actions such as dividends, bonus issues, and stock splits can be recorded permanently and automatically distributed using smart contracts.
Examples
Nasdaq Linq: One of the early adopters of blockchain, Nasdaq used the Linq platform to record private securities transactions, demonstrating efficiency and transparency.
India’s NSE pilot programs: The National Stock Exchange of India has experimented with blockchain for know-your-customer (KYC) data and settlement tracking.
4. Blockchain in Forex (Foreign Exchange) Trading
The foreign exchange market is the world’s largest financial market, with daily volumes exceeding $7 trillion. Yet, it remains fragmented, opaque, and reliant on central intermediaries like banks and payment processors.
Blockchain’s Advantages in Forex
Cross-Border Settlement: Blockchain enables direct peer-to-peer currency exchange without intermediaries, drastically cutting transfer times and fees.
Transparency and Auditability: All trades recorded on a blockchain are verifiable, reducing manipulation and fraud risks.
Smart Contracts for FX Swaps: Automated execution of forex swaps and forward contracts ensures minimal counterparty risk.
24/7 Accessibility: Unlike traditional systems, blockchain-based FX networks can operate continuously without downtime.
Example
RippleNet and Stellar Lumens use blockchain to enable instant cross-border currency transfers with minimal costs, challenging the dominance of SWIFT.
5. Blockchain in Commodity Trading
Commodity trading — involving oil, metals, and agricultural goods — often suffers from documentation delays, supply chain opacity, and settlement inefficiencies. Blockchain brings trust and traceability to this sector.
Applications
Smart Contracts for Trade Settlement: Automatically execute trades once contractual conditions are met (e.g., delivery confirmation triggers payment).
Supply Chain Transparency: Blockchain can trace commodities from extraction or production to final sale, ensuring authenticity and sustainability.
Tokenization of Commodities: Commodities like gold, crude oil, or carbon credits can be represented digitally, making them easier to trade and fractionalize.
Reduction in Paperwork: Blockchain eliminates the need for multiple physical documents like bills of lading, inspection certificates, and letters of credit.
Example
Vakt, a blockchain-based platform supported by BP and Shell, digitizes the post-trade processes in oil markets, improving efficiency and reducing fraud.
6. Blockchain in Derivatives and Futures Markets
Derivatives — including futures, options, and swaps — are complex instruments often involving multiple intermediaries. Blockchain’s smart contracts can automate these trades and settlements with precision.
Benefits
Instantaneous Settlement: Reduces the time gap between contract execution and settlement, minimizing counterparty and liquidity risks.
Automated Margin Calls: Smart contracts can automatically adjust margin requirements based on real-time price movements.
Transparency: Blockchain’s shared ledger ensures all participants view the same data, reducing disputes.
Regulatory Compliance: Blockchain enables real-time reporting to regulators, improving oversight.
Example
DTCC (Depository Trust & Clearing Corporation), which handles trillions in derivatives, has explored blockchain for trade reporting and settlement to enhance efficiency.
7. Blockchain in Cryptocurrency Trading
Cryptocurrency trading is the first and most obvious area where blockchain has already established dominance. Cryptos like Bitcoin and Ethereum are themselves blockchain-native assets, and their trading happens entirely on blockchain-based exchanges.
Innovations
Decentralized Exchanges (DEXs): Platforms like Uniswap and PancakeSwap allow traders to exchange tokens directly from their wallets without intermediaries.
Liquidity Pools: Smart contracts automatically match buyers and sellers, ensuring market liquidity.
Transparency and Security: Every trade is publicly recorded on the blockchain, ensuring full auditability.
Challenges
High volatility, lack of regulation, and scalability limitations still pose obstacles to mainstream adoption.
8. Blockchain in Energy and Carbon Credit Trading
The rise of sustainability-focused finance has introduced new markets like carbon credits and renewable energy certificates. Blockchain ensures authenticity and prevents double-counting in these emerging asset classes.
Applications
Tokenized Energy Certificates: Renewable energy output (solar, wind, hydro) can be tokenized and traded on blockchain platforms.
Carbon Credit Trading: Blockchain ensures each credit is unique, traceable, and not resold multiple times.
Peer-to-Peer Energy Trading: Consumers with solar panels can directly sell surplus energy to others through blockchain-enabled microgrids.
Example
Power Ledger (Australia) uses blockchain to enable P2P renewable energy trading, giving consumers control over energy distribution and pricing.
9. Blockchain in Real Estate and Asset Tokenization
Although not traditionally viewed as a “trading” sector, real estate is rapidly evolving into a digital trading marketplace through blockchain tokenization.
Benefits
Fractional Ownership: High-value properties can be divided into digital tokens, allowing small investors to participate.
Instant Liquidity: Instead of lengthy paperwork, property tokens can be traded instantly on secondary markets.
Transparency and Authenticity: Land titles and ownership histories recorded on blockchain reduce fraud.
Example
Platforms like RealT and Propy are pioneering blockchain-based real estate trading with tokenized assets.
10. Blockchain’s Role in Regulatory Compliance and Risk Management
Beyond execution and settlement, blockchain plays a crucial role in compliance, auditing, and risk management.
Regulatory Advantages
Real-Time Monitoring: Regulators can access immutable records of trades in real-time.
KYC/AML Integration: Blockchain-based identity systems simplify customer verification while maintaining data privacy.
Reduced Fraud and Errors: Tamper-proof records and automated reconciliations enhance overall market integrity.
Example
The European Securities and Markets Authority (ESMA) has studied blockchain-based trade reporting to enhance transparency across the EU markets.
11. Challenges and Limitations
Despite its immense potential, blockchain adoption in trading faces practical and regulatory hurdles:
Scalability Issues: Large exchanges process millions of transactions daily; most blockchains still struggle with high throughput.
Regulatory Uncertainty: Many governments have yet to create clear frameworks for blockchain-based trading systems.
Integration Complexity: Legacy financial infrastructure is deeply entrenched, making transition costly and time-consuming.
Privacy Concerns: While transparency is valuable, full data visibility may conflict with confidentiality requirements in institutional trading.
Energy Consumption: Proof-of-work systems like Bitcoin consume significant power, though newer consensus models (e.g., proof-of-stake) are more efficient.
12. The Future of Blockchain in Global Trading
As the technology matures, blockchain is expected to become the backbone of next-generation trading infrastructure. The future may see:
Fully tokenized stock exchanges, where equities, bonds, and derivatives exist as digital assets.
Interoperable blockchains, allowing seamless transfers between different networks and asset classes.
AI and blockchain integration, combining data-driven trading strategies with transparent execution.
Central Bank Digital Currencies (CBDCs) simplifying settlement between global financial institutions.
The convergence of blockchain, AI, and IoT will lead to hyper-efficient, transparent, and inclusive trading ecosystems — reshaping how capital, commodities, and data flow across borders.
13. Conclusion
Blockchain’s entry into the trading world represents a paradigm shift — from trust-based intermediaries to trustless digital verification. Whether in stock markets, forex, commodities, or emerging asset classes like carbon credits, blockchain introduces unmatched levels of transparency, efficiency, and inclusiveness.
While challenges persist, the direction is clear: blockchain is not just a supporting technology; it is the new foundation of global trading architecture. The world’s markets are moving steadily toward an era where every trade, every asset, and every participant is digitally connected in a decentralized, verifiable, and borderless network of trust.
SPX500 | Consolidation Phase Before BreakoutSPX500 – MARKET OUTLOOK | Consolidation Phase Before Breakout 🇺🇸
The S&P 500 is consolidating between 6,918 and 6,879, as traders await the next breakout following recent Fed guidance and earnings results.
Above 6,918: Bullish continuation toward 6,941 → 6,991.
Below 6,879: Opens correction toward 6,842 → 6,770.
Pivot: 6,918
Support: 6,879 · 6,843 · 6,770
Resistance: 6,941 · 6,991
SPX500 remains range-bound, but a breakout from this zone will define the next trend direction.

SPX: Pulls back from the latest ATHThe Fed cut interest rates by 25 basis points, as widely expected, while US equity markets pulled back from recent all time highest levels. This could be a short summary of the previous week on the US markets. The higher volatility continued leading the sentiment toward the overbought side. The newest ATH for the S&P 500 was at 6.917, but the index is closing the week at 6.840. The market was not happy regarding Fed Chair Powell comments that the rate cut in December is not guaranteed. The US Government continues to be in a state of a “shutdown”, where the majority of important macro data are still not available to the public, so the investors are currently acting in a sort of "blindfolded" manner when it comes to macro data.
The S&P 500 slipped as two of its largest members, Meta Platforms and Microsoft, weighed on the market. Meta plunged about 12 % after forecasting significantly higher AI-capex next year, while Microsoft declined over 2 % following disclosure of nearly $35 billion in planned spending. Meanwhile, Alphabet bucked the trend with a gain of 5.5 % thanks to strong advertising and cloud revenue offering some bright spots amid tech weakness. Amazon surged around 9,6% after a strong quarter led by cloud growth. Tesla was also a weekly winner with around 3,7% gain.
Analysts are in agreement that higher volatility of the equity market could continue in the future period. Tech companies are currently strongly investing into AI adoption, with some estimates of $600 billion in capital spending already planned for the next year. This will be one of indicators that investors will be closely watching in the future, especially examining how this CAPEX spending is translating into rising AI-driven revenues for each company.

The Scariest Divergence In the MarketThe Scariest Divergence In the Market
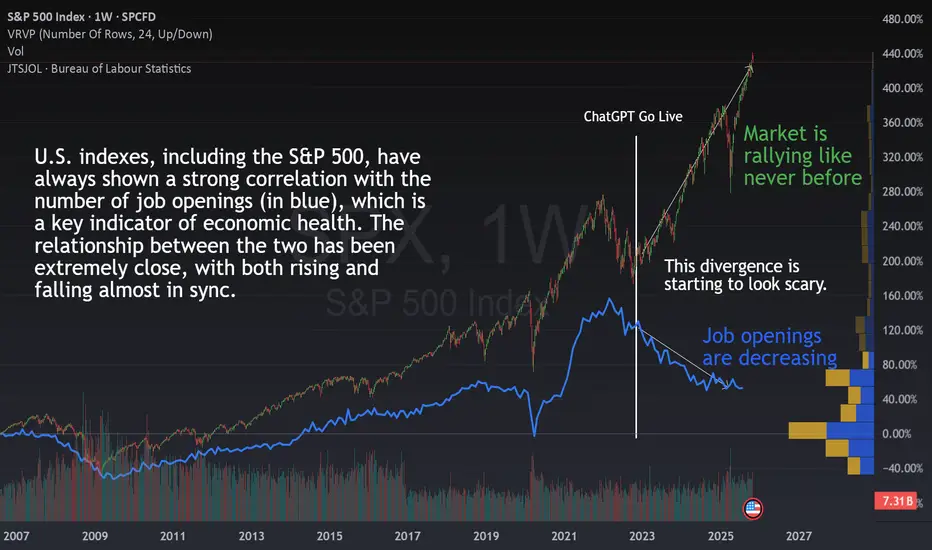
If you look at the chart, you’ll see the TVC:SPX (candles) and U.S. job openings (in blue) plotted together since 2001.
Historically, these two metrics have been highly correlated , both rising and falling almost in sync as the economy expanded or contracted.
But something changed dramatically in November 2022.
That’s when ChatGPT went live, marking the start of the AI boom that has reshaped entire industries and mindsets. From that point on, we can see a massive divergence, the kind we’ve never seen before.
While job openings have kept declining steadily, the market has rallied like never before. This is not logical from a historical point of view.
🤖 Is AI Replacing Workers?
One possible explanation is that the market sees AI as a reason for optimism:
“If companies can do more with less labor, that means higher margins and better efficiency.”
So, fewer job openings might not scare investors anymore, it could even be seen as a sign of progress.
But that raises two key questions:
Is AI really replacing workers ?
If so, what happens to the broader economy and ?
📊 What the Data Says So Far
Surprisingly, unemployment in the U.S. has increased only slightly since AI went mainstream.
It’s a slow, healthy rise not a surge. So i t doesn’t seem like AI is replacing workers at scale just yet.
That’s good news in one sense, if unemployment remains low, consumer demand stays healthy, and the economy keeps running.
However, it also means that companies’ fixed costs haven’t really improved, and their productivity gains from AI are still very moderate , far from the exponential growth that the market seems to be pricing in.
💡 My current View
From my perspective, this chart makes one thing very clear.
The benefits of AI , as of today, are still much smaller than what the market is assuming.
Yes, AI will improve margins and efficiency over time. But if everyone implements it, competition will eventually push prices down again, and margins with them. The very same than internet with the online sales.
The real challenge won’t be for companies that adopt AI, but for those that don’t adapt fast enough , or for those that overspend on AI tools that fail to deliver meaningful returns.
☄️Some AI Stocks Are Starting to Show Doubt
Several major AI-related stocks are also showing concerning patterns . We don’t have confirmation yet , but it’s time to stay alert and be prepared in case the market starts breaking key support levels among the main players.
And the main index, S&P 500 is still in the bull zone but are key levels to watch closely:
🤔 What Do You Think?
Is AI truly transforming company performance as fast as investors believe?
Or are we witnessing a global over-excitement where expectations are running far ahead of reality?
SP500The S&P 500 has been in a strong uptrend since 2023 continuing its long-term bull run.
Currently the index is testing a critical resistance zone near the top trendline and the Fibonacci 1.618 extension (6800 – 7000) an area where rallies often pause or correct.
This makes it a decisive moment for the market: a confirmed breakout above this level could signal further upside while a rejection may trigger a healthy correction before the next move higher.

SPX500 | Futures Steady Near Highs, Key Level 6,877 in FocusSPX500 – MARKET OUTLOOK | Futures Edge Higher as Earnings Season Heats Up 🇺🇸
U.S. stock futures inched higher on the first trading day of the month, as traders focus on a busy week of earnings across major sectors.
🔽 Below 6,877: Bearish momentum toward 6,842 → 6,800 → 6,770.
🔼 Above 6,888: Bullish reversal toward 6,918 → 6,941.
Pivot: 6,877
Support: 6,843 · 6,800 · 6,770
Resistance: 6,918 · 6,941
SPX500 remains bearish while below 6,877, though earnings results could trigger short-term volatility or a potential breakout.

SP500 Consolidated Bullish range because rebounded stronglyThe SP 500 is currently consolidating within a bullish range after price action recently tested key support levels and rebounded strongly. This suggests that buyers are defending the lower boundary of the range, maintaining the broader bullish momentum.
On Wednesday, U.S. equities gained, led by a rebound in technology-related shares. Additionally, U.S. private payrolls data came in stronger than expected, signalling continued labour market resilience and supporting investor sentiment. Meanwhile, the U.S. dollar extended its gains from last week, reflecting confidence in the U.S. economy.
If bullish momentum continues and the current support holds, we could see further upside potential, with the SP 500 possibly targeting the 6,900–6,980 range in the near term.
You may find more details in the chart.
Trade wisely best of Luck buddies.
Ps; Support with like and comments for better analysis Thanks for Supporting.

S&P500 INDEX | Bulls in Control Above 6,889 Ahead of Fed CutSPX500 – MARKET OVERVIEW | Bullish Momentum Builds Ahead of Fed Decision 🇺🇸
Barclays equity strategists believe stocks will continue their strong rally into year-end, despite some “pockets of froth.”
The Federal Reserve is widely expected to cut interest rates later today, with growing speculation it may also slow or end balance sheet reduction, further supporting risk assets.
Technically, the SPX500 has stabilized above 6,889, confirming bullish momentum and signaling potential continuation toward 6,941 and 6,991.
As long as the index trades above 6,889, the bias remains bullish.
However, to shift toward a bearish trend, the price would need to stabilize below 6,889, which could trigger a decline toward 6,842 and 6,755.
Key Technical Levels
Pivot Line: 6,889
Resistance: 6,941 · 6,991
Support: 6,843 · 6,760
Outlook:
SPX500 remains bullish above 6,889, supported by expectations of a Fed rate cut and year-end equity strength.
A confirmed break below 6,889 would shift momentum to bearish, targeting deeper corrections toward 6,842–6,755.

SPX - clear bullish signs ahead..SPX Has recently tested major support levels but struggled to break through below and bounced back up to the upside. The price also broke through the resistance trendline to the upside which is a major clear sign that SPX will be hitting the next upward target (fibonacci extension) shown on the chart

SPX500 - Biggest Weekly Loss as AI Valuations Face ScrutinySPX500 – MARKET OUTLOOK | Biggest Weekly Loss as AI Valuations Face Scrutiny 🇺🇸
The S&P 500 posted its largest weekly loss in weeks as investors questioned high AI stock valuations and shifted toward safer assets.
The index remains under bearish pressure while trading below 6,770, with momentum favoring further downside.
🔽 Below 6,770: Bearish continuation toward 6,705 → 6,670 → 6,610.
🔼 Above 6,782: Bullish correction toward 6,814 → 6,842.
Pivot Zone: 6,755–6,765
Support: 6,705 · 6,670 · 6,610
Resistance: 6,798 · 6,814 · 6,842
SPX500 remains bearish while below 6,770, but a confirmed 1H close above 6,782 could trigger a short-term recovery toward 6,814–6,842.

US 500 - Has All the Good News Been Priced?Concerns about excessive stock market valuations, especially when talking about AI focused companies, isn’t something new. In fact, it has been an on-going theme over the last 6 months of the year leading to bouts of risk aversion.
This was again the case late on Monday evening, and throughout the day yesterday when the earnings of Palantir Technologies were in the spotlight. The strange thing was that the earnings from this company, released after the close on Monday, beat analysts’ expectations, however a lack of clarity on future revenue needed to justify a market capitalisation of over $600 billion was what brought the latest concerns of an AI bubble back to the attention of traders, leading to a negative sentiment shift for the wider sector and the US 500 index in general.
Now, this may or may not be the start of a wider correction and much will depend on future risk events, price action and technical trends (more on this below), however the question for traders this time around is whether the positive news flow for US indices in the short term has already been priced? After all the US 500 index only hit a new record of 6925 on October 30th, 5 days ago.
November and December are historically strong performance months for the US 500, however currently traders are faced with several issues to navigate. Only a week ago the Federal Reserve cast some doubt over whether a rate cut in December would happen or not, with policymakers maintaining this stance in their comments at various events since then. This wasn’t expected and has led to some disappointment for traders which weighed on US 500 sentiment.
Q3 earnings have generally beaten expectations but then valuations were already high to reflect this, leading to some potential fatigue. Trade tensions between the US-China have cooled, but concerns still remain about economic growth in both countries, especially in the US, where a US government shutdown has led to the delay of key data releases such as CPI, retail sales and the all-important Non-farm Payrolls update on the current health of the US labour market, a key factor influencing the decision making of the Fed on potential interest rate cuts.
This means the release of today’s US ADP Private Payrolls data at 1315 GMT and the US ISM Services PMI survey at 1500 GMT could have a bigger influence over the direction of the US 500 moving across the week.
Technical levels and trends may also become increasingly important.
Technical Update: Back to Fibonacci Retracement Support
After reaching a new all-time high of 6925 on October 30th, the US 500 index has corrected by 2.9%, easing short-term overextended upside conditions. This pullback may reflect a healthy pause within a broader uptrend, but the question now appears to be whether this marks the extent of corrective downside moves or is the beginning of a phase of further price weakness.
As the chart below shows, latest declines in the US 500 index have now returned to a potential support zone at 6750/6760, marking the 38.2% Fibonacci retracement of the October 10th to 30th rally and the current level of the Bollinger mid-average. This possible support band may limit current declines, but closing behaviour around this area could be important in determining whether buyers can regain the upper hand or if deeper corrective risks can emerge.
Traders could now be watching this 6750/6760 support closely, as closing break below might see increased downside pressure. Such moves could then mean focus shifts to 6711, even 6661, marking the deeper 50% and 61.8% Fibonacci retracement levels.
That said, while the support is currently under pressure, the 6750/6760 range still holds on a closing basis and may help limit further selling pressure, even possibly see renewed attempts at price upside. However, traders may also now be monitoring 6825, equal to half the recent price decline, as a resistance level in the sessions ahead.
If momentum is to shift back toward attempts to renew price strength, a closing break above 6825 may be required to suggest scope to retest the 6925 October 30th all-time high.
The material provided here has not been prepared accordance with legal requirements designed to promote the independence of investment research and as such is considered to be a marketing communication. Whilst it is not subject to any prohibition on dealing ahead of the dissemination of investment research, we will not seek to take any advantage before providing it to our clients.
Pepperstone doesn’t represent that the material provided here is accurate, current or complete, and therefore shouldn’t be relied upon as such. The information, whether from a third party or not, isn’t to be considered as a recommendation; or an offer to buy or sell; or the solicitation of an offer to buy or sell any security, financial product or instrument; or to participate in any particular trading strategy. It does not take into account readers’ financial situation or investment objectives. We advise any readers of this content to seek their own advice. Without the approval of Pepperstone, reproduction or redistribution of this information isn’t permitted.

SPX: Bullish Exhaustion Signals a Short-Term PullbackThe TVC:SPX is currently showing signs of a potential short-term retracement after rejecting the 6,860–6,880 supply zone. The recent upswing into this zone lacked strong bullish momentum, suggesting that buyers are losing control. If price maintains below this resistance area, it could indicate the continuation of the short-term bearish structure.
The red zone marks a clear supply area where previous bullish attempts were absorbed, while the green zone below highlights a demand area between 6,740–6,770 — a potential target for sellers. A clean break below the recent intraday low would likely accelerate bearish momentum toward that zone.
Traders may look for confirmation from lower timeframes before shorting, as the broader structure still remains within a corrective phase after the prior rally.

SPX to 7450?Looking at the long term chart starting from the covid crash we can see 2 impulse of average 2650 pts and two retracement, so from the trump crash to 4800 we could see one last bullish impulse of around 2650 pts to target 7450 in autumn.
Now I expect a retracement to 5965-5970 area before last bullish impule

THE SPX (S&P500) IS HEADING UPWARDS! time to buyThe SPX has been stuck inside an upward channel for many weeks and has been bouncing between both support and resistance levels. It has recently broken through a powerful resistance zone which was holding it... which means it is now very likely to keep heading to the upside.

S&P 500: Overheated Valuation vs. SeasonalityAs the S&P 500 posts a Shiller CAPE ratio of 40.24 in early November 2025 — nearly equivalent to the dot-com bubble peak in 2000 (~44) — a key question arises: can the U.S. market still advance during the last two months of the year? History suggests that November and December seasonality often favors bulls, yet economic reality and valuation levels may temper this optimism.
Valuations on the Verge of Overheating
Fundamental indicators speak for themselves. A Shiller P/E around 40 signals extreme overvaluation; the historical average is around 17. The Buffett Indicator, which compares total market capitalization to GDP, exceeds 200% — an all-time high, well above levels seen before the 2000 and 2007 crises. In other words, U.S. equity prices are today largely disconnected from the size of the real economy.
Historical comparisons are striking: the market has only been this expensive on the eve of the tech crash twenty-five years ago. This makes any new bullish episode difficult to justify fundamentally. Yet history also shows that markets can remain overvalued for long periods, especially when liquidity is abundant and investors fear “missing out” on gains.
Seasonality: A Favorable Tailwind at Year-End
Statistically, November and December are the most favorable months for U.S. equities. According to Topdown Charts (1964–2024), November delivers an average return of +1%, positive in 69% of cases, while December rises +1.2% on average, gaining nearly 70% of the time.
Market Paradox: Expensive Yet Bullish?
This coexistence of extreme valuation and seasonal bullish momentum is not unprecedented. In 1999, for instance, the S&P 500 gained over 20% in the six months leading up to its historical peak, even though its CAPE exceeded 40. Investor psychology and flow dynamics often play a more significant role than fundamental reasoning in the short term.
However, such an environment reduces the margin of safety: any macroeconomic shock or earnings disappointment could trigger a sharp correction. History shows that markets can ignore excesses … until the moment they cannot.
Conclusion
The S&P 500 approaches the end of 2025 in a paradoxical situation: supported by historically favorable seasonality but in fundamental weightlessness. November and December could indeed be positive due to bullish inertia, liquidity effects, and collective psychology. Yet at these valuation levels, every additional point of gain also brings the market closer to an inflection point.
DISCLAIMER:
This content is intended for individuals who are familiar with financial markets and instruments and is for information purposes only. The presented idea (including market commentary, market data and observations) is not a work product of any research department of Swissquote or its affiliates. This material is intended to highlight market action and does not constitute investment, legal or tax advice. If you are a retail investor or lack experience in trading complex financial products, it is advisable to seek professional advice from licensed advisor before making any financial decisions.
This content is not intended to manipulate the market or encourage any specific financial behavior.
Swissquote makes no representation or warranty as to the quality, completeness, accuracy, comprehensiveness or non-infringement of such content. The views expressed are those of the consultant and are provided for educational purposes only. Any information provided relating to a product or market should not be construed as recommending an investment strategy or transaction. Past performance is not a guarantee of future results.
Swissquote and its employees and representatives shall in no event be held liable for any damages or losses arising directly or indirectly from decisions made on the basis of this content.
The use of any third-party brands or trademarks is for information only and does not imply endorsement by Swissquote, or that the trademark owner has authorised Swissquote to promote its products or services.
Swissquote is the marketing brand for the activities of Swissquote Bank Ltd (Switzerland) regulated by FINMA, Swissquote Capital Markets Limited regulated by CySEC (Cyprus), Swissquote Bank Europe SA (Luxembourg) regulated by the CSSF, Swissquote Ltd (UK) regulated by the FCA, Swissquote Financial Services (Malta) Ltd regulated by the Malta Financial Services Authority, Swissquote MEA Ltd. (UAE) regulated by the Dubai Financial Services Authority, Swissquote Pte Ltd (Singapore) regulated by the Monetary Authority of Singapore, Swissquote Asia Limited (Hong Kong) licensed by the Hong Kong Securities and Futures Commission (SFC) and Swissquote South Africa (Pty) Ltd supervised by the FSCA.
Products and services of Swissquote are only intended for those permitted to receive them under local law.
All investments carry a degree of risk. The risk of loss in trading or holding financial instruments can be substantial. The value of financial instruments, including but not limited to stocks, bonds, cryptocurrencies, and other assets, can fluctuate both upwards and downwards. There is a significant risk of financial loss when buying, selling, holding, staking, or investing in these instruments. SQBE makes no recommendations regarding any specific investment, transaction, or the use of any particular investment strategy.
CFDs are complex instruments and come with a high risk of losing money rapidly due to leverage. The vast majority of retail client accounts suffer capital losses when trading in CFDs. You should consider whether you understand how CFDs work and whether you can afford to take the high risk of losing your money.
Digital Assets are unregulated in most countries and consumer protection rules may not apply. As highly volatile speculative investments, Digital Assets are not suitable for investors without a high-risk tolerance. Make sure you understand each Digital Asset before you trade.
Cryptocurrencies are not considered legal tender in some jurisdictions and are subject to regulatory uncertainties.
The use of Internet-based systems can involve high risks, including, but not limited to, fraud, cyber-attacks, network and communication failures, as well as identity theft and phishing attacks related to crypto-assets.

What Is CPI and Why It Matters GloballyIntroduction: The Pulse of the Global Economy
In the complex world of economics, few indicators hold as much influence and significance as the Consumer Price Index (CPI). Whether it’s a policymaker setting interest rates, an investor predicting market movements, or an ordinary consumer noticing rising grocery bills, CPI plays a role in everyone’s financial life. It acts as a mirror reflecting changes in the cost of living and inflation, shaping everything from global monetary policies to household budgets.
Simply put, CPI measures how much prices have increased or decreased for a basket of goods and services that consumers typically buy. However, behind this simple concept lies a powerful tool that helps nations assess economic stability, business competitiveness, and the real purchasing power of their citizens.
Understanding CPI: The Basics
The Consumer Price Index (CPI) is an economic indicator that measures the average change in prices of a fixed basket of goods and services over time. This basket includes everyday items such as food, housing, clothing, healthcare, transportation, and education — essentially capturing the spending habits of urban consumers.
CPI as a Measure of Inflation
CPI is the most widely used tool to measure inflation — the general increase in prices and fall in the purchasing power of money.
When CPI rises steadily, it indicates inflation; when it falls, it suggests deflation.
Inflation can be both a sign of growth and a warning signal. Moderate inflation encourages spending and investment, as people prefer to buy now rather than later. But excessive inflation — as seen in countries like Argentina or Turkey in recent years — erodes savings, raises borrowing costs, and destabilizes economies.
Conversely, deflation (a sustained drop in prices) might sound appealing but can trigger economic stagnation. Falling prices reduce business revenues and wages, discouraging spending and investment.
Thus, tracking CPI helps governments strike a delicate balance between economic growth and price stability.
Types of CPI
Economists often use different versions of CPI to capture varied aspects of price changes:
Headline CPI:
This is the broadest measure, including all goods and services in the consumer basket. It reflects the overall inflation rate but can be volatile due to changes in food and energy prices.
Core CPI:
Excludes food and energy components, as they are prone to short-term fluctuations. Core CPI gives a clearer picture of long-term inflation trends.
CPI-W and CPI-U (in the U.S.):
CPI-W tracks the spending habits of urban wage earners and clerical workers.
CPI-U includes all urban consumers and is considered the official measure of inflation.
HICP (Harmonized Index of Consumer Prices):
Used by the European Union, this version allows for consistent inflation comparisons across member states.
Each variation of CPI serves a specific policy or analytical purpose, allowing economists to monitor inflation more accurately across different sectors and regions.
CPI and Global Monetary Policy
CPI plays a central role in shaping global monetary policy.
Central banks like the Federal Reserve (U.S.), European Central Bank (ECB), Bank of England, and the Reserve Bank of India (RBI) rely on CPI trends to make key decisions about interest rates and money supply.
When CPI shows rising inflation, central banks often raise interest rates to cool down spending and borrowing.
When CPI indicates deflation or weak inflation, they lower rates to stimulate economic activity.
For instance, during the COVID-19 pandemic, global CPI levels dropped as demand collapsed. Central banks responded with historically low interest rates and massive stimulus packages.
However, post-pandemic supply chain disruptions and energy shortages sent CPI soaring globally — prompting rapid interest rate hikes in 2022–2023.
These fluctuations show how closely CPI data influences global financial stability, currency values, and investment decisions.
CPI and Purchasing Power
CPI also helps determine changes in purchasing power — how much goods and services a unit of currency can buy.
If wages rise slower than CPI, real income effectively decreases, meaning consumers can buy less with the same money.
For example:
If CPI rises by 6%, but wages increase by only 3%, then real wages have fallen by 3%.
This erosion in purchasing power can reduce consumer confidence and spending — key drivers of economic growth.
Governments and labor unions often use CPI data to adjust wages, pensions, and social benefits (a process called indexation) to maintain people’s living standards.
CPI as a Global Benchmark
CPI data is not just a domestic concern — it has international ramifications.
Global investors, financial institutions, and multinational corporations all monitor CPI across different countries to assess economic health and currency risks.
Here’s how:
Exchange Rates:
High inflation (rising CPI) typically weakens a nation’s currency because it erodes purchasing power. Investors may move money to countries with lower inflation and higher returns, affecting foreign exchange markets.
Investment Flows:
CPI trends help guide foreign direct investment (FDI) and portfolio investment decisions. For instance, a stable CPI and moderate inflation attract investors seeking predictable returns.
Trade Competitiveness:
Countries with lower inflation maintain price stability in exports, making their goods more competitive globally. Conversely, high CPI growth can make exports expensive and hurt trade balances.
Thus, CPI serves as a universal barometer for comparing economic conditions across nations.
CPI and the Financial Markets
The stock market, bond market, and commodity markets react strongly to CPI reports.
Traders and investors treat CPI announcements as key economic events because they directly influence interest rate expectations and corporate profitability.
Equity Markets:
Rising CPI may hurt company profits by increasing input costs. However, certain sectors — like energy, commodities, and consumer staples — often benefit during inflationary periods.
Bond Markets:
Bonds are highly sensitive to inflation. When CPI rises, bond yields increase because investors demand higher returns to offset the loss of purchasing power. This inversely affects bond prices.
Commodity Markets:
Commodities such as gold and crude oil often act as inflation hedges. A high CPI can push investors toward tangible assets that retain value when currencies lose purchasing power.
Thus, CPI data can trigger short-term volatility and long-term investment strategy shifts across asset classes.
Limitations of CPI
While CPI is an essential tool, it’s not without flaws. Economists often debate its accuracy and representativeness due to several factors:
Substitution Bias:
Consumers tend to switch to cheaper alternatives when prices rise, but CPI assumes a fixed basket — overstating inflation.
Quality Adjustments:
Technological improvements often increase product quality (e.g., smartphones), but CPI may not fully capture this added value.
Geographical Variations:
Price changes differ between regions. Urban CPI may not accurately reflect rural cost-of-living changes.
Lagging Indicator:
CPI measures inflation after it has occurred, meaning policymakers are often reacting to past data.
Exclusion of Certain Costs:
CPI may exclude investment assets like real estate or stocks, even though they significantly affect household wealth.
Despite these limitations, CPI remains the most reliable and widely accepted inflation measure because of its consistency and comparability.
Case Studies: CPI in Action
1. United States: Inflation and Federal Reserve Policy
In 2022, U.S. CPI surged above 9%, the highest in four decades. Rising food, fuel, and housing costs prompted the Federal Reserve to raise interest rates aggressively throughout 2022–2023. This decision cooled inflation but also slowed economic growth and rattled stock markets.
It showcased how CPI data can reshape monetary strategy and ripple through global markets.
2. India: Balancing Growth and Inflation
India’s CPI basket is heavily weighted toward food and housing. When food prices rise due to poor monsoon or supply shortages, CPI spikes quickly.
The RBI uses CPI as its main inflation target, aiming to keep it between 2–6%. By adjusting repo rates based on CPI trends, the RBI manages both growth and price stability.
3. Eurozone: The Battle with Deflation and Energy Prices
For years, the Eurozone struggled with low inflation and deflation risks, prompting the ECB to maintain ultra-low interest rates. However, after the Ukraine conflict in 2022, energy-driven CPI spikes forced the ECB to tighten policy sharply.
This swing illustrated CPI’s impact on regional economic integration and fiscal coordination.
CPI in the Context of Global Challenges
Today’s world faces unprecedented inflationary pressures due to factors like:
Geopolitical conflicts (e.g., Russia–Ukraine)
Supply chain disruptions
Energy market volatility
Climate change impacting agriculture
Post-pandemic demand surges
As a result, global CPI data has become a critical early warning system for potential recessions, stagflation, or monetary tightening cycles.
International institutions such as the IMF and World Bank rely on CPI trends to forecast global growth and recommend policy adjustments.
Future of CPI: Adapting to a Changing Economy
As consumption habits evolve, CPI calculations must also adapt. The rise of digital goods, subscription services, and AI-driven economies is reshaping how statisticians define the “consumer basket.”
Future CPI methodologies may include:
Real-time price tracking using big data and AI
Regional CPI dashboards for urban and rural contrasts
Inclusion of environmental costs and green inflation (the impact of climate policies on prices)
Better adjustments for technological improvements
Such innovations will make CPI a more accurate, dynamic, and inclusive measure of global inflation.
Conclusion: The Global Significance of CPI
The Consumer Price Index is more than just a number; it is the heartbeat of the world economy. It influences how central banks set interest rates, how investors allocate capital, how governments plan budgets, and how families manage their daily expenses.
Understanding CPI is crucial not only for economists but for anyone navigating an interconnected global economy. Whether inflation is surging or stabilizing, CPI tells the story of how value, consumption, and confidence move together in shaping our economic future.
In a world of shifting trade patterns, volatile energy markets, and evolving digital economies, CPI remains the compass that helps policymakers, businesses, and citizens alike find direction amid economic uncertainty.

SPX500 H1 | Bullish Bounce OffS&P500 has bounced off the buy entry at 6,839.32, which is a pullback support that aligns with the 23.6% Fibonacci retracement and could rise from this level to the take profit.
Stop loss is at 6,793.88, which is a pullback support that lines up with the 50% Fibonacci retracement.
Take profit is at 6,926.57, which s a swing high resistance.
Stratos Markets Limited (tradu.com ):
CFDs are complex instruments and come with a high risk of losing money rapidly due to leverage. 68% of retail investor accounts lose money when trading CFDs with this provider. You should consider whether you understand how CFDs work and whether you can afford to take the high risk of losing your money.
Stratos Europe Ltd (tradu.com ):
CFDs are complex instruments and come with a high risk of losing money rapidly due to leverage. 70% of retail investor accounts lose money when trading CFDs with this provider. You should consider whether you understand how CFDs work and whether you can afford to take the high risk of losing your money.

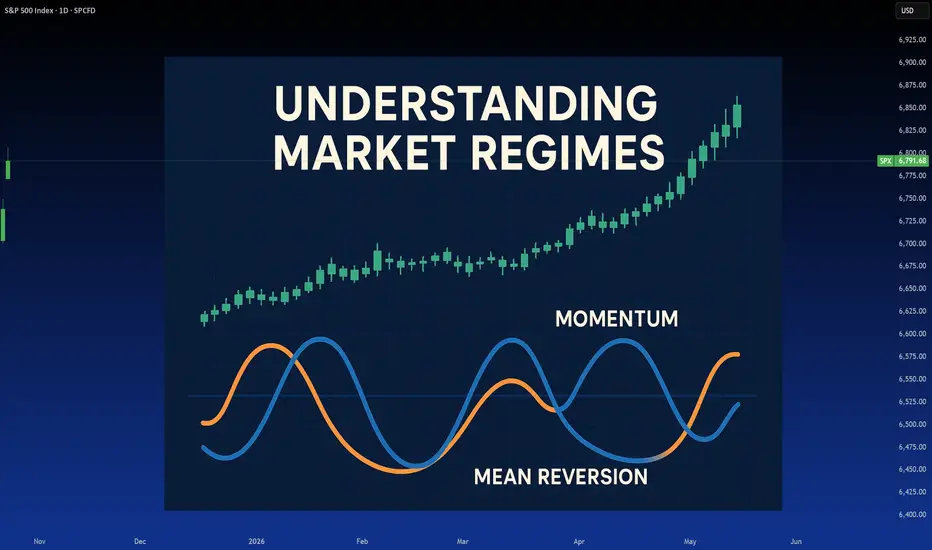
Market Regimes: What they are and why they matterRegimens, what are they and why they matter?
Most traders, especially new ones, don’t understand trading regimens. This is actually normal. Even as a quant based trader with higher education in stats/sciences, I learned of Regimen trading later in my trading career, having successfully navigated trading without it; but insurmountably improving things when I discovered it.
What is a regimen you may ask? Is it what’s going on in North Korea? Or even the USA?
Chances are, most people may think regime is synonymous with something like fascism or some ultra political significance, but the truth is regime can mean a few things, and I think its important, before getting into the real details, to first understand the meaning of regime.
The Meriam-Webster dictionary defines regime as:
regular pattern of occurrence or action (as of seasonal rainfall)
the characteristic behavior or orderly procedure of a natural phenomenon or process
mode of rule or management a government in power
a form of government
a government in power
a period of rule
If you were to do a grad school ‘ concept analysis’ on regime, you would get some interesting findings of regime. Essentially, all of these definitions have a significance/underlying overlap in meaning. The simplified meaning? I would say (without having done an actual concept analysis), a regime is a “pattern of behaviour / rules / government that forms repeating characteristics that can be measured and predicted against its previous characteristics”.
Still too complex? Let’s simplify with both political and scientific examples.
Political
In the current presidency in the U.S., the Republican party was swift to implement sweeping tariffs against international trade partners, blanketing entire continents in a matter of days with tariffs. These were then paused, resumed, paused, resumed, lowered, raised, lowered, raised, paused, resumed, revoked, resumed, lowered, raised, etc.
Under the current political regime, we can identify the behaviour of “tariff implementation”. From previous tariff implementation and revocation and adjustment, we have the characteristics of this regime. We can then use these characteristics to predict future outcomes under this regime, i.e. we would hypothesize “Tariffs will be paused within the coming 2 months”. We can say this because this is a characteristic of the current regime. In fact, the term TACO is a perfect example of repeating regime characteristics!
What about a scientific example?
Well we can draw on Meriam-Webster making reference to seasonal rainfall. In climatology, a " rainfall regime " refers to the characteristic pattern of precipitation over a region during the year—especially its timing, intensity, and variability across seasons. Identifying these regimes are pivotal to forecasting future meteorological and climatological events!
What about my field? Epidemiology and Biostatistics?
In Epi, we have multiple different regimes, such as:
Treatment Regime: A prescribed course of medical therapy, such as a drug regimen for tuberculosis or chemotherapy for cancer. It includes dosage, timing, and duration.
Vaccination Regime: A schedule of immunizations designed to prevent disease outbreaks—e.g., two-dose mRNA COVID-19 vaccine regime followed by boosters.
Control Regime: A set of public health policies or containment strategies—like quarantine protocols, mask mandates, or vector control in malaria-endemic areas.
Surveillance Regime: The systematic collection and analysis of health data to monitor disease trends—e.g., wastewater surveillance for poliovirus or syndromic surveillance for flu-like illness.
These all matter because these regimes dictate future characteristics/outcomes.
Great! Now that you have an idea of what a regime means, let’s talk about regimes in trading.
If you haven’t already guessed, there obviously exists “ market regime s”. These are, more or less, defined as “a distinct period characterized by specific patterns in market behavior—such as trends, volatility, and macroeconomic conditions—that influence investment strategies and risk management. ”
If you look back to our examples, you can begin to imagine why regimes matter. Remember, TACO! Previous behaviour dictates future characteristics. Once you understand the way or median in which some phenomena operates, you can use these characteristics to predict future characteristics.
If you wanted to dissect market regimes, it could get relatively involved and complex. For example, things such as:
Seasonality,
Momentum,
Mean Reversion,
Financial / economic stability
Geopolitical stability
These can all influence market regimes in their own way and can, in fact, be standalone market regimes. If you trade seasonality, you are trading “ seasonal regimes ”.
Momentum and Mean reversion are independent regimes of themselves (more on that shortly).
If you trade fundamentals, you will be trading economic and geopolitical regimes.
But which is correct? Not all regimes can exist at the same time, correct?
Yes and no! Regimes can momentarily shift and flip into a different one. Take, for example, the U.S. implementation of Tariff’s at the beginning of 2025. The initial blanket tariffs caused a mean reversion regime fueled by financial/economic and geopolitical stability. We had 3 regimes working together for the result, which was ultimately a mean reversion. This quickly shifted from a mean reversion regime to a momentum based regime (more on this shortly).
So, yes, we can, theoretically, have more than one regime simultaneously. However, when it comes to markets, and this is where you are in luck, its actually pretty easy! Markets tend to be either:
Mean reverting; or
Momentum based.
And that’s really that. Those are the only 2 regimes you will ever truly need to pay attention to, which will give you a better edge at trading. Seasonality, financial and geopolitical stability will either augment mean reversion or momentum, but generally are not independent regimes in and of themselves.
In the end, markets either go up, down or sideways. It can be driven by broader contexts, but in the end the up/down/sideways is driven by a predominate regimen;
Down markets: usually mean reverting.
Up markets: usually momentum.
Sideways markets: usually mean reverting with occasional momentum deviations.
If you want to learn more about the evolution of the market, you can check out my post about how the market has evolved into its current regime here:
Now, let the real fun begin and let’s talk about how to correctly trade based on the current regime!
There are some steps, first one must:
Identify the current regime concretely.
Apply the correct strategies that are compatible with the current regime.
Understand the momentum, mean reversion paradox
I will walk you through how to do this step by step.
Identifying the Current Regime Concretely
The easiest way to identify the current regime is by using Hurst Exponent.
The Hurst exponent is a number between 0 and 1 that tells you how predictable a time series is—like stock prices or rainfall.
If it's close to 0, the data is very random and tends to switch directions often.
If it's around 0.5, the data behaves like a random walk—no clear trend.
If it's close to 1, the data shows strong trends and tends to keep moving in the same direction.
So, it helps you measure persistence vs. randomness in patterns over time. The closer to 1 the more “persistent” the market is said to be. Persistence is basically the math equivalent of momentum. If a market is persistent, it will tend to trend with momentum.
The closer to 0 the more random the market is said to be . Randomness usually favours “mean reversion”
For simplicity, if you get a Hurst Exponent > 0.5, you are likely in a momentum regime. If < 0.5, you are likely in a mean reversion regime.
Let’s take a look at some examples using QuantNomad’s Hurt Exponent indicator ( available here ):
This is just before the crash in February 2025. We can see that up here, the Hurst Exponent was < 0.5, indicating a mean reversion preference. And indeed, the market ended up mean
reverting back to its quadratic mean (481) with the crash.
Then let’s see what happened:
After the crash, we can see that the Hurst Exponent was consistently > 0.5, indicating persistence in the market, i.e. trendy and momentum based.
Remember, as a rule of thumb, momentum markets generally faour upside and mean reverting tend to be downside favouring. If we narrow the regime to smaller timeframe regimes, you can see this phenomenon quite easily. Let’s look at SPY on a bearish day and bullish day against the Hurst Exponent:
We can see that on this bull trend day, Momentum and persistence reigned dominate. Hurst did not drop below 0.5, at least not for long, which indicated a persistent trend that was momentum driven.
Now a bearish day:
You can see on this bear trend day that Hurst stayed below 0.5 persistently, indicating mean reverting behaviour.
This also highlights how lower timeframes can have independent and day to day regimes, but its always important and critical to pay attention to the major regime a market is in on the larger timeframe.
Applying Correct Strategies
Depending on the regime, you MUST tailor your strategy to match the regime. If you are trading a mean reverting regime, oscillators like RSI and Stochastics aren’t going to work well. If you are trading a momentum regime with high persistence, mean reverting strategies like Bollinger Bands and Z-Score are not going to work.
As a rule of thumb, when Hurst is > 0.5, you want oscillator based strategies such as RSI, Stochastics, etc.
One indicator that I would recommend in momentum based regimes is my own, Momentum Probability Oscillator indicator ( available here ). This indicator operationalizes probability/sentiment through momentum metrics instead of mean reversion metrics. Let’s take a look at some examples:
In this example on the hourly timeframe for SPY, you can see that momentum is lost (signified by the oscillator falling below the yellow line) indicating that the likely outcome will be selling, this is shown by the pink arrows.
In this next example, we can see where momentum is reclaimed and the bias shifts to upside.
Because this indicator quantifies momentum probabilistically, it does well in momentum based, persistent regimes to identify strong trends and pullback of trends.
In reality, you can use any oscillator in a momentum based, persistent regime, but obviously I am biased to my own creations.
What about a mean reverting regimen?
If we are in a mean reverting regime, your best indicators to use are Bollinger Bands or, my favourite, the Z-Score probability indicator (by yours truly) available here .
Let’s use $NYSE:IRDM as our mean reverting example
In this image, the red arrow marks the transition to a mean reverting regime. So what do we use here? Well let’s take a look at the Z-Score probability indicator:
The red lines mark the transition to a mean reversion based regime. At the time of this transition, IRDM was oversold based on the Z-Score probability. We can see it in fact rallied back up to a z-score of 0 (mean reversion) before rejecting back down from the 0.
This is incredibly powerful, as the Hurst Exponent tells you that you can trust a reversion back to a mean!
Let’s try a smaller, intraday example, going back to SPY:
This day, SPY looked pretty bullish; however, the Hurst Exponent was consistently below 0.5 indicating mean reversion.
If we applied the Z-Score probability indicator:
I flipped the indicator to use Candles so you can more easily see the mean reversion behaviour. SPY goes to either extremes and always mean reverts back to 0, at times even consolidating in the mean reversion range.
And Bollinger bands:
If we look at a momentum driven day:
We can see that there is a skew or bias to one side of the average. The z-score is all over the map with no real expansion within the average range and infrequent and sporadic reversions that come more from extensive consolidation rather than actual mean reversion.
The indicator isn’t unusable in momentum based trading, but its not ideal. If we flip this same chart to the momentum probability oscillator we can see a stark difference in utility:
You can see the trend is using the full range of the oscillator and there is clear bounces at lower range and rejections at higher range with frequent “mean reversion” of the oscillator momentum based mean.
Now finally, the last section:
The Momentum Mean Reversion Paradox
This is, obviously, a self made up term. However, this is a phenomenon that will happen in corrective environments, where a mean reversion is so substantial, it becomes augmented by momentum itself.
What does this mean? It means that, despite the market actually mean reverting, the Hurst exponent flips to > 0.5, as the market is “persistently bearish”.
We can see this if we flip back to our $NYSE:IRDM example:
Here, we can see despite IRDM selling, the Hurst Exponent is incredibly trendy, with a really high value of > 0.55. Yet, despite this, the ticker continues down. This is the hallmark of a correction.
This is incredibly important and I really would advise you to mark this down and remember this. You can actually tell that something is “correcting” using this exact approach. When Hurst > 0.5 and the trend is down, this is the hallmark of a TRUE correction. No speculation needed!
Statistics is the best, I’m telling you.
Let’s look at the SPY crash of 2025:
During the SPY crash of 2025, the Hurst flipped to > 0.5, with a max of 0.57 indicating a hugely persistent trend. This means that this was a strong correction for SPY, flipping from a Hurst of < 0.5 to a Hurst of > 0.5 with a strong downtrend.
Crashes tend to happen abruptly without such transitions. For example, if we look at the COVID crash:
Theoretically Hurst warned us in advance that SPY was entering mean reversion territory, but when it actually happened, it happened so fast, Hurst never truly converted from mean reversion to trending. It was just a jumbled mess. This is the hallmark of a crash.
Concluding Remarks
And now, my friends, you know all there is to know about how to identify market regimes! Understanding these concepts will put your eons ahead of the average trader and allow you to select the correct tools and actually understand what the market is doing and when its gearing up for some corrections/mean reversions.
This is a long post, I will leave it there, but I really hope you learned something from this and will take some of the key points away!
Thanks for reading and as always, safe trades!
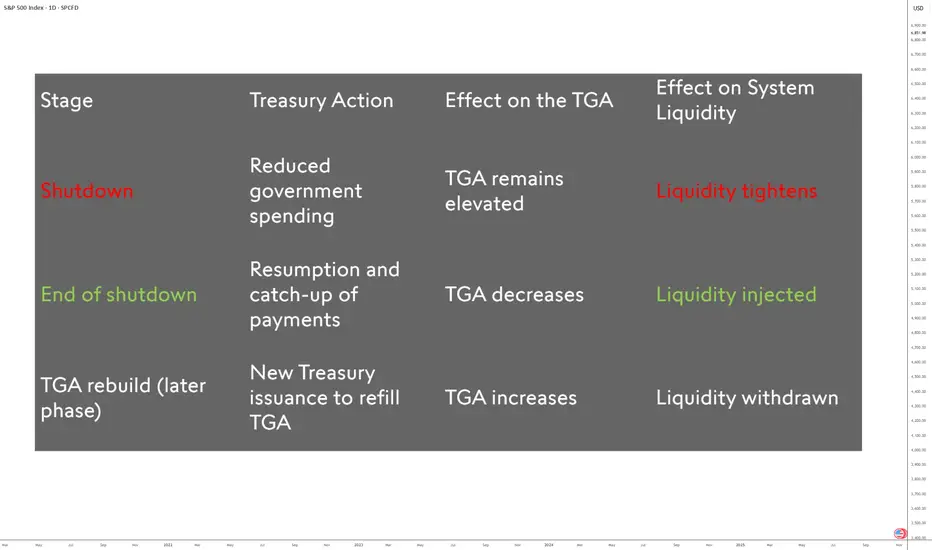
Upcoming End of the Shutdown & Market LiquidityThe end of a U.S. government shutdown is often interpreted as a mere political signal. Yet, from a financial perspective, this event can mark a major turning point for global liquidity. One of the most direct mechanisms through which this occurs is the Treasury General Account (TGA) — the U.S. Treasury’s main account at the Federal Reserve (Fed).
1) The TGA: a true liquidity reservoir
The TGA functions as the federal government’s current account.
When it receives revenues (taxes, bond issuance, etc.), funds are deposited there. When it spends — salaries, contractor payments, social programs — those amounts leave the TGA and flow toward commercial banks and households.
Each dollar spent by the Treasury exits the Fed and enters the private sector, increasing bank reserves and overall financial system liquidity.
Conversely, when the Treasury issues bonds and collects money from investors, bank reserves decline since those funds are transferred into the TGA.
2) Shutdown: a period of silent contraction
During a shutdown, the government is largely paralyzed. Many payments are suspended or delayed, reducing cash outflows.
As a result, the TGA drains much more slowly, and available liquidity in the financial system decreases. It is worth noting that the TGA had just finished refilling in early October — exactly at the onset of the shutdown.
3) The end of the shutdown: a sharp reinjection
As soon as the shutdown ends, the U.S. Treasury must catch up on deferred spending — wages, contracts, and federal programs.
These large disbursements cause a rapid decline in the TGA, equivalent to a direct injection of liquidity into the economy.
Bank reserves increase mechanically, repo rates may ease, and risk assets — equities, high-yield bonds, crypto-assets — often experience a short-term rebound.
This liquidity surge is not sustainable: once payments are settled, the Treasury usually reissues debt to rebuild the TGA to its target level. This reverse phase then withdraws the excess liquidity from the market.
In the short term, however, the end of a shutdown acts as a positive liquidity pump, capable of influencing the trend of risk assets on financial markets.
DISCLAIMER:
This content is intended for individuals who are familiar with financial markets and instruments and is for information purposes only. The presented idea (including market commentary, market data and observations) is not a work product of any research department of Swissquote or its affiliates. This material is intended to highlight market action and does not constitute investment, legal or tax advice. If you are a retail investor or lack experience in trading complex financial products, it is advisable to seek professional advice from licensed advisor before making any financial decisions.
This content is not intended to manipulate the market or encourage any specific financial behavior.
Swissquote makes no representation or warranty as to the quality, completeness, accuracy, comprehensiveness or non-infringement of such content. The views expressed are those of the consultant and are provided for educational purposes only. Any information provided relating to a product or market should not be construed as recommending an investment strategy or transaction. Past performance is not a guarantee of future results.
Swissquote and its employees and representatives shall in no event be held liable for any damages or losses arising directly or indirectly from decisions made on the basis of this content.
The use of any third-party brands or trademarks is for information only and does not imply endorsement by Swissquote, or that the trademark owner has authorised Swissquote to promote its products or services.
Swissquote is the marketing brand for the activities of Swissquote Bank Ltd (Switzerland) regulated by FINMA, Swissquote Capital Markets Limited regulated by CySEC (Cyprus), Swissquote Bank Europe SA (Luxembourg) regulated by the CSSF, Swissquote Ltd (UK) regulated by the FCA, Swissquote Financial Services (Malta) Ltd regulated by the Malta Financial Services Authority, Swissquote MEA Ltd. (UAE) regulated by the Dubai Financial Services Authority, Swissquote Pte Ltd (Singapore) regulated by the Monetary Authority of Singapore, Swissquote Asia Limited (Hong Kong) licensed by the Hong Kong Securities and Futures Commission (SFC) and Swissquote South Africa (Pty) Ltd supervised by the FSCA.
Products and services of Swissquote are only intended for those permitted to receive them under local law.
All investments carry a degree of risk. The risk of loss in trading or holding financial instruments can be substantial. The value of financial instruments, including but not limited to stocks, bonds, cryptocurrencies, and other assets, can fluctuate both upwards and downwards. There is a significant risk of financial loss when buying, selling, holding, staking, or investing in these instruments. SQBE makes no recommendations regarding any specific investment, transaction, or the use of any particular investment strategy.
CFDs are complex instruments and come with a high risk of losing money rapidly due to leverage. The vast majority of retail client accounts suffer capital losses when trading in CFDs. You should consider whether you understand how CFDs work and whether you can afford to take the high risk of losing your money.
Digital Assets are unregulated in most countries and consumer protection rules may not apply. As highly volatile speculative investments, Digital Assets are not suitable for investors without a high-risk tolerance. Make sure you understand each Digital Asset before you trade.
Cryptocurrencies are not considered legal tender in some jurisdictions and are subject to regulatory uncertainties.
The use of Internet-based systems can involve high risks, including, but not limited to, fraud, cyber-attacks, network and communication failures, as well as identity theft and phishing attacks related to crypto-assets.
Potential Range Rebalance After Bullish Exhaustion on SP500Based on Candle Range Theory , the recent large bullish range has been followed by a series of smaller bearish candles, showing reduced momentum and potential exhaustion from buyers. Price is currently retracing into the lower range of the previous expansion, indicating that liquidity may be resting below.
If price fails to reclaim the upper range of the previous bullish candle, we could see continuation to the downside as the market seeks equilibrium within or below that expansion range. However, a strong rejection from the lower boundary could confirm range preservation and set up another bullish leg.
In short : the market’s next move depends on whether this retracement turns into a liquidity grab or a deeper correction beneath the prior candle range.

Update at 4pmAlthough the trade did not go my way today, I still expect a further move down. I'm incorrect if they get over the high from today. Gold also looks ready to test it's lows. Oil still consolidating above it's 18ma. BTC looks like a pullback is also coming, a further low is expected still.

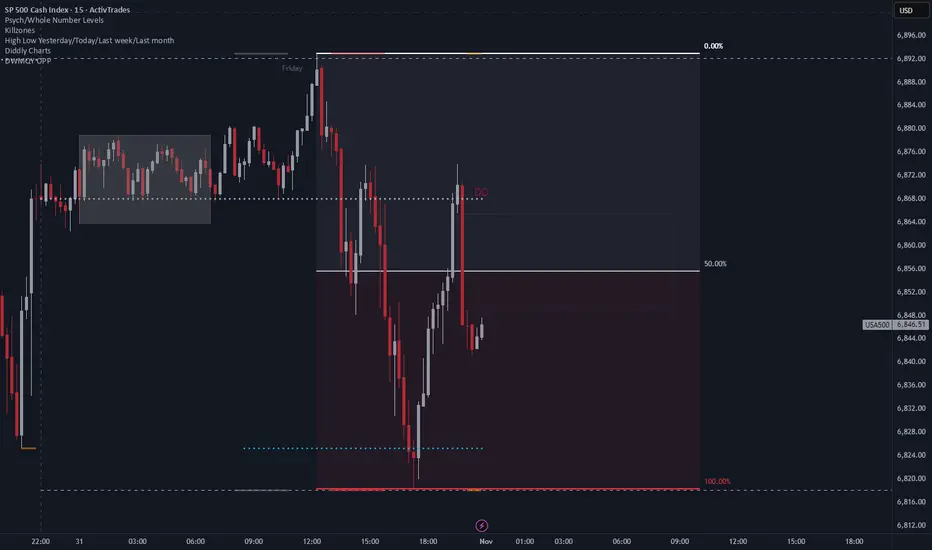
Intraday Range Expansion and Potential Repricing on the SPXFollowing a clean sweep of Friday’s high, price delivered a strong displacement to the downside, breaking short-term structure and rebalancing inefficiencies left behind. The subsequent rebound towards the daily open suggests a retracement into a premium area, potentially setting up for continuation lower if rejection holds around that zone.
If buyers fail to sustain price above the daily open, the market could aim for a full range fill back toward the previous low or discount zones below, maintaining the current bearish intraday order flow.