Weekly Trading Opportunities | October 21–25 • Monday: China GDP data
China’s third-quarter GDP report will be closely watched as growth is expected to slow to 4.8% year-on-year from 5.2% in Q2.
Slowing growth in China could reduce demand and prices for commodities. A surprise upside could support commodity prices.
• Tuesday: Coca-Cola and Netflix earnings.
Earnings season continues with Coca-Cola, Netflix, and others including Tesla, IBM, and Intel.
Strong results could offset soft U.S. data and help reignite the risk-on environment.
• Wednesday: U.K. inflation data and Tesla earnings
U.K. inflation is expected to edge back toward 4%. A softer reading could boost U.K. equities and pressure the pound.
• Thursday: Intel earnings
• Friday: U.S. CPI report
With the U.S. government shutdown entering its fourth week, the CPI release remains the week’s key data point. A hotter print could lift the dollar.
Trade ideas
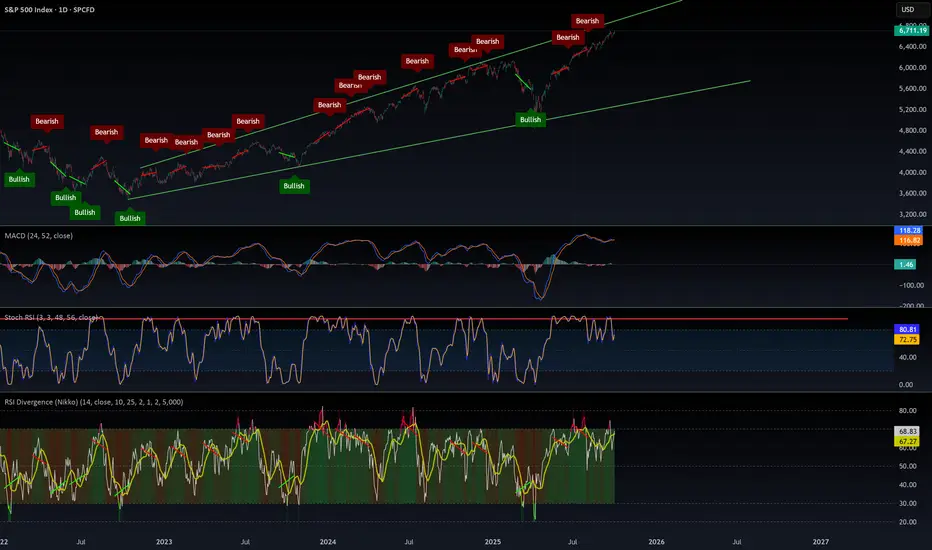
SPX: S&P500 An Economical Reset Again?Technically, the chart is vivid and self-explanatory.
The RSI (14) is implicating an obvious Negative Divergence before the last downturn and the chart recent structure.
The US treasury has no other option but printing more and more bucks, or cutting the interest rates. I don't know any other financial instruments.
Fundamentally, no market structure can soar or fall eternally.
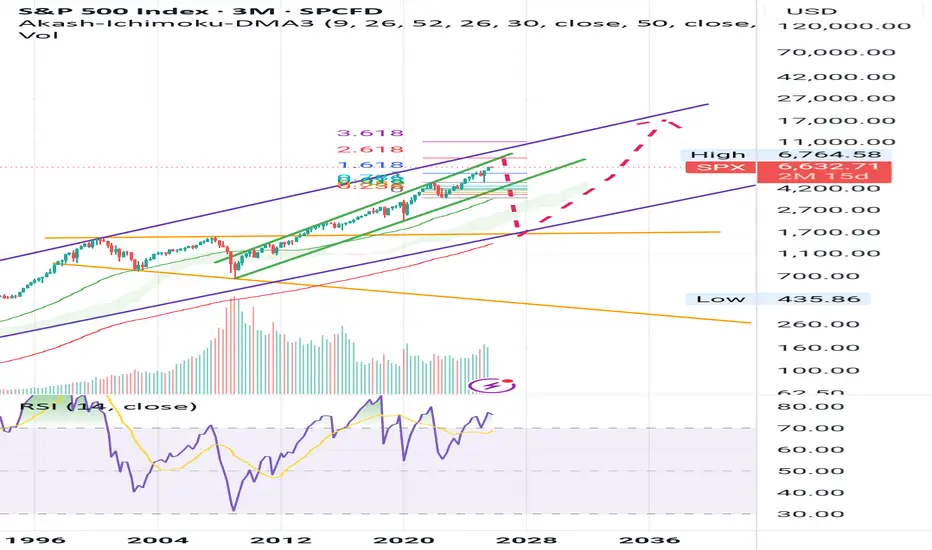
I have had a look on BTC and Gold Futures. Gold has some room during the coming years. Yet, regarding bitcoin, according to futures I prefer not to be too optimistic.
The implications at the moment are only some assumptions and the future remains a uncertain. This is a systematic luck guess and bet.
We have several barometers and tools based on which we can Approximate the possibilities through a few scenarios and nothing more.
Eventually, we need to check those factors and barometers and practice several reasonable scenarios on our capital.
This is not a financial advice, but it is a serious warning against perils if an over-financialization phenomenon following almost a century from that black era of high unemployment and economical downturn that the US experienced in 1930s.
DYOR
Please like and follow and have your comments inhere.

S&P 500 Bear Market in 2026The Stock market is going to send Crypto into a Bear market in 2026.
It just broke it's weekly cycle count and it's currently painting a bullish divergence. This means only one thing - we are going into a blow-off top within the next 2 months.
We are going to top above 7000 area, and in case we don't have a proper retracement into the Weekly Cycle low within November, we are going to make a blow-off top in December/January.
2026 Year will be profit taking year and the stock market is expected to retrace 20%, while Bitcoin will go down by more than 50%.
It's the last leg of the bull and it's time to get allocated in the market.

BUY SPX - S&P500- Amazing low risk high reward trade!Based on our deep analysis we can see that SPX - S&P500 will head to the upside. Great time to buy - it has broken major resistance levels + trends.

Market Pulse: Cracks in the Bull?We kick off the week with the S&P still riding its two-month uptrend, supported by the 55-day MA at 6541. But signs of fatigue are emerging.
📉 Amazon is slipping below its 200-day MA 📊 NVIDIA’s recent high at 195.62 hovers near the 197 Fibonacci extension and the 200 psychological level
Technically, the uptrend holds—and if 6765 the recent high breaks, the bull may charge on. If the 55-day MA erodes, brace for a correction.
🔍 Keep chart levels in focus 📌 Tighten stops ⚠️ Not investment advice
#TechnicalAnalysis #SP500 #Amazon #NVIDIA #MarketUpdate #TradingStrategy #RiskManagement #Fibonacci #BullMarket #ChartWatch #FinanceTwitter #LinkedInFinance

Reserve Currency Dominance: Mechanisms, History, and Future OutlIntroduction
In the complex fabric of the global economy, the concept of reserve currency dominance plays a crucial role in shaping international trade, finance, and geopolitical power. A reserve currency is a foreign currency that central banks and major financial institutions hold in large quantities for international transactions, investments, and to stabilize their own currencies. Dominance in reserve currency status means that one currency—historically the U.S. dollar—acts as the world’s primary medium of exchange, store of value, and unit of account in the global financial system.
Reserve currency dominance is not merely a matter of economics; it embodies political influence, military strength, and institutional trust. Over time, it has dictated global trade patterns, shaped capital flows, and influenced monetary policy decisions across nations. This essay explores the evolution, mechanisms, and implications of reserve currency dominance, with particular focus on the U.S. dollar’s supremacy and emerging challenges in a multipolar world.
Historical Evolution of Reserve Currency Dominance
The concept of a reserve currency is centuries old. Historically, the dominant reserve currency has always been associated with the world’s leading economic and military power. During different eras, currencies such as the Venetian ducat, Spanish silver real, Dutch guilder, and British pound sterling held global reserve status. Each period of dominance reflected the geopolitical and economic influence of the issuing nation.
1. The British Pound Era (19th to early 20th century)
During the 19th century, the British Empire’s global reach made the pound sterling the leading reserve currency. London emerged as the world’s financial capital, and the gold standard provided monetary stability. Nations held pounds because they trusted Britain’s financial institutions and its vast trade networks. The sterling system symbolized confidence, liquidity, and convertibility into gold.
2. Transition to the U.S. Dollar (Post-World War II)
World War II shifted the economic balance of power. The United States emerged as the world’s industrial powerhouse, holding the majority of global gold reserves. The Bretton Woods Agreement (1944) institutionalized the U.S. dollar as the world’s primary reserve currency, pegged to gold at $35 per ounce. Other currencies were pegged to the dollar, effectively making it the world’s anchor currency.
3. Post-Bretton Woods and Dollar Supremacy
In 1971, President Richard Nixon ended the dollar’s convertibility to gold, marking the collapse of Bretton Woods. Yet, the dollar retained its dominance due to the Petrodollar system, in which oil prices were denominated in dollars, and the global reliance on U.S. financial markets. The U.S. economy’s depth, liquidity, and stability continued to attract foreign reserves, even without a gold peg.
Mechanisms Sustaining Reserve Currency Dominance
For a currency to dominate global reserves, several interlinked mechanisms must operate effectively:
1. Economic Scale and Stability
A dominant reserve currency is typically issued by the world’s largest and most stable economy. The United States accounts for a significant share of global GDP and trade, providing the dollar with a vast network of transactions. Economic scale ensures that the currency is widely used and trusted.
2. Deep and Liquid Financial Markets
Reserve currencies require large, stable, and liquid financial markets. The U.S. Treasury market, for example, is the most liquid in the world, allowing investors and central banks to buy and sell assets without major price fluctuations. The reliability of these markets gives central banks confidence in holding dollar-denominated assets.
3. Institutional Trust and Rule of Law
The credibility of the issuing nation’s institutions—its central bank, judiciary, and regulatory bodies—is vital. The U.S. Federal Reserve and the country’s legal system offer transparency, predictability, and strong investor protections. This institutional trust is a cornerstone of reserve currency dominance.
4. Network Effects
Once a currency becomes dominant, it benefits from self-reinforcing network effects. Global trade, finance, and commodities become priced in that currency, making it more convenient and efficient for countries to hold it as reserves. The more it is used, the more valuable it becomes for global participants.
5. Geopolitical and Military Influence
Reserve currency dominance often parallels military and political power. The U.S., through its global alliances and defense capabilities, has maintained a secure international environment that underpins confidence in its currency. Countries tend to hold the currency of a politically stable superpower rather than that of a regional or unstable state.
The Dollar’s Global Dominance
The U.S. dollar remains the world’s undisputed reserve currency, despite growing talk of diversification and de-dollarization. According to the International Monetary Fund (IMF), roughly 58% of global foreign exchange reserves are held in U.S. dollars (as of 2025). The euro follows with around 20%, while other currencies such as the Japanese yen, British pound, and Chinese yuan make up smaller portions.
1. Role in Global Trade
Approximately 80% of global trade transactions are invoiced in U.S. dollars. Even countries not directly trading with the U.S. use the dollar as a reference currency. This global acceptance simplifies pricing, invoicing, and payment settlements.
2. Dollar in Financial Markets
Global commodities—including oil, gold, and agricultural products—are predominantly priced in dollars. Additionally, international debt issuance and cross-border banking rely heavily on dollar-denominated assets, reinforcing the greenback’s global reach.
3. U.S. Treasury Securities
Central banks hold U.S. Treasury bonds as a primary form of reserves due to their safety and liquidity. During times of crisis, investors typically rush to U.S. assets, further strengthening the dollar’s position—a phenomenon known as the “flight to safety.”
Benefits of Reserve Currency Dominance
For the United States, reserve currency dominance brings numerous advantages that few other nations enjoy:
1. Lower Borrowing Costs
Because global demand for U.S. Treasury securities remains strong, the U.S. government can borrow at lower interest rates. This allows America to finance large fiscal deficits with relative ease—a phenomenon referred to as the “exorbitant privilege.”
2. Global Influence
The dollar’s dominance gives the U.S. substantial geopolitical leverage. Economic sanctions, trade restrictions, and financial controls imposed through the dollar-based system can effectively isolate nations from global finance.
3. Economic Stability
Global demand for dollars helps stabilize the U.S. economy by attracting continuous capital inflows. The dollar’s safe-haven status often cushions the U.S. from financial turbulence affecting other economies.
Costs and Risks of Dominance
While reserve currency dominance offers power and privilege, it also entails structural challenges:
1. Trade Deficits
To supply the world with dollars, the U.S. must run persistent current account deficits. This structural imbalance, known as the Triffin Dilemma, means that the U.S. must provide global liquidity even at the cost of domestic imbalances.
2. Policy Constraints
Because of the global demand for dollars, U.S. monetary policy has international consequences. Interest rate hikes or cuts by the Federal Reserve can trigger capital flows, currency fluctuations, and inflationary pressures across emerging markets.
3. Financial Overdependence
Excessive global reliance on the dollar creates vulnerabilities. Any disruption in the U.S. financial system—such as the 2008 crisis—spreads rapidly worldwide. The dollar’s centrality amplifies systemic risks.
Challenges to Dollar Dominance
Although the dollar remains unrivaled, several forces are gradually reshaping the reserve currency landscape.
1. Rise of the Euro
The euro, since its introduction in 1999, has become the second most held reserve currency. The European Union’s large economy and integrated financial systems support its use, though political fragmentation and lack of a unified fiscal policy limit its potential to dethrone the dollar.
2. The Chinese Yuan (Renminbi)
China’s yuan has been gaining recognition, particularly after its inclusion in the IMF’s Special Drawing Rights (SDR) basket in 2016. The Belt and Road Initiative (BRI), expansion of the Cross-Border Interbank Payment System (CIPS), and increasing yuan-denominated trade have supported China’s long-term ambitions for currency internationalization. However, capital controls and limited market transparency remain major obstacles.
3. Digital Currencies and CBDCs
The emergence of Central Bank Digital Currencies (CBDCs) and blockchain-based payment systems presents potential alternatives to traditional reserve systems. China’s digital yuan, for example, aims to reduce dependency on the dollar-dominated SWIFT system. Similarly, discussions of a BRICS currency or digital gold-backed instruments indicate growing interest in multipolar monetary frameworks.
4. De-dollarization Trends
In recent years, several nations have diversified their reserves away from the dollar. Russia, China, and members of the BRICS alliance have increased holdings of gold and other currencies. Moreover, countries are exploring bilateral trade in local currencies, particularly in energy and defense sectors.
Future Outlook: Multipolar Currency Order
The global financial architecture is gradually shifting from unipolar to multipolar. While the dollar’s dominance will likely continue in the medium term, structural trends suggest a slow diversification of global reserves.
Short-term outlook (2025–2035):
The dollar will remain dominant due to trust, liquidity, and institutional strength. Alternative systems may gain traction but won’t replace the dollar outright.
Medium-term outlook (2035–2050):
A multipolar system may emerge with the euro, yuan, and possibly digital assets sharing reserve functions. The share of the dollar could decline to around 40–45%.
Long-term outlook:
Global reserve systems may evolve into digital or commodity-backed models, reducing dependence on any single national currency. The rise of blockchain-based settlement systems may redefine monetary sovereignty and financial autonomy.
Conclusion
Reserve currency dominance has always been a reflection of global power structures—economic, political, and institutional. The U.S. dollar’s supremacy, forged after World War II, remains the cornerstone of the modern financial system. Its strength lies in America’s vast economic capacity, transparent markets, and geopolitical influence. Yet, this dominance is not guaranteed forever.
As the world transitions toward multipolarity—with the rise of China, the European Union’s consolidation, and the emergence of digital currencies—the foundations of the dollar-based order are being tested. While no alternative yet offers the same combination of trust, liquidity, and stability, the long-term trajectory suggests a gradual diversification of global reserves.
Ultimately, the future of reserve currency dominance will depend not only on economic fundamentals but also on technological innovation, geopolitical cooperation, and the resilience of global financial institutions. The dollar’s reign may persist, but the seeds of a new, more balanced monetary order are already being sown.

SPX Setup - overdue for a dip, is it time?Lets see what price does when it reaches the trendline above. A break and retest, or rejection on the line would be a good risk/reward setup.
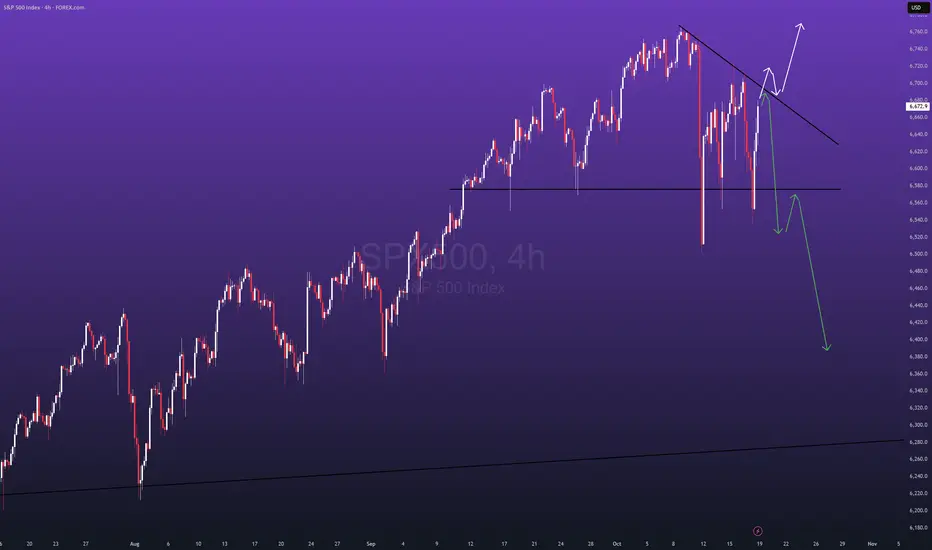
This could be a big Triangle on SPX500USDHi traders,
Last week we saw a correction up and more downside for SPX500USD just as I've said in my outlook.
On Friday it went up again so the corrective pattern could be a Triangle.
In that case next week we could see another correction down and after that up again.
Let's see what the market does and react.
Trade idea: Wait for the finish of this bigger correction. Trading inside a Triangle is a sure way to lose.
This shared post is only my point of view on what could be the next move in this pair based on my technical analysis.
But I react and trade on what I see in the chart, not what I've predicted or expect.
Don't be emotional, just trade your plan!
Eduwave

US500 (S&P 500) Technical Forecast: At a Critical Crossroad🎯 US500 (S&P 500) Technical Forecast: At a Critical Crossroad
The US500 trades at 6,672.1, testing a major technical confluence. Our analysis points to a tense equilibrium between bulls and bears, with the next directional move set for a significant breakout.
📊 Multi-Timeframe Synthesis & Market Structure
Daily (Trend Bias): The long-term trend remains cautiously bullish above the 6,600 support (50 EMA & prior resistance break). However, price action is compressing, indicating a loss of momentum and a potential coiling for a volatile move.
4H & 1H (Swing Setup): A potential Double Top pattern is forming, with the neckline near 6,640. The 4H RSI shows a pronounced bearish divergence, signaling weakening buying pressure. This is a primary warning for swing traders.
Intraday (15M/5M - Precision): Immediate resistance is firm at 6,690 - 6,700 (psychological level). Support sits at 6,660. A break below 6,660 targets the 6,640 neckline. The 5M Anchored VWAP is capping rallies.
🧠 Key Technical Narratives & Theories
Elliott Wave & Wyckoff: The structure from the last low suggests we may be in a complex Wave 4 correction or the final phase of a Wyckoff distribution (Upthrust After Distribution). A break below 6,640 would confirm this bearish narrative.
Gann & Harmonic Levels: Key Gann support converges with the 0.382 Fibonacci retracement level near 6,620-6,630. This is the next major target if sellers overpower the 6,640 level.
Ichimoku Cloud: On the 4H chart, price is trading within the Kumo (cloud), indicating a loss of trend direction and a battleground between buyers and sellers.
⚖️ Momentum & Volume Assessment
RSI (14): Reading 49 on the 1D, neutral but bearish-diverged on lower timeframes.
Bollinger Bands (20): Price is hugging the middle band, and bands are squeezing, indicating a period of low volatility that often precedes a high-volatility expansion.
Volume & VWAP: Recent attempts to push higher have been on declining volume, a classic sign of a potential bull trap. Anchored VWAP from the recent swing low is now resistance.
🛠️ Trade Plan & Levels
Swing Short Idea: Sell on a confirmed break below 6,640 (close on 1H), targeting 6,620 and then 6,580. Stop loss above 6,710.
Intraday Short Idea: Sell on a break below 6,660 or rejection from 6,690, targeting 6,640. Stop loss above 6,705.
Intraday Long Idea: Only consider buys on a strong break and hold above 6,700 with rising volume, targeting 6,730. Stop loss below 6,680.
💡 The Bottom Line
The US500 is showing cracks in its bullish armor. The burden of proof is on the bulls to reclaim 6,700. Until then, the path of least resistance appears to be lower, with a break of 6,640 likely triggering a deeper pullback. Manage risk carefully in this volatile setup.
Disclaimer: This is technical analysis, not financial advice. Trade at your own risk.

S&P 500 Daily Chart Analysis For Week of Oct 17, 2025Technical Analysis and Outlook:
Last week's trading session was marked by significant volatility in the S&P 500 Index, which experienced pronounced price fluctuations following its descent to our established Mean Support level of 6550. This level served as a critical point for market participants, triggering a series of rapid buying and selling activities that contributed to the index's overall gyrations.
At present, the index is positioned just below the newly established Mean Resistance level of 6671, which indicates the potential for further upward momentum, as this trend suggests a Well-built extension to the subsequent Mean Support level of 6550.
Contrariwise, it is essential to acknowledge and be aware of the emergence of the unexpected market drop to the Mean Support 6550, 6485, 6371, and the Key Support level of 6240. Additionally, it's crucial to take note of the Auxiliary Inner Rebounds occurring at these critical points.

S&P 500 at the Golden Support – Bounce or Breakdown?Short-Term View:
S&P 500 is testing its 50-day moving average near 6,470 after a recent correction from 6,800. A strong bullish reaction from this zone could push prices toward 6,850 → 7,000.
If the index closes below 6,550, short-term momentum turns bearish and a drop toward 6,400 becomes likely.
Long-Term View:
The broader trend remains bullish as long as price holds above 6,470–6,145.
Breaking below 6,145 would confirm a larger correction toward 6,000–5,800, while holding above this zone keeps the path open for new highs near 7,200.
Summary:
S&P 500 stands at a key technical decision zone — the market is deciding whether to resume its bullish trend or start a mid-term correction.

$SPX500 by all metrix this is overboughtMarkets can stay irrational longer than we can stay solvent. Right now, we’re at the top of this megaphone pattern, with everything extremely overbought in epic fashion.
⚠️ Caution: the odds of a serious correction are high — the chart points to a potential target around $5,650.
Sure, the madness can continue. The Fed can keep printing USD that pours into stocks instead of the real economy — until people are jobless, starving, and rioting for food.
📈 Enjoy the rally while it lasts, but use stop-losses. This market is dangerously overheated.
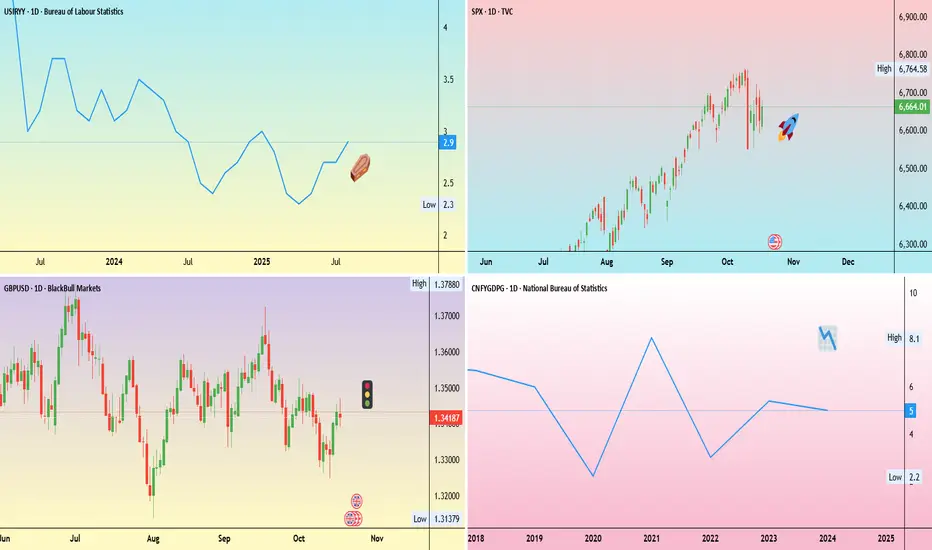
Analysis of S&P.Here’s the status of the top 500 companies in the U.S. because of Trump’s crazy moves. What kind of analysis can you do with this chart? Trump has messed up all the markets.

SPX long term channelThe channel is well formed. But for me the criteria for a completed channel is 5 alternating touches, generally clean unless market is volatile in which case line sorts them out
So red is top rail completion or due
Blue is top rail completion or due
Not financial advice

SPX short term roadmapPath says it all. Not financial advice. Will show zoomed out channel in another post.
S&P 500 May Show Signs of FatigueS&P 500 has rallied steadily since April, but some traders may see signs of fatigue.
The first pattern on today’s chart is the large bearish candle last Friday, October 10, as trade wars resurfaced. Prices have remained trapped inside the range since. Does the sideways trend mark an end to the six-month uptrend?
Second is the high on September 22, higher high on October 9 and lower high on October 15. That may be viewed as a potential rounded top. A pair of bearish outside bars could also be viewed as reversal signals.
Third is the October 3 weekly close of 6,715. SPX peaked near the same level on Wednesday and Thursday, which may suggest resistance has been established at a lower level.
Fourth, you have the September 26 weekly close of 6,644. The index plunged beneath that price last Friday and tried unsuccessfully to rebound above it in the first half of this week. That may reflect a lack of new support.
Next, SPX is potentially breaking a rising trendline that began in late May.
Finally, MACD has recently turned negative and prices may be stalling at the 8-day exponential moving average.
TradeStation has, for decades, advanced the trading industry, providing access to stocks, options and futures. If you're born to trade, we could be for you. See our Overview for more.
Past performance, whether actual or indicated by historical tests of strategies, is no guarantee of future performance or success. There is a possibility that you may sustain a loss equal to or greater than your entire investment regardless of which asset class you trade (equities, options or futures); therefore, you should not invest or risk money that you cannot afford to lose. Online trading is not suitable for all investors. View the document titled Characteristics and Risks of Standardized Options at www.TradeStation.com . Before trading any asset class, customers must read the relevant risk disclosure statements on www.TradeStation.com . System access and trade placement and execution may be delayed or fail due to market volatility and volume, quote delays, system and software errors, Internet traffic, outages and other factors.
Securities and futures trading is offered to self-directed customers by TradeStation Securities, Inc., a broker-dealer registered with the Securities and Exchange Commission and a futures commission merchant licensed with the Commodity Futures Trading Commission). TradeStation Securities is a member of the Financial Industry Regulatory Authority, the National Futures Association, and a number of exchanges.
TradeStation Securities, Inc. and TradeStation Technologies, Inc. are each wholly owned subsidiaries of TradeStation Group, Inc., both operating, and providing products and services, under the TradeStation brand and trademark. When applying for, or purchasing, accounts, subscriptions, products and services, it is important that you know which company you will be dealing with. Visit www.TradeStation.com for further important information explaining what this means.

SPX | Daily Analysis #5Hello and welcome back to DP,
**Yesterday’s Review and News**
In the previous trading day, the market experienced fluctuations of approximately $118. It initially climbed during the Asian and London sessions. However, during the New York session, the market showed significant downward movement, breaking key support levels and trend lines.
Regarding news, the most notable event was the phone call between Trump and Putin, with a scheduled meeting to discuss the Ukraine conflict. The price approached the 6720 level, but sellers prevented the index from reaching and breaking the last pivot point, causing a sharp decline. The price broke through the important candle we mentioned earlier and eventually stopped at 6540.
**1H – 4H Time Frame**
Today, the market showed weakness during the Asian session (breaking the previously mentioned candle) and the early London session. However, by mid-day in London, the price found support and began moving upward. If buyers maintain this support, the price could potentially reach the 6700 level.
**Trade Idea**
At this time, the best strategy is to wait for the price to approach the 6700 area and then consider selling the index to target lower levels.
- For informational purposes only – not financial advice. © DIBAPRISM -
Issued: Amir D. Kohn

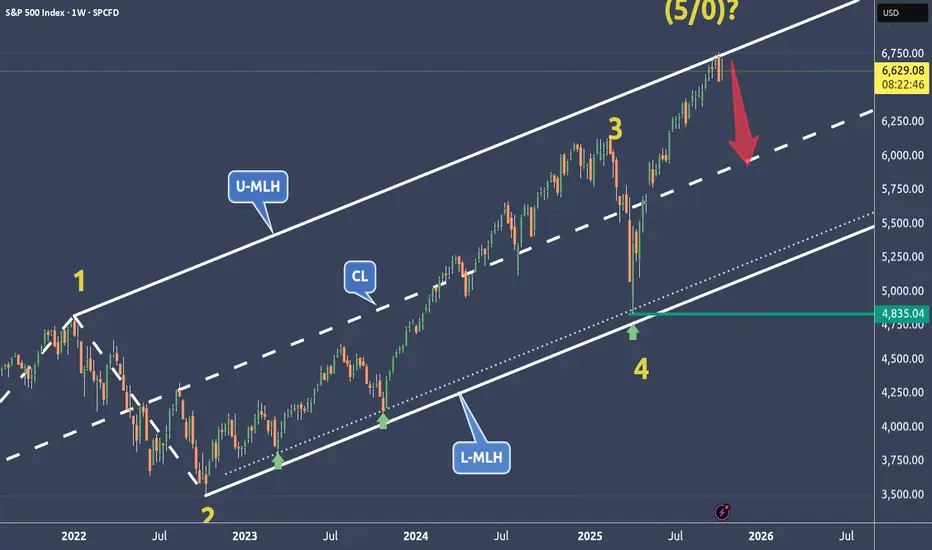
SPX is weakening at a very dangerous price level🔱 SPX is at a very dangerous price level ⚠️
...right at the Upper Median Line Parallel.
💰 If this market turns, the Centerline becomes the next target.
The 0-5 Count is also a good indication when prices start to turn at these extreme levels.
⚠️ Stay sharp — momentum is fading.
I wish you all a relaxing weekend.
US500 Short term cautionOutlook
While short term caution is warranted due to the recent decline and elevated volatility, the US500 remains in a long term uptrend supported by strong annual gains. Expectations of continued resilience from large cap stocks maintain a positive outlook going into year end. However, models suggest a cautious path for the near future, anticipating the index to correct, indicating potential headwinds. The critical support zone remains near 6,400.
Fundamental Analysis
US500 demonstrates robust long term health, up over 11% compared to one year ago. This performance is fundamentally driven by resilient large cap earnings and underlying strength in technology and consumer sectors. Major financial institutions, including JP Morgan, Goldman Sachs, and Citigroup, have recently raised their year end targets into the 6,000 – 6,900 range, citing expectations of continued strong earnings and potential tailwinds from monetary policy shifts and interest rate cuts. However, current sentiment has introduced short term caution due to recent macroeconomic developments and elevated volatility.
Technical Analysis
The index is currently trading around a key support of 6,600 points, reflecting a short term decline from the previous session. The short term trend is showing signs of a possible bearish correction or pullback, despite longer timeframes maintaining underlying bullish momentum. Volatility is notably elevated, with the VIX above 25.00, suggesting increased market uncertainty and potential for sharp swings. Immediate resistance is clearly defined near the recent high of 6,725. Immediate support is seen around 6,600 points. Short term bearishness is primarily attributed to technical factors like profit taking.
Analysis by Terence Hove, Senior Financial Markets Strategist at Exness

SPX500 Drops as Regional Banking Worries Shake Wall StreetSPX500 – Overview | Bearish Pressure Below 6,578
U.S. stock futures fell nearly 2% as regional banking concerns resurfaced following disappointing earnings and early signs of credit stress across smaller U.S. lenders.
The selloff reignited fears about credit quality and dragged global markets lower, while traders now shift focus to upcoming earnings from regional banks and American Express for further clues on financial stability.
🕯 Technical Outlook
SPX500 maintains bearish momentum while trading below 6,578, targeting 6,550 → 6,527 → 6,506.
A 1H close above 6,578 would shift sentiment bullish, opening the path toward 6,609 → 6,635 → 6,670.
Pivot: 6,578
Support: 6,550 – 6,527 – 6,506
Resistance: 6,609 – 6,635 – 6,670

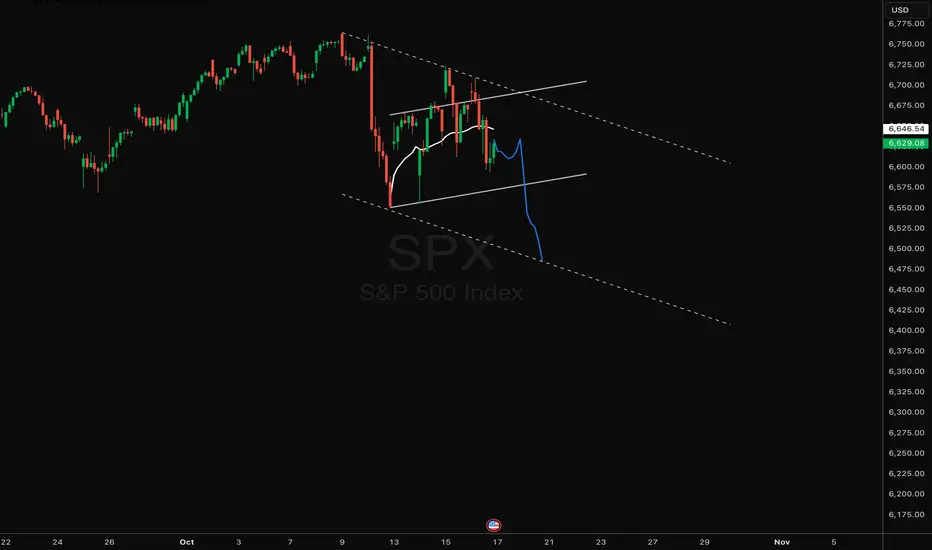
SPX — Still Below Anchored VWAP, Eyes on Lower Channel BoundSPX remains capped below the anchored VWAP — sellers still dictating flow. If price can’t reclaim above, a move toward the lower bound of this descending channel remains in play. Watching for a reaction near channel support.
Macro Backdrop:
Sticky yields: 10Y holding near cycle highs keeps pressure on equity multiples.
Fed tone: “Higher for longer” stance limits risk appetite and valuation expansion.
Slowing growth: Softening ISM and consumer data hint at cooling demand.
Earnings compression: Margin pressures building as labor and input costs stay elevated.
Geopolitical overhangs: Middle East tensions and trade friction adding to risk-off tone.
Longer term S&P500 potential Slightly longer term look at the S&P 500 if we see a further decline in price. This is a weekly chart and would need to see price decline by some 15% from the current level. Theres a few current catalysts that could contribute to such a move:
- US government shutdown comes to an end. The shutdown itself maybe wouldn't have the biggest market reaction but at the moment markets are trading in the dark with the absence of major US macro data so the eventual release of this data will cause some very big volatility, just a matter of seeing in which direction.
- We've seen some positivity in the geopolitical space and market were continuing to rally although it seems it's either priced in now or has been shrugged off, well see how goes through the remainder of trumps peace deal.
- We're also coming into Q3 earning and some of the big names have been massively helping to drive indexes higher. Any big misses or beats on earnings could also provide some big volatility, lots of stocks are propped up with high expectations so downside could be big on misses.
- Finally, market is still uneasy since that last tariff threat to China , confirmation on the end of this would also spread some good positivity in the equity space.
Any of these current drivers could have the potential to see price towards the weekly trendline or to breakout through ATH's again.
Depending on if you're taking a leveraged shorter term trade or an unleveraged ETF investment would determine how/when you enter on such a pullback.

Is SPX selling for a sell off Observation on SPX
1) Since 25TH April the SPX was bouncing on its 20 Ema . In fact if you bought every time SPX touched the 20 EMA you would have made money .
2) The 20 Ema acted as a support 6 times .
3) But notice the last three bounces were weaker and weaker .
4) 7TH time the 20 Ema broke with increasing volume .
Conclusion the probability of a break down is very high almost 75%
