Bitcoin - Sacrificed by the banks! (100k, then 130k - buy here)Bitcoin and the whole crypto market have been dropping heavily these days. And I know why! You may wonder, why is Bitcoin in such a weak uptrend, and why do the majority of altcoins never grow, or after a small pump, a huge dump follows? Finally, I bring you the answer to this important question man
Related coins

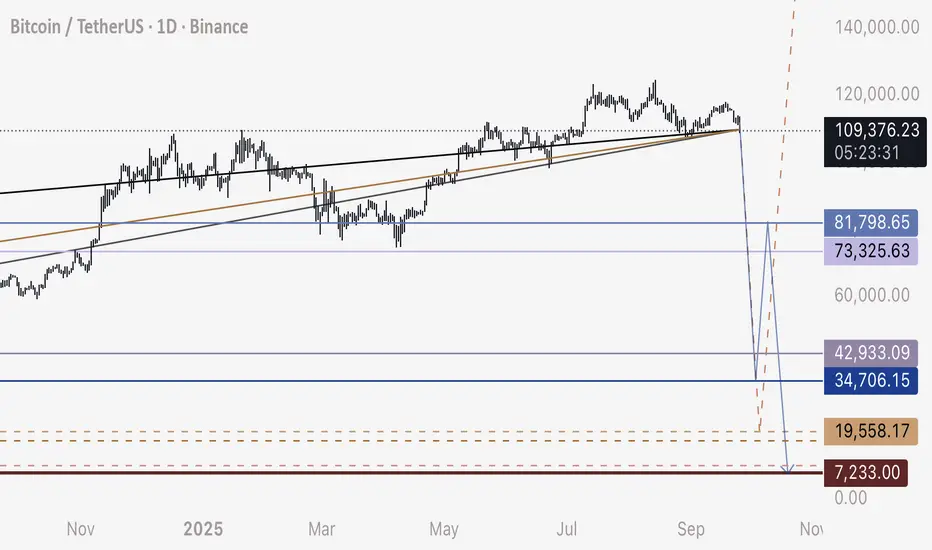
Bitcoin Short Update - Updated Targets and Corrective MoveHi all,
Short update on my BTC short - with updated numbers and anticipated zig zag correction.
I’m updating frequently because this drop will happen extremely fast. Only those who are prepared before hand will be able to take advantage.
110,000 to 35,000
35,000 to 81,000
81,000 to 8,000
Ta
BTCUSDT: Bearish Pressure Remains ? 👋Hello everyone, what do you think about the trend of BINANCE:BTCUSDT ?
Today, BTCUSDT is trading around 114,300 USDT, pulling back after once again being rejected near the strong resistance zone of 117,500 USDT and forming a descending price channel.
If selling pressure continues, BTC is like

BTC Breakdown: Watching 112.6K-113.5K for Rejection Toward 109kHello guys!
Trend Structure:
The price was moving in a clear ascending channel, but recently broke down below the lower boundary with strong bearish momentum. This confirms a structural shift from bullish to bearish sentiment.
Current Price Action:
After the breakdown, BTC attempted a relief rally

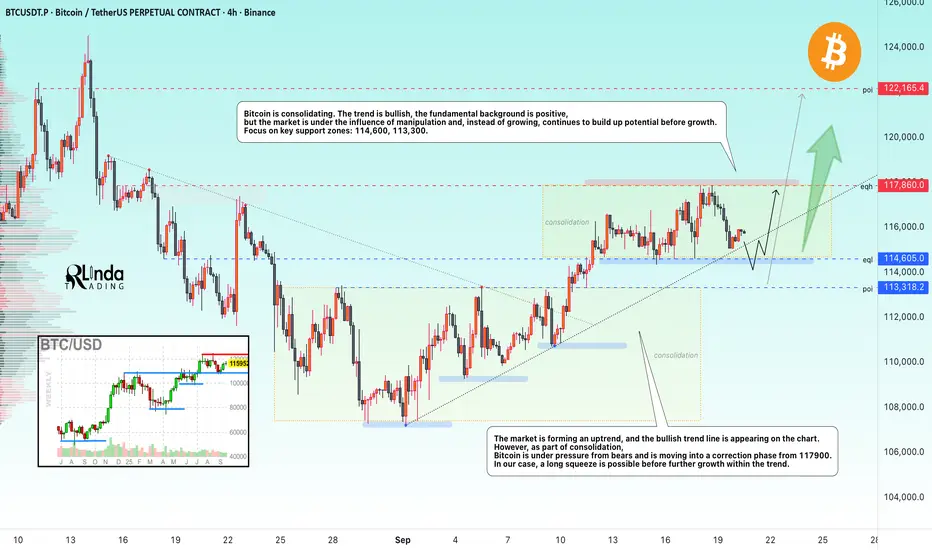
BITCOIN → Manipulation, long squeeze before growth BINANCE:BTCUSDT is in a global bullish trend. The fundamental background, following the start of interest rate cuts, is taking a positive turn, but instead of growth, the market is consolidating...
Bitcoin is showing resilience, trading within the specified trading range (above 114K) amid the
Bitcoin’s Next Big Move: Buy the Dip Before $138K!Hello guys!
Bitcoin is once again at a critical stage, and the chart is giving us a clear roadmap for the next move. Let’s break it down:
Current Setup
Price is holding above $108K–109K and has shown strength around the $103K support zone.
The structure remains bullish as long as BTC trades abo

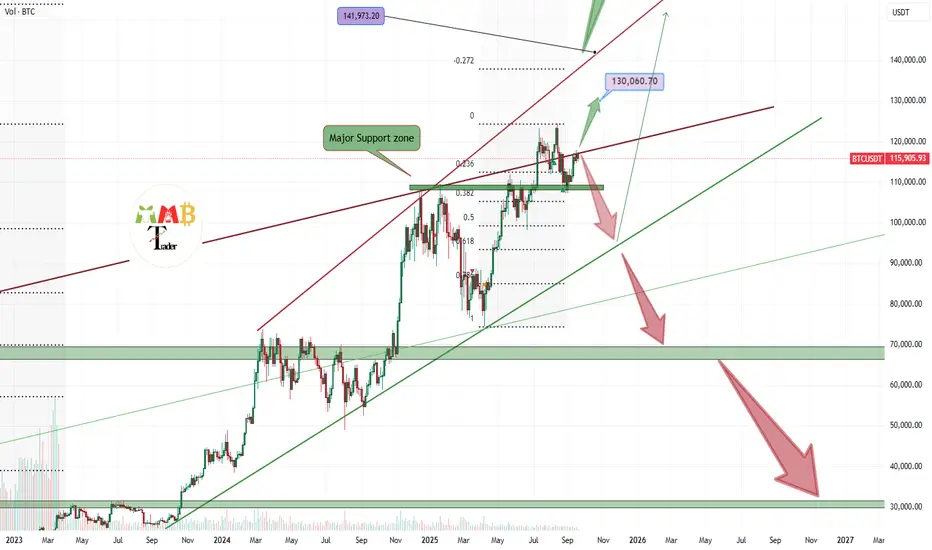
Bitcoin is struggling with 117K Resistance and may dumpAs we can see the chart is clear for the targets like 130K$ but only if the 117K$ resistance zone break to the upside else the market will see some boring range here or even short-term fall first and then near 100K$ support zone again pump will lead to new ATH.
DISCLAIMER: ((trade based on your own
Bitcoin (BTC/USDT): Uptrend ReinforcedHello everyone, after a brief pullback around 113,000 USD, Bitcoin has maintained its strength as it remains above the Ichimoku cloud – a clear signal that the uptrend has not weakened. The support zones at 111,000 USD and 110,000 USD are acting as crucial foundations, and if they hold, BTC could ea

BTCUSDTHello Traders! 👋
What are your thoughts on BITCOIN?
Bitcoin appears to be moving within a descending channel. Upon reaching the upper boundary of the channel, which coincided with the major resistance zone at 117,000 – 120,000 USDT (and the 61.8% Fibonacci retracement ), the price entered a correct

Bearish Setup in Bitcoin – Correction Before Deeper Drop?Bitcoin ( BINANCE:BTCUSDT ) started to decline and broke the ascending channel and Support zone($114,820-$113,170) with the help of the Bearish Flag Pattern , as I expected in the previous idea update .
Do you think Bitcoin can go below $105,000 !?
Bitcoin is once again approaching 100_E

See all ideas
Summarizing what the indicators are suggesting.
Oscillators
Neutral
SellBuy
Strong sellStrong buy
Strong sellSellNeutralBuyStrong buy
Oscillators
Neutral
SellBuy
Strong sellStrong buy
Strong sellSellNeutralBuyStrong buy
Summary
Neutral
SellBuy
Strong sellStrong buy
Strong sellSellNeutralBuyStrong buy
Summary
Neutral
SellBuy
Strong sellStrong buy
Strong sellSellNeutralBuyStrong buy
Summary
Neutral
SellBuy
Strong sellStrong buy
Strong sellSellNeutralBuyStrong buy
Moving Averages
Neutral
SellBuy
Strong sellStrong buy
Strong sellSellNeutralBuyStrong buy
Moving Averages
Neutral
SellBuy
Strong sellStrong buy
Strong sellSellNeutralBuyStrong buy
Displays a symbol's price movements over previous years to identify recurring trends.