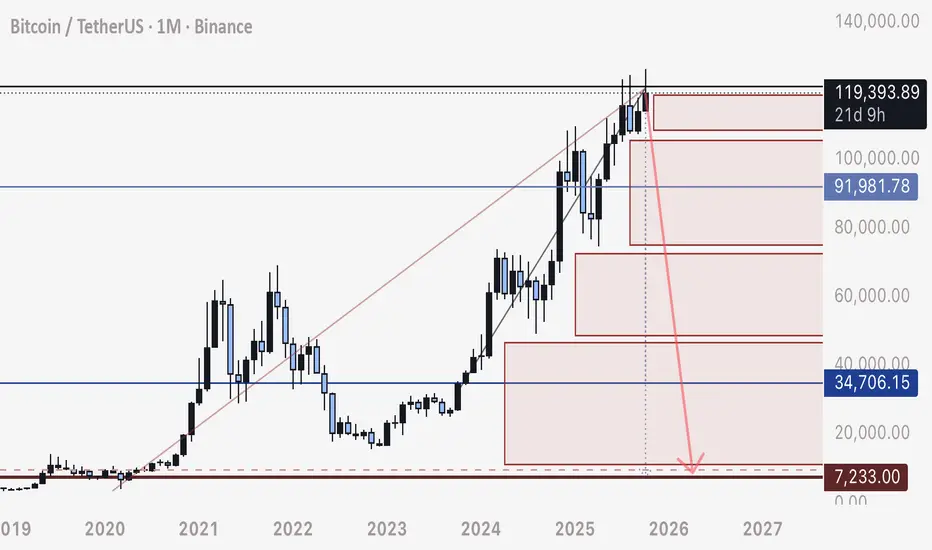
Why BTC will drop at EXTREME SPEED to 8,000This is a Segway off of all my recent posts, and here we will apply the same understanding of stop loss and liquidation order blocks to the 1 Month.
Bitcoin has been moving in a straight upwards consolidation with no actual retrace since Dec 2022.
What this does, is attract mass amount of stop loss orders, intact and left in place, through the whole movement.
These stop loss orders will create a natural cascading drop as they all fill, exponentially moving more and more liquidity out of BTC and into USD/ USDT.
Bitcoin will drop, at exceptional speed, and the chart tells us the whole story.
Be safe.
- DD
USTBTC trade ideas
$BTCUSDT Analysis - Oct 10 | 4H Time FrameBINANCE:BTCUSD Analysis - 4H
Hello and welcome to another analysis from the Satoshi Frame team!
I’m Abolfazl, and today we’re going to analyze Bitcoin on the 4-hour timeframe.
Bitcoin’s current all time high stands at $126,199!
Price has tapped into a demand zone, which could potentially trigger a bullish move toward this high.
This zone is worth the risk, and it’s recommended to look for buy positions on the 15-minute timeframe, targeting $130,000.
See you in the next analyses!
Stay tuned with the Satoshi Frame team...

BtcUsd - Decision Point SetupBTCUSDT is currently hovering around a key Decision Point, following a structure shift marked by a clear Change of Character (CHoCH) on the 1H timeframe. After the recent bullish correction during the Tokyo session, price is retesting the previous supply zone, which will decide the next directional move.
If price rejects from the Decision Point, we can expect a bearish continuation targeting the lower liquidity area around the Target Zone. However, a strong breakout and sustained momentum above this level could signal bullish intent, shifting market structure upward.
This area serves as a crucial confirmation zone for either continuation to the downside or reversal toward higher highs.

Bitcoin Consolidates Above Support — Main Trend IntactBitcoin (BTC/USDT) — Holding Strong Above Key Support Zones 💪
Bitcoin continues to trade above the low-timeframe support at $122,100, showing resilience and consolidation after its recent upward move.
✅ Low Time Frame Support ($122.1K): BTC remains stable above this short-term structure, suggesting buyers are still in control.
✅ Main Trend Support ($110.2K): The larger bullish structure remains intact as long as price holds above the $110.2K region.
📈 Momentum Outlook: A sustained hold above $122K could set up another push toward $126K–$130K, confirming bullish continuation.
Summary:
BTC remains bullish above both its low-timeframe and main-trend levels. Short-term consolidation is healthy, and the next breakout could target new local highs if momentum strengthens.
🎯 Support: $122.1K / $110.2K
🎯 Resistance: $126K / $130K
📊 Bias: Bullish continuation

BTC 1H Analysis - Key Triggers Ahead | Day 52☃️ Welcome to the cryptos winter , I hope you’ve started your day well.
⏰ We’re analyzing BTC on the 1-Hour timeframe .
👀 On the 1-hour timeframe, Bitcoin has broken through all major resistance levels, setting a new ATH, and then experienced a 2% price drop due to profit-taking and FOMO-driven selling. It then moved toward its key support zone around $122,584, bounced from there, and is now moving toward its early trigger zone at $124,113.
🧮 The RSI oscillator shows two important levels — 63 and 45 — and once the volatility threshold crosses especially above 63, Bitcoin could see a sharp increase in volatility, activating its triggers and enabling breakout moves.
🕯 Bitcoin’s volume has decreased after each touch of resistance, but now with a noticeable volume increase, our early trigger could become active, allowing Bitcoin to form larger, high-volume candles either upward or downward. Since the high-wave cycle remains bullish, the current scenario still favors upside continuation and resistance breakouts.
🧠 For Bitcoin positions, it’s better to wait for all confirmations to align — including activation of the early trigger, an RSI breakout above 63, and rising buy volume — before opening a long position.
❤️ Disclaimer : This analysis is purely based on my personal opinion and I only trade if the stated triggers are activated .

Pro-Level Pre-Market Setup & Pullback StrategyYou can have my analysis before any major market movement to capture setups in advance.
The drop from 126,000 to 101,000 could have been captured in the optimal way, securing real profits of several percent.
Now, you can also access the pullback analysis and take advantage of upcoming market opportunities.
To get this analysis, stay in touch with me.
BTC Price maintains higher lows and breaks above 114KBitcoin is currently consolidating around the 111K level, following significant market losses in October driven by escalating U.S.–China trade tensions. The price is down 9.45% on the weekly chart and remains 12.16% below its all-time high During this corrective phase, BTC appears to be stabilizing.
Technically, if BTC maintains higher lows and breaks above 114K, we could expect a potential shift toward a short-term uptrend targeting 116K–120K. Conversely, a break below 111K could expose further downside risk.
You may find more details in the chart.
Trade wisely best of Luck.
Ps; Support with like and comments for better analysis Thanks for Support.

GREAT FALL BTC.
we all know what happend and this great liquidity grabbing happend but WHAT NOW ??
i think this was just a begining of correction and started with good manipulation from whales i can't name them pls dont ask.
but as i checked they are controlling market and still selling btc in high prices to buy it again from 75K
"it's just good business"

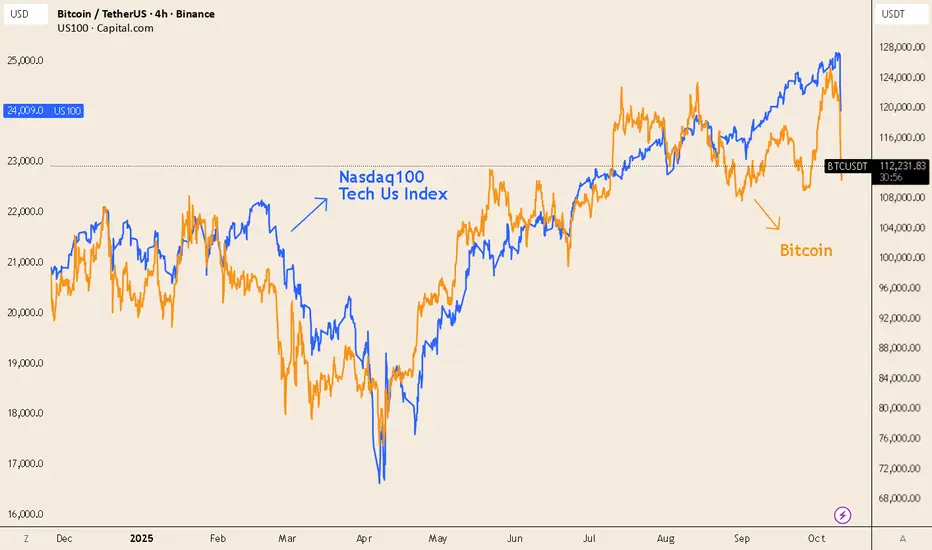
Bitcoin mirrors Nasdaq — still think it’s “uncorrelated”?💬 The myth of “crypto diversification” keeps circulating.
In reality, Bitcoin trades like a high-beta tech asset.
When the Nasdaq rallies — BTC amplifies it.
When the market panics — BTC dumps harder.
📈 Chart: BINANCE:BTCUSD (orange) vs NASDAQ:QQQ (blue) throughout 2025.
You can see how both move in the same direction, but BTC does it with much more volatility.
Correlation remains strong, especially during risk-off periods — the opposite of what a safe-haven asset would do.
BTCUSDT Potential Bullish opportunityAt this point, BTC jumped from a Key level FVG untested in months. TO me, its seems an AMD move into the key level. Lets see if it jumps

BTC/USDT Analysis. Moving Within the Scenario
Hello everyone! This is the trader-analyst from CryptoRobotics, and here’s your daily analysis.
Yesterday, Bitcoin followed the primary scenario, entering a correction almost immediately after the post was published. Just $200 short of the $120,400–$119,400 (absorption of selling) zone, we saw clear signs of buy-side defense and noticeable absorption of selling pressure on delta.
At the moment, the shorts remain the priority until the buyer’s zone is tested. If strong protection appears at that level, the initial upside potential is around $124,000.
Buy zones:
• $120,400–$119,400 (selling absorption)
• $116,700–$115,000 (pushing volumes, strong graphical imbalance)
• $112,500–$111,500 (mirror zone, volume anomalies)
• $110,000–$108,800 (strong selling absorption)
This publication does not constitute financial advice.

Monthly liq, back up to take weekend ShortsThe monthly opened with no wick.
It turns to a shooting star under 113k.
Somewhere there, it potentially goes back up to 123.5k+
Trying to short after a dump will likely get people burned if done too early.

Bitcoin looks bullish. Target is 126 500. The market had hunted $19 billion liquidation on October 10th. In particular, the 1 billion liquidation in Bitcoin, which was at prices between 107,000 and 108,000, was never taken. It was clear that it would be bought with a wick. Had the candle closed within this price range, we would have faced a lower bottom. This would have generated bearish momentum in the market. Now, we see hunted liquidation, rising lows, a green candle engulfing the last daily red candle, and the last red candle closing higher than the previous green candle on the weekly chart. In other words, the bullish market structure remains persistent.
Leave comment if you agree or not and write you opinion.

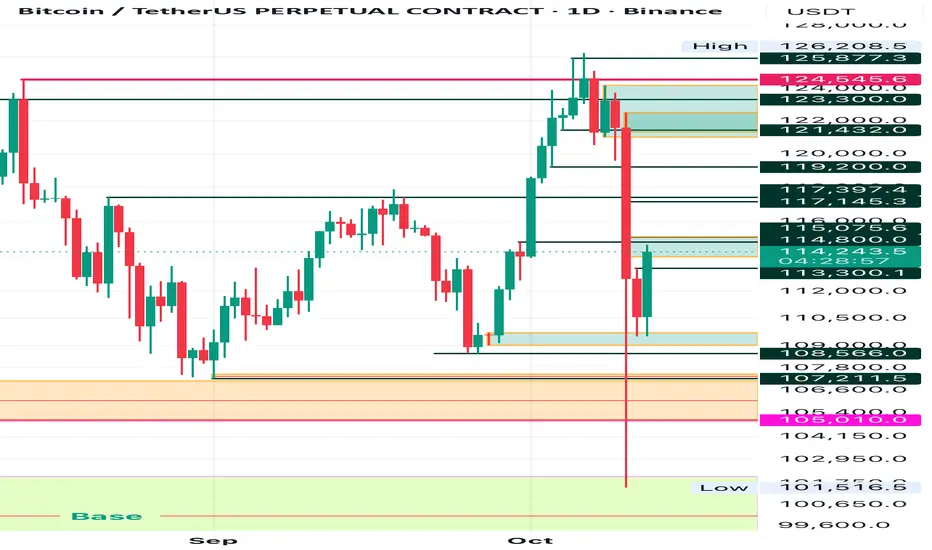
BTC 1D Analysis - Key Triggers Ahead | Day 54☃️ Welcome to the cryptos winter , I hope you’ve started your day well.
⏰ We’re analyzing BTC on the 1-Day timeframe .
👀 After the start of the trade war between the United States and China, news was released about a 100% tariff imposed by the United States on China. The crypto market experienced an unbelievable heavy drop (flash crash) last night, which from a technical point of view was completely unexpected and caused the biggest financial loss in the history of crypto.
👍 On the Bitcoin chart and in the daily timeframe, we can see that it is inside a very strong ascending channel, which even with last night’s drop has not closed below its channel body. Currently, Bitcoin is ranging with support at the bottom of the channel, and since it’s the weekend, the market volume has decreased sharply, and we are in a state of uncertainty until the new week’s open.
💡 Note that Bitcoin has not yet entered a trend reversal for the start of its heavy drop. The reversal zone that I specified in the analysis is between $108,960 and $107,521. With a break and confirmation below this zone, Bitcoin can experience a deeper correction and end its long-term primary trend and enter a secondary trend. We can also consider this zone as a distribution area.
Also note that Bitcoin’s return inside the channel has been supported by strong buyers, which has caused this uncertainty. In summary, Bitcoin has a very important resistance in the $114,351 zone, and with a break and confirmation above this area, it can move upward and turn the flash crash into a continuation move. In the continuation of the analysis, we will also use indicators and volume to reach the best conclusion.
🧮 In the RSI oscillator, we can see that after the selling pressure and increase in volatility, it moved downward and easily crossed the 50 zone. We have now defined two key RSI zones:
Zone 50 can be our long trigger area.
Zone 37, where if volatility passes below this level, Bitcoin can move toward the oversold area in its daily timeframe and experience a deeper correction.
🕯 First, let’s talk about volume — the selling pressure was so strong that it pushed the Bitcoin price near $102,000, and then it faced support from buyer makers (those who buy with market-type orders), which brought the price back above $110,000. The size of Bitcoin’s recent candle has been very strong and large, showing the great power of the sellers. With the increase in selling volume and continuation of the tariff war, the market can enter a risk-off state in higher timeframes, and investors may sell their Bitcoins, putting more selling pressure on BTC.
🧠 With the intensification of the tariff war between the U.S. and China, Bitcoin may start its secondary trend after weeks and months of bullish movement, but we still can’t make a definite decision about this issue. So we are waiting for the break of the defined zones in the analysis to make the best decision. Last night’s event was truly painful — a big experience and lesson for all of us that if we can manage our capital, we can have the best results relative to the market. However, last night will be remembered as the biggest financial loss in crypto history.
❤️ Disclaimer : This analysis is purely based on my personal opinion and I only trade if the stated triggers are activated .

BTC bullish shark harmonicAfter yesterdays $20 billion worth of liquidations it was time to zoom out a little.
Here I'm posting this bullish shark harmonic, yes, it doesn't look bullish considering what we witnessed yesterday and for me there was a lot of manipulation involved, directly after the CME closed we saw a massive liquidation event that not even your SL could save.
President Trump posted something on Truth Social about China holding countries to ransom for their rare earth minerals, now, we all know that Trump won't take that lying down and will obviously set tarrifs against China (at time of posting, this hasn't happened yet) once it does then we could see a further drop.
This shark harmonic is showing the way and a possible drop into the CME gap between $97k-$96k, at time of posting btc is currently at $111,770 which if given there's still a possible $15k drop to come, yesterdays liquidations saw btc dump around the same levels.....
This is only my thoughts and not financial advice
Stay safe......

BTCUSDT BULLISH -Was shocked when the market crashed; but its a good thing for me because the market completed a move that i thought that it would take a week or weeks.
-After the crash i looked for a neqw zone that i can enter as i saw that i missed the opportunity to enter when it touched the zone that i need.
-Im looking for a long position as ive seen a confirmation & im waiting for the push.
-Im looking for the market to go back to the entry zone & then push up.
-Lets see how this goes.

#BITCOIN ANALYSIS For the last 40 days I’ve been telling you #BITCOIN ANALYSIS
For the last 40 days I’ve been telling you guys I’m bearish on $BTC. We already dropped almost 8K twice, but every time Bitcoin reclaimed the levels again. Right now it’s trading around 18K to 119k but nothing has changed for me. I’m still bearish.
I’ve said many times that the 115K to 124K region is a short zone, not a long zone. If you’re still holding longs, I’d strongly suggest you flip to shorts because the chart is flashing multiple top signals.
Don’t get trapped by hype like “Bitcoin to 1 million by the end of this year.” That’s just noise. The structure is weak, liquidity is being engineered, and the bigger downside move is still ahead.
📌 Downside Targets:
105K → 100K → 95K → 90K

Next Volatility Period: Around October 14th
Hello, traders!
Follow us to get the latest information quickly.
Have a great day!
-------------------------------------
(BTCUSDT 1D Chart)
This volatility period is expected to last until October 4th.
Accordingly, the key question is whether it can find support near 119,177.56 and rise.
If not, and the price declines, support near 115,854.56 will be crucial.
If it finds support near 119,177.56 and rises, it is expected to challenge the Fibonacci ratio of 2.618 (133,889.92).
The key areas for maintaining an uptrend are:
- Short-term: 115,854.56-119,177.56,
- Medium-term: 104,463.99-108,353.0,
- Long-term: 87,814.27-93,570.28.
-
Thank you for reading.
We wish you successful trading.
--------------------------------------------------
- Here's an explanation of the big picture.
(3-year bull market, 1-year bear market pattern)
I'll explain more in detail when the bear market begins.
------------------------------------------------------


BTC; Aiming For A New (ATH) At $140k ?Bitcoin is set to break this resistance level and scale toward $140k before the year end. it have been moving within this momentum region of $109k-$123k for this couple of weeks, which we experienced a new ATH at $126k this week.
However according this structure our SMA 80 and SMA 200 the chances of this new ATH clearly high, also the "uptober" psychology actually nails the current market movement.
My fellow traders and investors do think we would see a plane climb to $140k by December..?
Like and share your thoughts
Thanks for reading.

BTC - All Important Trendlines and Liquidity ZonesAs of the current Bitcoin trend, I have outlined 3 key trendlines as well as the two major liquidity zones we need to keep an eye on right now.
The "Upper Resistance Trendline" has so far marked our three recent all time highs (red arrows). This has been a series of higher highs, which is normally a good sign in a bull market, the only problem is we are started to see some early signs of bearish divergence.
The "Middle Trendline" has acted as a key level mainly for the candle bodies. It has been a support/resistance flip level, but may have confluence in the future.
The "Lower Support Trendline" has acted as our three recent lows. It has helped to create a series of higher lows which is a good sign in an uptrend. The trend needs to maintain this series of higher lows, once we see the confirmation of this trend broken, the bear market will have begun.
Now let's focus on the two main liquidity zones right now.
The first is our "Important Liquidity Zone". This represents all the resistance that was built up from July-August 2025. Ideally, for this uptrend to continue to make new higher highs, this important liquidity zone is a crucial area to hold as a new support level. It ranges from $119.3k-$120.4k. A flip of this zone into new support would indicate that Bitcoin is ready for new all time highs. That is the first thing to watch for.
However, the "Middle Liquidity Zone" represents the $116k-$118k level. This level marked many support/resistance levels for our current trend. Therefore, if our main liquidity zone is breached this could come in confluence with our middle trendline.

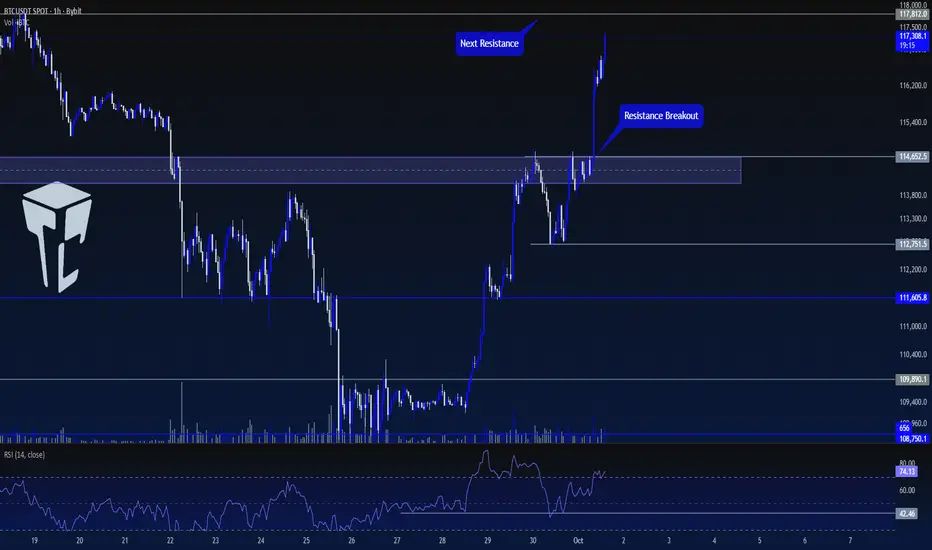
TradeCityPro | Bitcoin Daily Analysis #185👋 Welcome to TradeCity Pro!
Let’s move on to the Bitcoin analysis. Bitcoin’s bullish trend is still continuing, and today during the London session it made another upward move. Let’s review today’s triggers together.
⏳ 1-Hour Timeframe
Yesterday, after the correction, Bitcoin formed a bottom at 112751 and with the RSI being supported at 42.46, the upward move started.
🔔 The trigger we had yesterday for opening a position was the breakout of the resistance zone, with the exact trigger forming at 114652. After the breakout, the price started its second upward wave.
💥 The RSI oscillator has also entered the Overbuy zone, and the market momentum is fully bullish. The next resistance we have is at 117812.
💫 If the price reaches 117812 and the RSI exits the Overbuy zone, we can take profit on the position.
✅ For a new position, no fresh trigger can be given right now because the price is moving sharply upward, and opening any new position here would be considered risky with a high chance of hitting stop-loss.
📊 The area I expect the price to react to is 117812, but I will wait for the price to first build a structure before opening a position.
❌ Disclaimer ❌
Trading futures is highly risky and dangerous. If you're not an expert, these triggers may not be suitable for you. You should first learn risk and capital management. You can also use the educational content from this channel.
Finally, these triggers reflect my personal opinions on price action, and the market may move completely against this analysis. So, do your own research before opening any position.
BTC/USDT – Roadmap Toward $150K and BeyondIn previous analysis, we highlighted that BTC is in a re-accumulation phase, ranging above one of the most important trendlines of the current cycle. For more than 80 days, price has repeatedly tested this zone, each time showing strong bounces and rapid reactions, confirming the significance of this level.
This sustained consolidation above the “magic trendline” is laying the groundwork for the next leg into price discovery. Should BTC achieve a decisive close above the red resistance box, the roadmap points toward a medium-term target of $150K, with the potential to extend further toward the $222K zone as liquidity unlocks and trend momentum accelerates.
