Be careful with the continued downward correction.BTC Plan Analysis
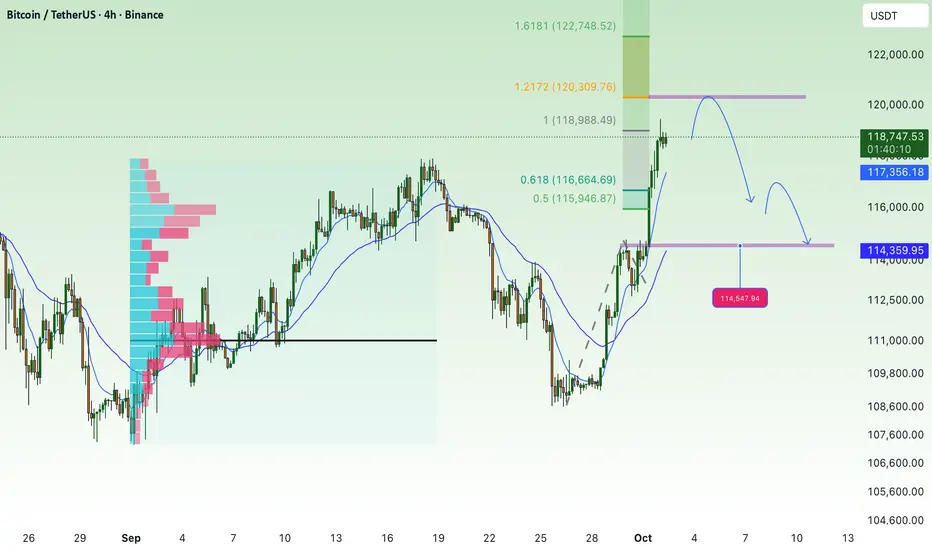
Currently, BTC has rallied strongly toward the 118,700 – 118,800 zone and is testing the 1.0 Fibonacci resistance. This area may trigger short-term profit-taking.
Main outlook: After a sharp rally, the market is likely to see a corrective move.
Key Levels
Resistance:
118,800 – 119,000 (near-term resistance, currently being tested)
120,428 (strong resistance on the higher timeframe)
122,500 (major resistance, extended wave target)
Support:
116,485 (Fibo 0.786, important confluence support)
114,837 (previous resistance turned support + EMA200)
114,150 – 114,050 (lower support, Fibo 0.236)
Possible Scenarios
BTC may face selling pressure at 118,800 – 119,000, leading to a correction back to 116,500.
If 116,500 breaks, the next support zone is 114,800 – 114,000.
If BTC holds above 116,500 and bounces, the market will likely retest the higher resistance at 120,400 – 122,500.
👉 Summary: Price is currently at short-term resistance. It’s better to wait for a reaction before making decisions. The correction toward 116.5K remains the primary scenario before the next clear move.
USTBTC trade ideas
Seller's waiting for liqudity trap #BitcoinHello traer's
here is your new analysis for bitcoin..
Watch carefully my chart and wait for Liqudity ..
Otherwise wait or Comment If you want to know about intraday move...

BTC/USDT Forecast: $110K – $150K Buy SetupBTC/USDT Forecast: $110K – $150K Buy Setup
Elliott Wave Count
The chart shows Bitcoin is moving in a 5-wave impulsive structure.
Waves (1), (2), (3), and (4) are already complete. Currently, the market is preparing for Wave (5) to the upside.
Typically, Wave (5) is the final bullish push after a corrective Wave (4). This means we are looking at a potential strong rally to finish the structure.
Market Structure & Channel
Price is respecting a rising channel (black trendlines). Each dip has found support along the lower boundary.
After consolidating around $120K, Bitcoin looks set to retest lower liquidity around $110K, which aligns with support and also the entry zone marked on the chart.
From this support, buyers are expected to step in and push price back to the upper channel line near $150K.
Entry, Stop, and Target
Entry Zone: $110,000 – $112,000
This area is marked as the ideal “buy zone” where the structure supports accumulation before the next leg up.
Stop Loss: Around $106,000 (below the channel and previous structure low).
Target: $150,000
This is the projected completion of Wave (5), aligning with the top of the channel.
Risk-to-Reward (RR)
Risk is roughly $4K–$6K per BTC (from $110K entry to $106K stop).
Reward is about $40K (from $110K to $150K).
That’s an RR ratio of around 1:7 to 1:10, which is highly favorable.
Psychological View
As a reader, this makes sense because the chart clearly shows the wave pattern and logical support/resistance zones.
Even if BTC dips first, the structure says it’s still bullish in the bigger picture.
The idea is simple: buy the dip into support (wave 4 low region) and ride the momentum into the final wave (wave 5).

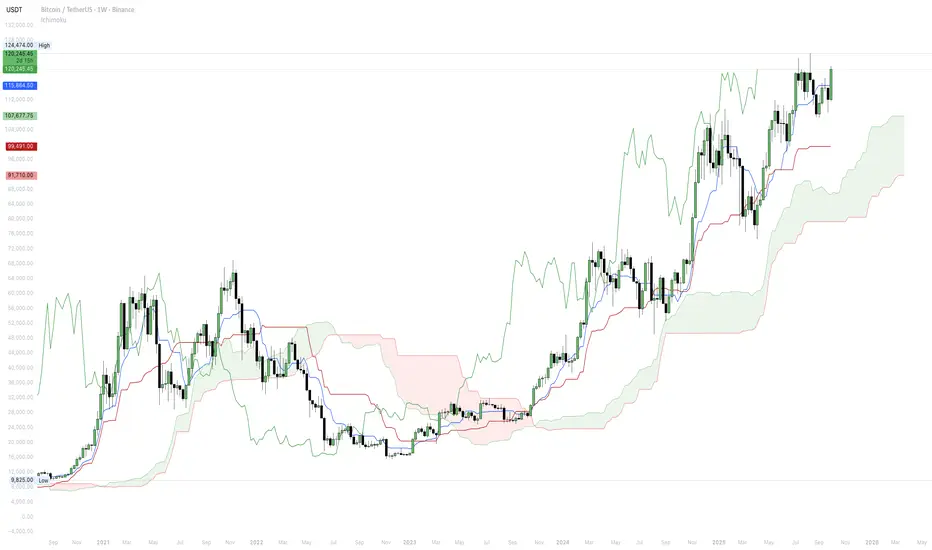
Understanding Ichimoku Cloud In Trading🔹 1. Introduction
What is Ichimoku Cloud?
Ichimoku Kinko Hyo translates to “one‑glance equilibrium chart.” It is a rules‑based charting framework that maps trend, momentum, support/resistance, and forward projections in a single overlay so traders can make decisions quickly and objectively.
What makes Ichimoku different?
All‑in‑one system: Measures trend, momentum, and structure without adding separate indicators.
Forward projection: The Cloud and Kumo twists project future support/resistance zones rather than only reacting to past price.
Equilibrium logic: Midpoint calculations emphasize market balance over raw averages, often reacting more cleanly to range boundaries and trend pullbacks.
Visual speed: Color/position relationships produce a high‑signal, low‑clutter read—hence “one glance.”
🔹 2. History
Ichimoku was developed by Goichi Hosoda , a Japanese journalist who published under the pen name Ichimoku Sanjin. Between the 1930s and the 1960s, Hosoda and a team of assistants tested price and time relationships by hand, iterating toward a framework that could summarize market balance quickly without sacrificing structure. His work combined price, time, and wave ideas into a practical template that traders could learn and apply on paper charts.
The well‑known numbers—9, 26, and 52—come from the historical Japanese trading calendar, which used a six‑day trading week. More importantly, they create a short‑medium‑long cadence that preserves the internal geometry of the system, helping Tenkan/Kijun interactions line up with Cloud behavior and Chikou confirmations across many market regimes.
Ichimoku remains relevant because it projects future structure, scales across timeframes, and adapts well to liquid markets from equities and futures to forex and crypto. Even in a high‑frequency world, traders still respond to visible structure, and the Cloud makes that structure explicit ahead of time.
🔹 3. Benefits
Ichimoku reads trend, momentum, and structure in one glance. Trend shows in where price sits relative to the Cloud and in the ordering/slope of the spans (Span A over Span B and rising is healthy). Momentum appears in the Tenkan–Kijun relationship—their distance and angle—and in how quickly price reclaims Tenkan after a pullback. Structure is revealed by flat Kijun and flat Span B “magnet” levels that price gravitates to, plus Cloud thickness, which hints at how much “effort” the market needs to break through.
Because states and invalidations are predefined, visuals become rules you can trade: a close back inside the Cloud flags rising risk; Chikou clearing past highs removes nearby resistance; and entries are higher quality when Tenkan and Kijun align with a supportive, rising forward Cloud (often after a Kumo twist).
The method scales cleanly from intraday to weekly and across assets. Many traders set bias with the higher-timeframe Cloud—only looking for longs when price is above a rising Kumo—then drop a timeframe to time entries as Tenkan/Kijun cross or as price retests Kijun from above.
🔹 4. Components
Tenkan‑sen (Conversion Line): midpoint of the last 9 periods
In a healthy trend, price frequently “breathes” around Tenkan—pulling back to it, briefly piercing it, then resuming in the trend direction. The slope of Tenkan reflects the pace of the move: a rising, well‑angled Tenkan suggests persistent buying pressure, while a flattening Tenkan signals short‑term balance. Tenkan often acts as dynamic support/resistance; repeated successful retests are a sign of momentum continuity, and repeated failures warn of loss of impulse.
Tenkan = (Highest High(9) + Lowest Low(9)) / 2
Kijun‑sen (Base Line): midpoint of the last 26 periods
Where Tenkan tracks impulse, Kijun represents the balance point of the dominant swing. Price tends to revert to Kijun after expansions, making it both a magnet and a filter. A rising Kijun with price holding above it confirms trend maturity; a flat Kijun often marks the range midline and a probable retest level. Many traders trail partial risk below Kijun in uptrends (or above it in downtrends) because losing Kijun typically precedes deeper mean reversion.
Kijun = (Highest High(26) + Lowest Low(26)) / 2
Senkou Span A (Leading Span A): average of Tenkan and Kijun, plotted 26 periods forward
Span A represents one boundary of the Kumo and reflects the average of the Tenkan and Kijun lines, making it more responsive to recent price action and a dynamic indicator of short-term trend direction.
Span A = (Tenkan + Kijun) / 2 → shifted +26
Senkou Span B (Leading Span B): midpoint of the last 52 periods, plotted 26 periods forward
Span B forms the opposite edge of the Cloud and is calculated from a 52-period high-low average, creating a flatter, more stable line that often acts as strong support or resistance due to its representation of longer-term equilibrium.
Span B = (Highest High(52) + Lowest Low(52)) / 2 → shifted +26
Kumo (Cloud): the filled region between Span A and Span B; thickness visualizes volatility/“equilibrium buffer.”
The shaded area between Senkou Span A and Senkou Span B on the Ichimoku chart. This "cloud" represents areas of support and resistance, with its thickness indicating market volatility and the strength of the equilibrium zone. A thicker Kumo suggests greater uncertainty and stronger price buffers, while a thinner Kumo indicates weaker support/resistance levels and reduced volatility.
Chikou Span (Lagging Line): current close plotted 26 periods back; confirms alignment between current price and past price structure.
Chikou plots the current close 26 periods back. When Chikou is above prior price and above the Cloud, the path ahead is typically “clear,” confirming bullish conditions. When it collides with past highs, lows, or Cloud edges, those features often act as retroactive obstacles; trades pressed directly into them carry lower odds and may require reduced size or patience for a cleaner setup.
Chikou’s value is in context: it keeps you from buying breakouts that immediately smash into last month’s resistance or shorting into well‑defined support. Alignment of Chikou with price and the forward Cloud turns a visual impression into a rule.
🔹 5. Interpretation
How to rate signal quality?
Tenkan–Kijun cross (TK cross). A bullish TK cross occurs when Tenkan rises above Kijun; a bearish cross is the reverse. Crosses above the Cloud are strongest (trend‑aligned), inside the Cloud are neutral (higher noise), and below the Cloud are weakest for longs (and strongest for shorts). Cross quality improves when the forward Cloud agrees (Span A over Span B for bullish) and when Chikou has clear space.
Chikou confirmation of breakouts. A breakout through a level is more trustworthy when Chikou is through and beyond the corresponding historical barrier. If Chikou is pinned beneath old highs while price breaks out, expect retests or false starts.
Cloud breakouts and edge‑to‑edge logic. Breaks into or out of the Kumo carry more weight when the Cloud is turning (twist forming) and sloping in the trade direction. After a confirmed entry, price often traverses from one Cloud boundary to the other—especially when Span B is flat and acts like a target.
Kumo as future balance point. The forward Cloud is a projected equilibrium. Flat spans, especially Span B, frequently attract price; thick areas behave as buffers, thin spots as gates. Reading these shapes ahead of time lets you plan scenarios rather than react.
Multi‑timeframe alignment. Expectancy improves when the higher‑timeframe Cloud sets the bias and the lower timeframe supplies timing. For example, seek longs only when the daily is above a rising Cloud, then use a 1‑hour TK recapture or Kijun retest as the trigger.
🔹 6. Understanding the Kumo (Cloud)
Kumo as Support/Resistance
The Kumo is formed by the space between Senkou Span A and Senkou Span B projected 26 periods into the future. When price approaches the upper edge from below in a bearish regime, that boundary acts like resistance; when price descends onto the lower edge from above in a bullish regime, it often acts like support. Markets frequently hesitate, wick, or retest at these edges because they represent the consensus midpoint of prior swings carried forward in time.
A thick Kumo implies a broad equilibrium buffer: price needs more energy to pass through, so reactions, pauses, or partial rejections are common. A thin Kumo implies a narrow buffer: price can pierce and switch sides with less effort, which increases the odds of swift transitions. Flat sections—especially where Span B is flat—often behave like shelves that attract price before it decides the next leg.
Kumo Twist (Senkou Span A crosses B)
A Kumo twist occurs when Span A crosses Span B in the forward projection, flipping the Cloud from bullish to bearish or vice versa. Because the spans are derived from midpoints, the twist is an early signal of changing balance rather than a guarantee of immediate reversal. It often appears while price is still inside the prior regime, and its reliability improves when accompanied by Kijun flattening, Tenkan/Kijun compression, or a Chikou approach to historical barriers.
Trading before the twist can offer better entries but carries the risk of false starts if momentum doesn’t follow through. Trading after the twist sacrifices the first part of the move but benefits from confirmation—especially if the forward Cloud begins to slope in the new direction and price is already reclaiming or rejecting Kumo edges.
Kumo Breakouts
A Cloud breakout occurs when price closes out of the Kumo and holds that side on retests. A bullish breakout is a close above the upper boundary; a bearish breakout is a close below the lower boundary.
Quality improves when the forward Cloud agrees (Span A over Span B for bullish, the reverse for bearish), the Cloud is thinning or already thin at the breakout point, and Chikou is simultaneously through the corresponding historical structure.
False breakouts are common when the Cloud is thick and flat or when Chikou immediately collides with past highs/lows. Requiring a retest of the breached edge (turning resistance into support or vice versa) greatly improves expectancy, as does ensuring that Kijun is supportive (price holding above it in bullish contexts).
Thin vs. Thick Kumo
Thin Kumo generally reflects compressed ranges, fast transitions, and fragile trends. Breaks through thin spots tend to be quick but can reverse just as quickly if the rest of the system (TK alignment, Chikou, forward slope) doesn’t confirm. Thick Kumo reflects broader ranges and sturdier trends; passing through requires more energy, but holding the new side is more durable once achieved.
You can think of width as a volatility filter: thin zones favor momentum pops and tactical trades; thick zones favor patience, staged entries, and giving the market room to breathe. Many traders normalize Cloud width by price or compare it to ATR to judge whether conditions suit breakout‑style entries or mean‑reversion fades.
🔹 7. Strategies Using Ichimoku
Kumo as Support/Resistance
This strategy uses Cloud edges as forward support/resistance. In an uptrend, pullbacks into the upper Kumo edge or into a flat Span B shelf often create decision zones; if price rejects the edge and recaptures Tenkan, the trend is likely intact. The opposite applies in downtrends.
Entries typically trigger on a rejection close away from the edge or on the next bar that reclaims Tenkan. The stop sits outside the Cloud (beyond the pierced edge) to account for wicks. Expectancy improves when the forward Cloud thickens and rises (showing durable support) and when Kijun is rising beneath price. First targets are the recent swing extreme or the next flat Span B; if the bounce begins inside the Kumo, an “edge‑to‑edge” move toward the opposite boundary is a reasonable objective.
High‑probability conditions: clear trend, supportive forward slope, and a bounce forming near a flat Span B rather than in the middle of a thin, twisting Cloud.
Tenkan–Kijun Crossovers (TK Cross) in Context
Crossovers are context tools, not standalone signals. A bullish TK cross (Tenkan above Kijun) that occurs above the Kumo with a bullish forward slope and Chikou clearance is the strongest variant.
The same cross inside the Cloud is neutral, and below the Cloud is weak for longs (but strong for shorts in the opposite case). Early traders may take a cross below the Cloud when a twist and reclaim are imminent, but expectancy is lower without Cloud support.
A practical sequence is: establish bias from the Cloud, wait for the TK cross in that direction, then demand either Chikou clearance or a clean retest before committing full risk. Stops belong beyond Kijun or the most recent swing that defined the cross.
🔹 8. Key Takeaways
Ichimoku is a market framework, not a signal tool
Ichimoku is designed to map equilibrium and project structure forward. Read it as a context engine: the Cloud sets regime and bias, Tenkan/Kijun express momentum and mean reversion, and Chikou verifies that the path ahead is clear. Decisions come from states and transitions—price vs. Kumo, span ordering and slope, TK alignment, and Chikou clearance—rather than from any one line crossing another. This is why the same template scales from intraday to weekly charts and across asset classes: you are reading the same language of balance, impulse, and structure.
The synergy between components is the edge
Edge emerges when the system agrees with itself. A TK cross is more than two lines intersecting; its quality depends on where it occurs relative to the Cloud, how the forward Kumo is sloped, and whether Chikou has cleared historical obstacles. Kijun provides risk structure and often serves as a dynamic stop or trailing guide; flat Span B and flat Kijun act as magnets and targets. When these elements line up—Cloud bias, TK timing, Chikou clearance, supportive forward slope—you have a trade worth taking. When they don’t, the right move is usually patience.
Best practices checklist
Use this short checklist to standardize your process and reduce discretion.
Start with bias: Price relative to the Kumo and forward slope sets long/short/neutral.
Demand confluence: Take signals when TK aligns with forward Cloud and Chikou shows clearance.
Trade level‑to‑level: Plan entries/exits around flat Span B/Kijun shelves; they are natural magnets.
Prefer break‑and‑retest: After a Cloud or key‑level break, wait for a retest and hold before sizing up.
Avoid thick/flat Kumo: Stand aside or de‑risk when the Cloud is thick and horizontal; that’s chop territory.
Use multi‑timeframe logic: Let the higher timeframe set bias; take lower timeframe triggers in that direction.
Place stops beyond structure: Use Kijun or the Kumo edge instead of arbitrary ticks; give room for wicks.
Scale and trail methodically: Take partials at Span B/Kijun targets; trail from Kijun → Tenkan as momentum builds.
Size by volatility: Calibrate with ATR or relative Cloud width; widen stops and reduce size around twists.
Let Chikou veto: If Chikou is about to collide with past highs/lows, delay or reduce risk.
Treat Ichimoku as a map — the Cloud defines the terrain, TK tells you when to move, and Chikou checks that the road is clear. When the framework is not aligned, stand down. Trade only when the map, the timing, and the clearance agree; manage risk using the Kijun and the Cloud edges; and let neutrality be an acceptable outcome when the forecast is foggy.
$BTC Lower highs....too early to celebrateBTC gets a golf clap today for wedging itself from 3 days of staying flat and doing nothing. Zooming out, we're seeing something a little different. Downward channel, and price movements swinging back and forth. Mid-week with the gov shutdown, we may see a bit pull down below 110k. This short squeeze does not compensate for the ~10% drop we've been seeing.

BTC LAST CALL BEFORE TAKE OFF??!!This area should be the last opportunity for entry before we might see the biggest bull run in the history (institution + retail FOMO). 115-116K might be a sweet spot for entry before BTC continues the rally.
DYOR ! NFA
-MaxVesting

Let Bitcoin make a new ATHHi traders,
My outlook on Bitcoin last week was wrong and I'm the first to admit it. I can't be 100% right. So we move on to the next possibility.
Last week Bitcoin went up very impulsive from out of nowhere due to fundamental news.
Now let price make a new ATH and wait for the (corrective or impulsive) move down to take a trade.
Let's see what the market does and react.
Trade idea: Let price make a new ATH and wait for the (corrective or impulsive) move down to take a trade bullish or bearish.
If you want to learn more about trading FVG's with wave analysis, please make sure to follow me.
This shared post is only my point of view on what could be the next move in this pair based on my analysis.
Don't be emotional, just trade your plan!
Eduwave

Drop to $111,000Divergence is seen in the RSI and the buyers' strength is not enough to break through the resistance level. The price will drop to the level of $111,000.

BTC.D & BTC TOPI feel strongly that this next higher high will be BTC’s last. Hopefully BTC.D can support our alts, because BTC looks done.

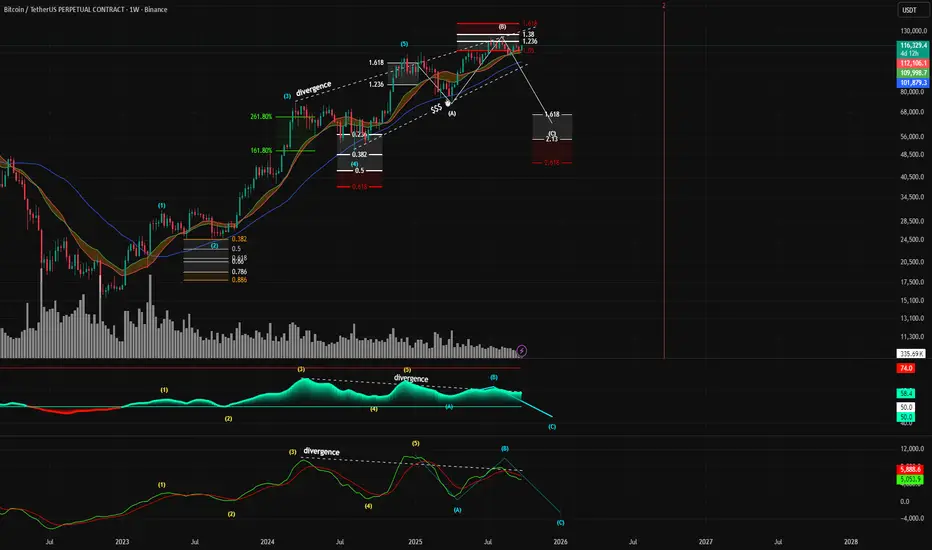
Expanding Flat Elliot wave countBitcoin may be approaching a significant macro top, with multiple technical indicators aligning to signal a potential reversal and a subsequent major corrective wave.
Key Projections:
Potential Top Formation: The current price action is forming what appears to be the peak of a corrective Wave (B), with a potential top range between $109,000 and $150,000.
Projected Corrective Target: Following the completion of Wave (B), a significant downward move, labeled as Wave (C), is anticipated. This corrective wave targets the $45,000 - $67,000 price zone.
Timeline: The entire corrective structure, from the formation of the top to the potential bottom of Wave (C), is projected to unfold by approximately September 2026.
Elliott Wave Structure: The primary thesis is based on an Elliott Wave count. The chart indicates the completion of a five-wave impulse cycle, and the market is now in a larger A-B-C corrective pattern. The current price is likely forming the peak of the B-wave.
Fibonacci Confluence: There is a strong confluence of Fibonacci extension levels at the potential top. The peak of the current Wave (B) is precisely testing the 1.618 Fibonacci extension level, a critical ratio often associated with the termination of corrective waves.
Significant Bearish Divergence (Crucial Point): This is one of the most compelling signals on the chart.While the price is making higher highs (from the peak of wave (5) to the peak of wave (B)).Both the RSI and the MACD indicators are showing lower highs. This is a classic, multi-indicator bearish divergence on a high timeframe (weekly), indicating that the upward momentum is weakening significantly and a trend reversal is becoming more likely.
Bloody October ?Always manage your own risks this is not a investment advise, I am not responsible neither your loss nor profit.

BTCUSDT Potential ShortHello Traders,
BTCUSDT Potential reversal here for some big move, if this level respect it and doesnt cross 121k.
Thanks,
Minters

BITCOIN SIGNAL: LEVERAGE DRIVEN PUMP! (where it ends??!)Yello Paradisers! Enjoy the video!
And Paradisers! Keep in mind to trade only with a proper professional trading strategy. Wait for confirmations. Play with tactics. This is the only way you can be long-term profitable.
Remember, don’t trade without confirmations. Wait for them before creating a trade. Be disciplined, patient, and emotionally controlled. Only trade the highest probability setups with the greatest risk to reward ratio. This will ensure that you become a long-term profitable professional trader.
Don't be a gambler. Don't try to get rich quick. Make sure that your trading is professionally based on proper strategies and trade tactics.

Bitcoin : Stay heavy on positionsBitcoin : Stay heavy on positions (2x~3x)
Maintaining the same outlook as before.
** This analysis is based solely on the quantification of crowd psychology.
It does not incorporate price action, trading volume, or macroeconomic indicators.

Shorting BTC.2-Month on BTC is closing and it doesn't look great. Monthly is getting rejected as well. Daily currently as of now doesn't look good. Taking a short position.

BTC speculation and Key levels So BTC Today reach around 118,000k.
Like I said yesterday it was possible, if BTC will be strong.
We still bullish , at 118,000 we bounce, but still can go up.
I speculate that son we can go bit lower before go back to 124,000ATH.
IF we will go lower, then two key price places, where we can stop or reverse:
115,500(fib 0.618) or Structure POC 112.700.

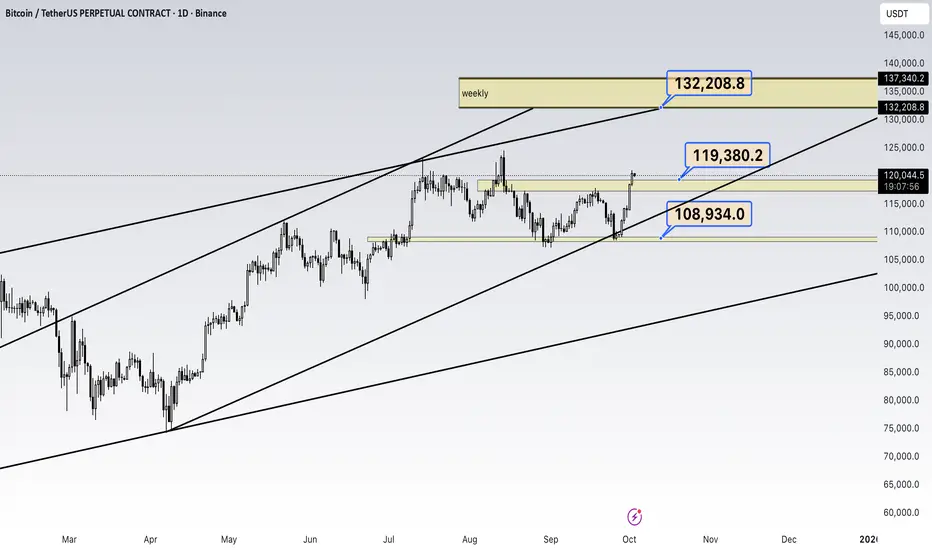
What is the next level in Bitcoin?On weekly timeframe, we had a macro liquidity on 109.000$ that made the chart to move to 119.000$ level. If the price firm on this level in weeky timeframe, it can go to the next level that is 132.000$
Bitcoin’s Next Big Move: Buy the Dip Before $138K!Hello guys!
Bitcoin is once again at a critical stage, and the chart is giving us a clear roadmap for the next move. Let’s break it down:
Current Setup
Price is holding above $108K–109K and has shown strength around the $103K support zone.
The structure remains bullish as long as BTC trades above $100K.
Strategy
1- Entry zones for buying:
Current market price (~$109K)
Support zone around $103K (a good second chance for buyers).
2- Stop-loss: Around $99K, just below the psychological and structural support of $100K.
3- Target: Upside potential points toward $138K , which aligns with the next major resistance zone.
⚠️ Risk Factor
If BTC breaks below $100K, the bullish phase ends, and we should expect a bearish shift in momentum. In that case, caution and defensive trading will be the smarter play.
📌 Conclusion
For now, the play is simple:
👉 Stay bullish and buy dips while BTC is above $100K.
👉 Watch the $103K zone for re-entries.
👉 Protect your capital with a $99K stop-loss.
👉 Aim high-> the next big target sits around $138K.

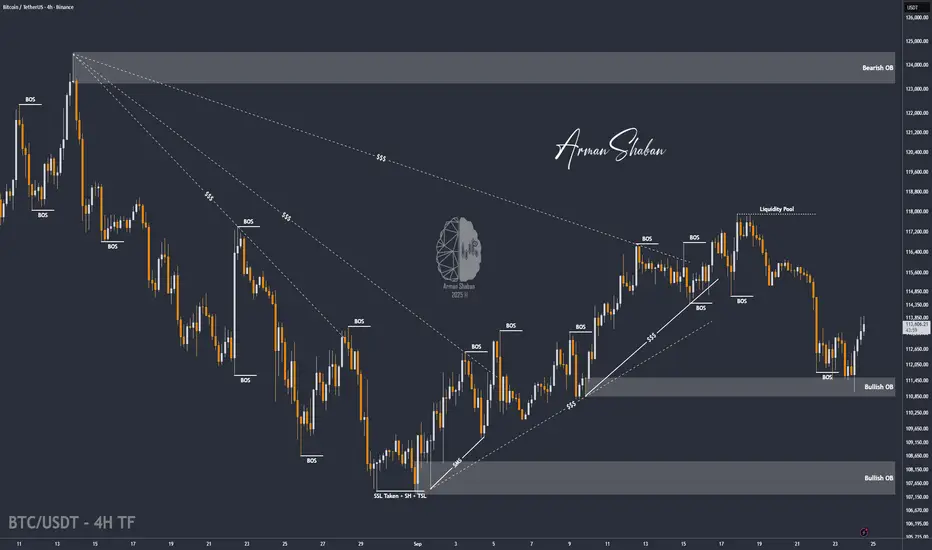
BTC/USDT | BTC Bounce After $111K Dip – Liquidity Gap in FocusBy analyzing the Bitcoin chart on the 4-hour timeframe, we can see that after a heavy correction down to $111,000, the price found demand again and is now trading around $113,600.
I expect Bitcoin to continue rising to fill the liquidity gap, with the first target at $114,150. Other targets and scenarios will be shared tomorrow!
Please support me with your likes and comments to motivate me to share more analysis with you and share your opinion about the possible trend of this chart with me !
Best Regards , Arman Shaban
MY BTC LONG TERM BIAS $90k - $75kIts obviously obvious green candle chaser will sooner or later get trashed because they fail to understand that the green candles we are currently seeing are as a result of the USDT Dominance taking a break to the downside.
From experience, when the USDT Dominance take a mild dive, BTC only gets a few thousands in aapreciation.
But when table turns, the outcome is always alarming.

BtcusdtShari g on tradingview and
*20 leverage 220% is easy .
Yeah nailed again more follow more like more money......
#btcusdt #altcoinseason #memecoins

BTCUSDT LongBullish points
1. Support area
2. Daily breaker block
3. Tested 0.68 fib level of last
aggresive buy leg
4. Hidden bullish divergence
5. Price above Bull market
support band

BTC - Last Attempt to Call the TopBitcoin has been rising the last few days - presumably for a bearish retest.
It doesn’t make sense for the market to continue going up with so much liquidity left to the low zones - and DXY showing support for a 3-5 year bull market on Bitcoin and Equities.
Since I’ve had this wrong many times, I will responsibly resign the idea if this one fails to play out. This will be my last signal for this flash crash idea, which I do still firmly believe will play out.
We are now back to the original entry of upper zone as listed in posts with the similar price level being hit.
The black dashed lines show anticipated 3 wave correction - and the trade plan below details that movement.
Alternately short can be held all the way from Trade 1 into Trade 3 (no hedge long)
Trade 1 - Short
Entry - 119,600
Stop Loss - 123,000
Target 1 - 97,000
Target 2 - 68,000
Target 3 - 44,000
Trade 2 - Long (Hedge with Short still Open)
Entry - 35,500
Stop Loss - 33,000
Target 1 - 44,000
Target 2 - 53,000
Target 3 - 85,000
Trade 3 - Short (DCA long hedge profits or re-entry)
Entry - 88,000 to 90,000
Stop Loss - 95,000
Target 1 - 62,000
Target 2 - 23,000
Target 3 - 10,000
God bless and good luck to everyone.
