130k is incoming .By carefully examining the chart and applying Elliott Wave theory, we can see that Bitcoin has begun its primary fifth wave from the 107,000-dollar range. The first and second sub-waves of Wave 5 are complete, and we should now watch for the third sub-wave of Wave 5.
I believe Bitcoin will soon set a new record.
First target: $118,000
Second target: $120,000
USTBTC trade ideas

Bitcoin long monthly closeJust went long on bitcoin. Aiming for $116000.
I think the monthly candle likely will close as a bullish engulf or attempt to close bullish on the monthly around $116000 area
Sl: 112952
Tp $116000


The range zone will break to the upside and heavy gain after We set our entry on 110K$ and stop loss is below the range zone support because the pattern of fall may happen again but i think soon that 110K will touch again and we would have a breakout to the upside and confirmation of that is 110500$ touch but we open earlier and near 110K because i want signal with 1:2 R:R(RiskReward) just like what you can see on chart so we risk a little bit and open this signal on 110K and below 113K we are out to save some profit.
DISCLAIMER: ((trade based on your own decision))
<<press like👍 if you enjoy💚

BTC EQL sweep then movement higherI’m looking at the highlighted equal lows, ideally expecting a sweep and then possibly a retest of the marked imbalance around the 104K level in the first half of the week.
From these levels, I’d like to see a strong reaction and a return back into the range to target the build-up of shorts, possibly with a move above the established highs or at least towards the ~120K area.

U.S. GOVT SHUTDOWN.WHAT HAPPENED?After Senate Republicans and Democrats failed to reach an agreement on a new continuing resolution Wednesday, the U.S. government shut down for the first time since 2019. Leaders from both parties issued statements blaming each other, and President Trump has threatened to fire more federal workers during the shutdown.
Social security payments will continue to be made, and active duty members of the U.S. military will continue to be paid. But many other government agencies will be forced to close their doors and cease operations until a new budget bill is passed by Congress.
Why it Matters
The government shutdown will affect tens of thousands of federal employees, hundreds of government agencies, and millions of people in the United States who rely on those agencies for a wide range of services. Most federal workers will be placed on leave without pay for the duration of the shutdown, and if President Trump follows through on his firing threats, for some of those workers, the shutdown could be the end of their government service.
According to the Washington Post, the lapse in funding for the federal government means crucial government functions, from small business loan services to national parks to job training for veterans, will be halted until lawmakers pass new budget legislation. Federal work deemed essential for national security will continue.
Wednesday’s budget impasse created the twenty-second federal government shutdown in the past fifty years. The longest government shutdown lasted thirty-five days in 1995, and the shortest shutdown lasted less than one day. Thus far, leaders in both major political parties have given no indications they are ready to make concessions. Cuts to health care were at the center of the dispute this time, just like they were during the 2013 shutdown, which lasted sixteen days.
The reason for the shutdown is the lack of a normal budget process in Congress. Rather than passing a budget to cover the costs of government operations for an entire fiscal year, Congress has gotten into the habit of using continuing resolutions to fund the government. A continuing resolution is a temporary measure to keep the government funding for a set period of time, but rather than being used as a stopgap measure, they have instead become the norm.
Using continuing resolutions to fund the government is at the root of much of the dysfunction in the federal government. Because without a normal budget, many agencies have no choice but to adapt their operations to the provisions of the temporary funding bills, which can curtail and interfere with normal procedures.
Will this Impact the Market ?
1. Safe-Haven Assets like Gold and BTC prices often rise during shutdowns as investors seek refuge.
2. USD Fluctuations: The U.S. dollar might weaken initially, reflecting risk-off sentiment.
3. Delayed data like the Non-Farm Payroll (NFP) report and other Economic reports.
Historical Context
Past shutdowns have had limited long-term effects on equities if resolved quickly. However, prolonged closures (like the 35-day shutdown in 2018-2019) introduced volatility and eroded confidence.
Potential Outcomes
- *Brief Shutdown*: Minimal lasting impact, historically common.
- *Extended Shutdown*: More pronounced negative effects on GDP growth and confidence.
- *Resolution*: Markets often recover swiftly once funding is restored.
Overall, the impact depends on the shutdown's duration and the broader economic context.

BTC/USD) Bullish trend analysis Read The captionSMC trading point update
Technical analysis of BTC/USDT (4H timeframe) chart analysis:
---
Bullish Bitcoin Setup
Trendline Breakout: Price has broken above the descending trendline, signaling a shift from bearish to bullish momentum.
Order Block (OB): Price retraced into the order block (yellow zone) around 112,200 – 113,000, showing demand holding strong.
Moving Averages:
50 EMA (red) has crossed above the OB zone.
200 EMA (blue) is acting as dynamic support, strengthening the bullish case.
Price Action: After retesting the OB/EMA confluence, price is expected to continue higher.
---
Target Point
119,953 (≈120,000 psychological level) is the upside target.
This aligns with the next major resistance and the projected extension of the bullish breakout.
Mr SMC Trading point
---
Trading Idea
Bias: Bullish.
Entry Zone: Retest of 112,500 – 113,000 (OB + EMA support).
Target: 119,953.
Invalidation: A breakdown below 112,000 would weaken the bullish scenario and suggest continuation of the downtrend.
Please support boost 🚀 this analysis

BTCUSD NEW OUTLOOK According to H1 analysis BTCUSD market going in buy pressure from last couple of days wait for great opportunity now market will be touch the RESISTANCE ZONE so we have opportunity to go sell from here be careful use money management
TRADE AT YOUR OWN RISK
REGARD ALBERT

Bitcoin growthlook this chart
whithout tecnical
auto_awesome
Translate from: Persian
Just a simple look.4How is it possible that this chart does not grow?

BITCOIN DAILY upwards towards $130,000!1). Rate cuts have begun! 2). ABC correction still in progress with MACD convergence. 3). Volume is fading! 4). Risk Assets are positive across the board!
23 minutes ago
Note:
I've been analyzing charts for over 20 yrs. as my strategies "trend" to be very accurate! A lot of effort goes into this, so please consider a "Boost".

Bitcoin Reclaims Point of Control as Bulls Target New ATHBitcoin has confirmed a runaway gap on CME futures while reclaiming the point of control on Bybit. This shift turns resistance into support, setting the stage for a potential run to new highs.
Bitcoin began the week with powerful momentum, building on weekend lows to reclaim a major resistance level on futures charts. The confirmation of a runaway gap and strong close above the point of control have strengthened the bullish outlook, raising expectations for further expansion.
Key Technical Points:
- Bitcoin closed above the point of control (POC), turning it into support.
- Runaway gap on CME futures confirmed, boosting momentum.
- Dips below POC likely to be bought, indicating demand.
The CME futures chart highlighted a runaway gap that has now been confirmed, often signaling strong continuation in the dominant trend. On Bybit futures, Bitcoin followed through by closing above its long-time resistance at the POC, a decisive technical shift that suggests buyers are regaining control.
As long as the POC remains a support base, dips beneath are expected to find demand, reinforcing the bullish structure. This structural development provides a clear path for price to challenge and potentially surpass its all-time high.
What to Expect in the Coming Price Action:
Bitcoin remains highly bullish above its point of control. If support holds, momentum favors continuation toward a new all-time high, with market demand underpinning the move.

New Bullish Trend Is About To Start 📈 Currently, Bitcoin is forming an ABCDE structure, and it seems that wave E has completed around the 108,500 level. I expect a new bullish trend to begin with a breakout above the 108,000 level toward a 127500 and 133k

Bitcoin False breakout a bullish longer-term correction phaseBitcoin’s price has recently broken below a key trendline support despite a generally positive fundamental backdrop and an ongoing bullish longer-term trend. This suggests that the market may currently be undergoing a counter-trend correction phase.
One contributing factor to this short-term weakness appears to be the decline in U.S. interest rates, which has unexpectedly had a negative impact on the cryptocurrency market as a whole.
From a technical perspective, I have identified several important levels:
A breakout and confirmed close above this level could signal renewed bullish momentum and potentially trigger a positive market reaction. and there target will be 113K to 118K
You may find more details in the chart.
Trade wisely best of Luck.
Ps; Support with like and comments for better analysis Thanks for Supporting.
BTCUSD NEXT POSSIBLE MOVEBitcoin has shown a strong bullish push recently and is now facing resistance at the top. From here, one of the key possible scenarios is a rejection leading to a corrective move toward the lower support zone.
If sellers gain momentum at this level, the market could shift into a downward move, testing important demand areas. However, if buyers continue to hold strength, the uptrend could sustain longer before any major pullback.
Market is currently at a crucial point — watch closely for confirmation before entering. Both directions hold potential, but probability favors a short-term correction unless strong bullish pressure breaks through resistance.

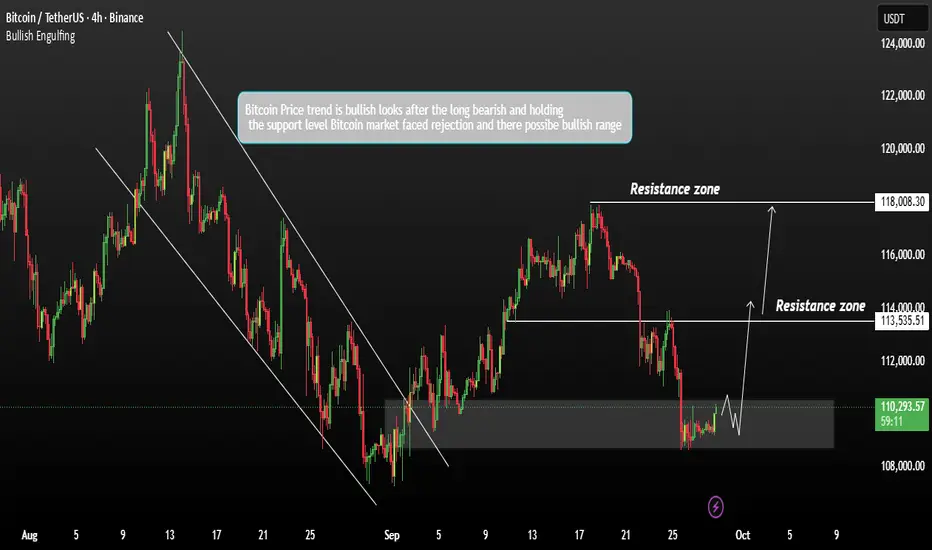
Bitcoin Bounces Strongly from Key Support – What’s Next?🔎 Technical Outlook (BTC/USDT, 4H):
1. Key Support: Bitcoin held the 110K – 112K zone, a historically strong demand area that triggered a solid rebound.
2. Channel Breakout: Price has broken out of a short-term descending channel, shifting momentum in favor of the bulls.
3. Immediate Resistances:
• First resistance: 115.5K – 116K
• Next major resistance: 118K – 120K (upper channel boundary)
4. Scenarios:
• 🟢 A confirmed breakout above 115.5K opens the path toward 118K → 120K.
• 🔻 Failure to clear resistance could trigger another pullback toward 112K or even a retest of 110K.
📌 Summary: Bitcoin has defended its major support and is showing bullish momentum in the short term. However, the upcoming tests at 115K+ will decide whether this move evolves into a stronger rally or just a corrective bounce.

$BTC BULL RUN RALLY & Showing a WOLF PATTERN 2025Road to Bull Run 2025, price Growing upward movement starting at $108K — $115K — $122K — 128K — $136K Who Entry at $111K and using $100K stoploss.
Bitcoin trades near $116,200, rebounding from $109,000. A close above $117,500 may boost buying, while rejection could trigger profit-taking. Key support is at $113,000. Traders are anticipating a 99% chance of a 25 basis points rate cut at the next Federal Open Market Committee meeting, which is viewed as favorable for Bitcoin. Bitcoin surged past $116,000, rising nearly 3% in a single day, following the U.S. government shutdown.
Key facts: Bitcoin trades near $116,200, rebounding from $109,000. A close above $117,500 may boost buying, while rejection could trigger profit-taking. Key support is at $113,000.
#Write2Earn #BinanceSquareFamily #Binance #BTC☀ #SUBROOFFICIAL
Disclaimer: This article is for informational purposes only and does not constitute financial advice. Always conduct your own research before making any investment decisions. Digital asset prices are subject to high market risk and price volatility. The value of your investment may go down or up, and you may not get back the amount invested. You are solely responsible for your investment decisions and Binance is not available for any losses you may incur. Past performance is not a reliable predictor of future performance. You should only invest in products you are familiar with and where you understand the risks. You should carefully consider your investment experience, financial situation, investment objectives and risk tolerance and consult an independent financial adviser prior to making any investment.

Continue uptrend if..."Continue the uptrend as the price remains strong after breaking through the zone."

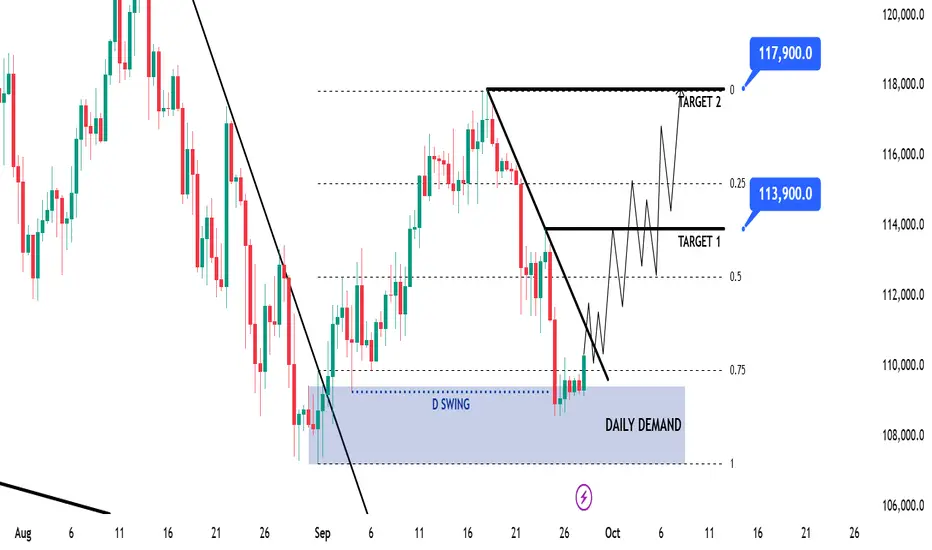
BTC Game Plan – (LDMD Model)BTC Game Plan – (LDMD Model)
📊 Market Sentiment
FED has resumed its rate-cutting cycle, starting with a 0.25% cut in September, with two more expected. Institutional liquidity inflows have accelerated as the U.S. officially adopts crypto as part of its reserves. Despite elevated inflation, a weakening labor market is forcing the FED to ease, pushing more capital into risk-on assets.
📈 Technical Analysis
BTC is trending strongly bullish on the HTF, so long setups remain the priority. Recently, price broke the bearish trendline that had capped price action since August 13, signaling a shift in momentum. That breakout created a Daily Demand zone, which was tapped once before price moved higher — confirming liquidity inside the zone.
Currently, BTC ran the daily swing low (the first tap of that demand), revisited the Daily Demand, and repriced into the 0.75 Fibonacci max discount level. This strong confluence suggests accumulation and potential continuation higher.
📘 Model to be used – LDMD (Liquidity Run inside Daily Demand w/ Max Discount Zone)
In this model, I start by confirming the HTF trend to set directional bias. Then, I identify key Demand/Supply zones that carry significant liquidity. A sweep of HTF swing lows adds confluence by trapping liquidity. Finally, I align this with the 0.75 max discount retracement zone for a high-probability entry point.
📌 Game Plan
1-Wait for a daily close above the bearish trendline.
2-Enter long on confirmation.
🎯 Setup Trigger
Daily close above the bearish trendline.
📋 Trade Management
Stoploss: 108,500$
Targets:
TP1: 113,900$
TP2: 117,900$
After TP1, move SL to breakeven to secure profits.
💬 Like, follow, and comment if this breakdown supports your trading! More setups and insights coming soon — stay connected!
⚠️ Disclaimer: This content is for informational and educational purposes only and does not constitute financial, investment, or trading advice. Always DYOR before making any financial decisions.
Impulse Wave 5 Near Completion: Short Setup Ahead?The 5th wave of the current impulse structure is close to completion. Price action is showing exhaustion and the drop in volume is confirming that momentum is fading. At this stage, risk for longs is increasing and the probability of a corrective phase (A-B-C) is high.
Traders should keep an eye on bearish confirmation signals such as trendline breaks, bearish engulfing bars, or supply zone failures. A short setup could develop soon if price rejects with conviction.
Patience is key — Wave 5 can stretch, but once it’s done, downside pressure usually accelerates quickly. Manage risk carefully and adjust sizing according to your strategy.

btc shortWe had a 4H buy-side sweep above 118.1k followed by rejection. This confirmed the short idea from earlier.
What Happened:
Price ran external liquidity above the 4H high (118.1k).
Immediate rejection → confirmed it was a liquidity grab, not continuation.
A Fair Value Gap (FVG) formed on the 15m during the rejection. Price traded back into it and respected it, offering optimal short entry.
Now we’re breaking lower, with sell-side liquidity levels in sight.
Current View:
Structure: Bearish on 15m after sweep + BOS (Break of Structure).
Order Flow: Premium short entry confirmed with FVG mitigation.
Bias: Looking for price to seek lower inefficiencies and equal lows.
Targets Ahead:
🥇 116.8k → first liquidity pool (just got tagged).
🥈 115.8k → inefficiency fill.
🥉 115.5k → deeper liquidity run.
Invalidation:
If BTC reclaims 118.2k, the bearish thesis is invalid.
⚡This is textbook ICT: 4H BSL sweep → M15 market structure shift → FVG entry → downside targets.

#BTC Rising Wedge📊#BTC Rising Wedge📉
🧠From a structural perspective, we are within the target zone of a bullish pattern and near the previous high. Therefore, chasing the rally here is not recommended. If you want to enter a long trade, consider the support near the rising trend support line. If we break through the h D point directly, the next strong resistance level will be around 120,000.
➡️From a chart perspective, a rising wedge may be forming here. If the lower edge of the wedge is broken, bearish expectations will increase.
🤜If you like my analysis, please like 💖 and share 💬
BITGET:BTCUSDT.P

$BTC BTC/USDT Analysis (Daily Timeframe)
Chart Pattern
A double bottom pattern has formed around 109,000 – 110,000, which often signals a strong bullish reversal as buyers defend the same support level twice.
Key Levels
Main Support: 109,000 – 110,000 (double bottom area).
Immediate Resistance: 118,000 – 120,000 (currently being tested). A breakout above this level will confirm the double bottom reversal.
Upside Target (TP): Supply zone around 127,000 – 130,000.
Bullish Scenario
If price holds above 114,700 – 115,000 (minor support after breakout), BTC has the potential to continue toward 118,000.
A confirmed breakout above 118,000 – 120,000 will open the path toward 127,000 – 130,000.
Bearish Scenario (Alternative)
Failure to break 118,000 – 120,000 and a drop back below 114,700 may lead BTC to retest 110,000 support.
A breakdown below 110,000 will invalidate the double bottom and expose BTC to further downside below 105,000.
Conclusion
The structure currently favors the bulls with the double bottom pattern in play. As long as 110,000 holds, the medium-term outlook remains positive. A breakout above 118,000 – 120,000 would confirm the bullish bias and set the stage for a move toward 127,000 – 130,000.

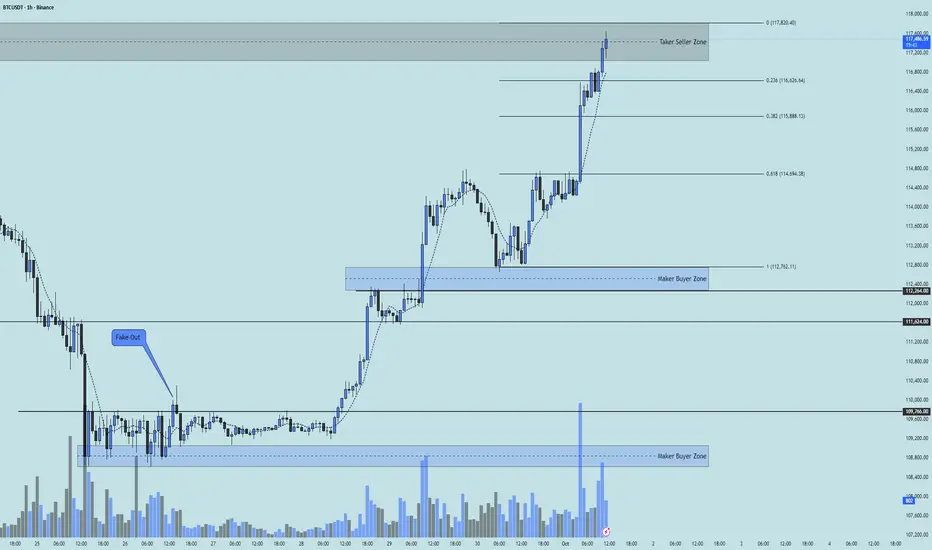
BTC 1H Analysis - Key Triggers Ahead | Day 49❄️ Welcome to the cryptos winter , I hope you’ve started your day well.
⏰ We’re analyzing BTC on the 1-Hour timeframe .
👀 On the 1-hour chart , After a strong bullish rally and breaking the $109,766 zone, BTC managed to move toward $117,000. This level is considered a multi–timeframe daily resistance, and personally I expect a correction here. The second bullish leg, which started after breaking the $111,624 resistance and buyers' micro support at $112,762, is now facing weakness. RSI is also showing reversal signals. The current BTC scenario is a correction toward the marked Fibonacci zones. The upcoming resistance is extremely important, and if it breaks, Bitcoin can continue upward.
🧮 Looking at the RSI oscillator, during both bullish legs it managed to stay firmly in overbought territory, and long-position volatility has significantly increased along with rising buy volume. On the 1H timeframe, RSI doesn’t have a specific key level right now because it has hit a significant swing resistance on the daily timeframe. Breaking out of the marked zone can push BTC higher. This key swing level on the daily RSI is around 61.
🕯 Volume, count, and size of bullish candles have sharply increased. Considering we are sitting at a resistance zone, traders are putting in maximum effort to break it, and volume is rising aggressively. Every sell candle that formed was engulfed by buyers immediately as BTC dipped, and buyers created new positions. Our trend is strongly bullish.
🎮 The Fibonacci is drawn from the start of the new bullish leg to the top of the previous 1H candle's wick. It has identified strong support zones in case BTC corrects, and these levels are considered highly reliable.
📊 The Bitcoin liquidation heatmap currently shows the distribution of short positions, and this spread continues up to $119,000. With upward movement and buyer support, these clusters can get absorbed and liquidated, leading to a short squeeze and a strong move up. Note that the cluster of short liquidations down to $113,000 could get triggered with maximum selling pressure, and this scenario isn’t far-fetched.
🧠 If you haven’t entered a BTC position based on previous analyses, you can wait for corrective support zones to form. Buyer tickers will place their orders below these support levels so we can gain full confirmation before making a BTC entry.
↗️ Long Position Scenario: A break above the seller ticker zone and grabbing accounts holding short positions is required to reduce short-position clusters. Then we need confirmation above our seller ticker zone at $117,820. With the start of a new bullish leg and an indecision candle plus a 7 SMA touch from below, we can open a low-risk long position.
📉 Short Position Scenario: If BTC forms a lower high and lower low with maximum selling pressure, negative economic news, and loses key Fibonacci zones — especially the 61% level — we can consider opening a short. However, as I mentioned in previous days, avoiding shorts and focusing on longs is currently much more in our favor.
❤️ Disclaimer : This analysis is purely based on my personal opinion and I only trade if the stated triggers are activated .