Daily Bitcoin Signal: Sell , target 110KBitcoin is currently showing signs of strength as it tests the key resistance level around 113,500.
A confirmed 1H candle breakout this zone could trigger fresh bearish momentum, opening the door for lower targets in the short term.
My Personal Long Setup
If the price breaks and closes a 1H candle under 113,500, I will enter a sell position.
🎯 Target 1: 112,000
🎯 Target 2: 110,000
❌ Stop-loss: 115,200
👍 Don’t forget to boost this trading idea if you found it helpful,
and follow me for more daily crypto insights and trade setups.
⚠️ Please note:
This is not financial advice – I’m only sharing my personal trades.
Always do your own research before taking action.
Best of luck 🌹
USTBTC trade ideas

Forecast for BTCUSDT 30th September 2026My projection / guess for BTC for the current week. Continuation to ~$115k followed by a retrace to ~$110k then continuation up to ~$117k followed by a huge dump.

Forecast for BTCUSDT 30th September 2026 My projection / guess for BTC for the current week. Continuation to ~$115k followed by a retrace to ~$111k then continuation up to ~$120k followed by a huge dump.

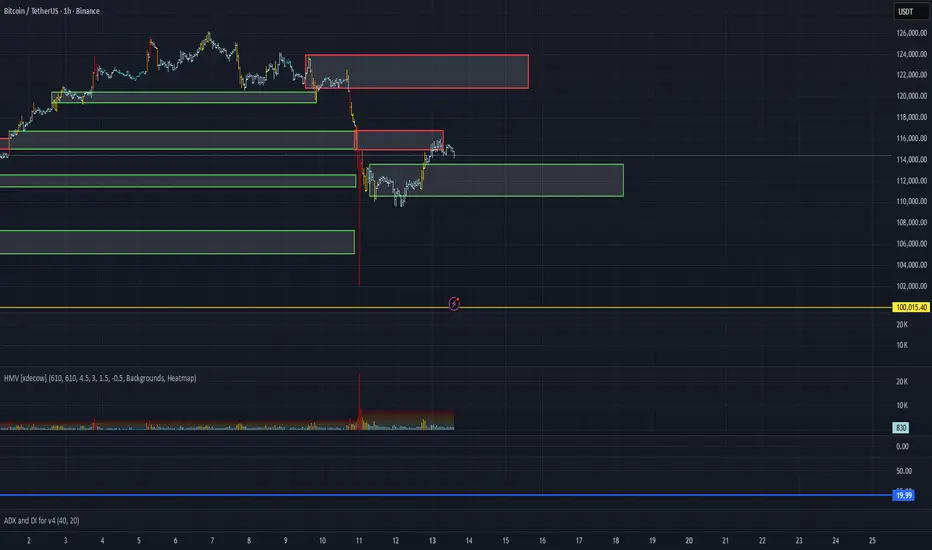
BTC Update – Monday, 29.09.2025🚀 BTC Update – Monday, 29.09.2025 🚀
Bitcoin gave us some real fireworks over the weekend! 🎇 After hunting stop losses on both buy and sell sides, price quickly reversed and pumped back into the zone of indecision.
📌 In my last analysis, I mentioned two key levels:
* 113,460
* 116,310
Last week, BTC broke downside of 113,460, which was the first confirmation of a downtrend wave. But guess what? The market didn’t confirm the breakout – instead, price snapped back up, showing that bulls are still alive and fighting! 🐂🔥
👉 My view remains the same:
* If BTC breaks above the Yellow Line (Arrow #1) → we enter super bullish mode 🟢 and momentum can explode higher.
* If BTC fails to break and gets rejected from there → we could see a drop towards 100K 🔻.
* On the higher time frame, BTC is still in a range between Arrow #1 and Arrow #3. Until one side breaks cleanly, we stay patient and let the market decide the real direction.
💡 Reminder for all traders: Sometimes the best trade is no trade. Let the price confirm – don’t rush. Patience = Profits! 🧘♂️💰
⚡Stay focused, stay motivated, and remember – market shakeouts are designed to test weak hands. Strong hands win in the long run. 💪🔥

BtcusdtBears have the momentum in the weekly , no news other than saylor buying btc 😂 on the monthly bulls buying pressure is getting weak . I think the market will hit 100k in the coming weeks

My view on BTCBitcoin has shown renewed strength in momentum after tapping into a strong support zone.
From a structural standpoint, price first printed a lower low, then followed with a higher low, which is a classic signal of improving momentum and potential trend reversal.
If price can break decisively above the 117,900 level with high volume, I think it opens the path for BTC to rally into the order block near the all-time high.
🎯 Conclusion: My outlook leans bullish — the shift from a lower low to a higher low highlights building momentum, and a break above 117,900 with strong volume would likely accelerate the move toward the upper order block. Still, markets are unpredictable, and this is only my view.
👉 For more structured market insights and professional analysis, follow along.

BTC/USDT Bearish Trend analysis Read The captionSMC Trading point update
Technical analysis of BTC/USDT (4H timeframe) chart analysis:
---
Bearish Bitcoin Setup
Trend: The market is clearly in a downtrend, with price respecting the descending channel.
Fair Value Gaps (FVG): Two FVG zones are highlighted where price retraced to fill imbalances.
Moving Averages:
50 EMA (red) and 200 EMA (blue) are above price, confirming bearish momentum.
Key Resistance: Price is currently retesting the FVG supply zone around 111,000 – 111,500, which aligns with the descending trendline.
Rejection Expected: If sellers defend this zone, price is likely to continue its bearish trajectory.
---
Target Point
A measured move suggests a potential drop towards 106,218 (next support / target zone).
This aligns with the channel’s lower boundary.
.
Mr SMC Trading point
---
Trading Idea
Bias: Bearish.
Entry Zone: Around 111,000 – 111,500 (FVG supply & trendline confluence).
Target: 106,218.
Invalidation: A breakout above 113,000 (200 EMA) would weaken the bearish setup.
---
Please support boost 🚀 this analysis

BTC Accumulates in Downtrend - CorrectionBTC Analysis
BTC is currently moving in line with the broader trend structure. After a strong bearish leg, the price reacted precisely at the 108k demand zone, rebounding sharply by around +4,000 points. This confirms that buyers are still actively defending this critical level.
At present, BTC is trading near 112k, with the next resistance levels to watch at 113,925 – 116,132. A short-term bullish continuation into these zones is possible, but strong selling pressure is expected there.
If the price fails to hold above the 113k – 114k area, a pullback toward the 109k demand zone could follow. A deeper bearish continuation would then likely target 106k – 106.2k, which aligns with the next key Fibonacci extension and a major support area.
Key Notes:
• The broader trend remains intact; buyers successfully defended 108k.
• Watch resistance at 113.9k – 116.1k for potential reversal signals.
• Key support zones: 109k (demand) and 106k (major target).

BITCOIN SIGNAL: MOST PEOPLE ARE DOING THIS NOW (wrong)Yello Paradisers! In this video, we are going through multi-timeframe analysis on Bitcoin as professional traders. We are using advanced technical indicators, and we are properly analyzing with an Elliot Wave perspective. We are digging deep into the sub-waves and structure. Enjoy.
And Paradisers! Keep in mind to trade only with a proper professional trading strategy. Wait for confirmations. Play with tactics. This is the only way you can be long-term profitable.
Remember, don’t trade without confirmations. Wait for them before creating a trade. Be disciplined, patient, and emotionally controlled. Only trade the highest probability setups with the greatest risk to reward ratio. This will ensure that you become a long-term profitable professional trader.
Don't be a gambler. Don't try to get rich quick. Make sure that your trading is professionally based on proper strategies and trade tactics.

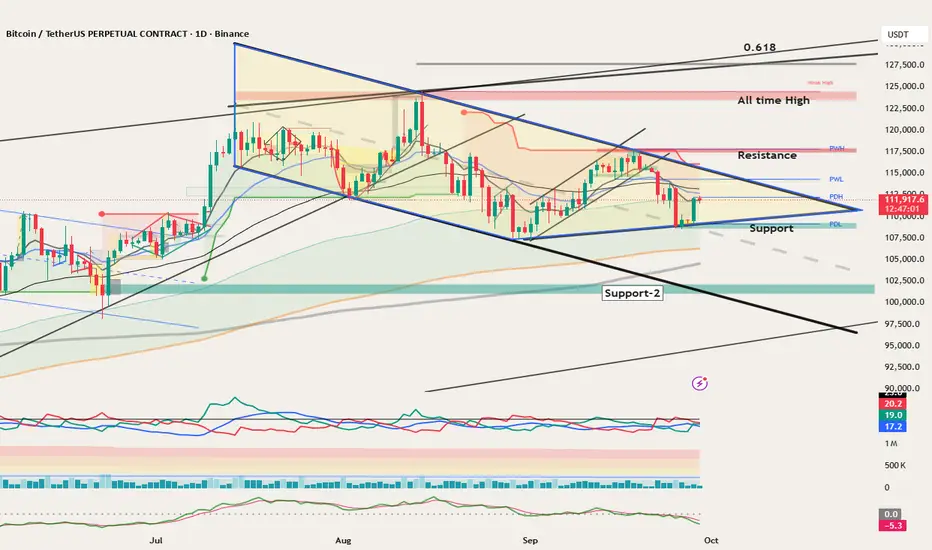
BTC coiling within daily triangle at 112k – watch 110k support aBTC/USDT daily chart shows price compressing inside a large symmetrical triangle, trading near $112K. With upcoming catalysts (NFP Oct 3, CPI Oct 15, FOMC Oct 28–29), the next breakout could set the trend.
BTC has formed lower highs since July and higher lows since June, creating a wedge. Recent support is at 108,723, with deeper support near 101,000. Resistance is at 117,711, with higher targets near 124K–126K. A breakout above 117,711 opens the way toward 128,000, while a breakdown below support risks a slide toward 101,000. EMAs are clustered, momentum is neutral, and volume is fading.
Trade Plan:
Long Setup: Break and daily close above 117,711 → enter on retest; stops below 110K. Targets: 124K–126K, extension to 128K.
Short Setup: Breakdown below 108,723 → short on retest; stops above 114K. Targets: 106K and 101K.
Takeaway:
BTC is coiling tightly within the triangle. With critical macro data ahead, a clean break beyond 117,711 or below 108,723 will likely decide the next leg.
Disclaimer: Educational content only, not financial advice.
28/09/25 Weekly OutlookLast weeks high: $115,537.51
Last weeks low: $108,606.86
Midpoint: $112,072.19
As BTC continued to trend down post FOMC the key HTF level of $108,500, after some chop at this level a late rally on Sunday has pushed BTC back to the Midpoint of the range for this week.
As September comes to a close we are at the point where banks window dress their balance sheets by de-risking going into Q4. Banks taking cash out of the market to appear there is less risk and more liquid to hide their true risk over the quarter. This lowers liquidity and for this reason I do not expect the bulls to be out of the woods yet and the weekly low ($108k) could be under attack again before the week closes.
The story is the same for much of the altcoin market, after continued downtrend majors are bouncing off key HTF S/R levels but conviction is still low due to quarter end.
This week I am looking at how BTC finishes the week once the month/quarter end is out of the way. If their is renewed optimism October.
In terms of seasonality October has an average return rate of 21.89% since 2019.
Should price break below weekly low the bullish HTF trend would be questioned and would open the door to a deeper correction. With the 4-year cycle predicted to end in late October there would be huge talk of the cycle repeating and the bear market beginning.
Good luck this week everybody!

BTCUSDT.P SHORTBTCUSDT.P SHORT
The market has the potential for an downtrend
Price: 111658.3 $
Main target 110156.0 $
SL 114334.0 $

Lingrid | BTCUSDT Support Hold Bottom Bounce PlayBINANCE:BTCUSDT is stabilizing after setting a higher low near 110k, signaling demand at the support trendline. Price action shows a corrective phase following the prior range breakout, with structure now coiling just above 110,760 support level. A recovery above this zone could trigger momentum toward the 114,500 resistance area and higher levels. Broader context suggests consolidation within the upward structure, leaving room for a rebound attempt if buyers defend key levels.
⚠️ Risks:
Breakdown below 109,000 would reopen downside toward 107,000 support.
Strong dollar strength or macro headwinds could cap crypto momentum.
Failure to retake 112.5k may keep CRYPTOCAP:BTC stuck in a corrective range.
If this idea resonates with you or you have your own opinion, traders, hit the comments. I’m excited to read your thoughts!

BTC Recovery Attempt — Key Level 111,140After last week’s crash, the price is now attempting to recover. The key level for this week is 111,140 .
If 109,570 breaks, there’s a high probability of the downtrend continuing — with the first target at 100K and the second at 90K . As long as the price remains above 111K , we’re in an upward correction phase and could see growth toward 118,500 .
Only a breakout above resistance and the 122,570 level would open the way to a new ATH.

Analytics: Market Outlook and Forecasts
📈 WHAT HAPPENED?
On Friday evening, October 10, the cryptocurrency market experienced one of the largest crashes in history. It was also the largest cascade of futures liquidations ever. A total of about $20 billion was liquidated in one day. Bitcoin dropped by 16% in the moment, and many altcoins fell by 20% to 90%.
The main reason was the announcement by US President Donald Trump about increasing tariffs on goods imported from China. The "domino effect" was amplified by the failure of the Binance exchange, which triggered a new cascade of liquidations.
According to the chart, Bitcoin broke through most of the support zones, but the decline stopped and the price closed in the range of $116,000-$111,600. This is where the buyer showed strength and absorbed the majority of the seller's activity.
💼 WHAT WILL HAPPEN: OR NOT?
After significant corrections, bitcoin often enters the sideways phase for 1-2 weeks. However, there are already signs of recovery.
At the moment, we’re trying to gain a foothold above the volume zone of $113,700-$110,600 (maximum volumes), there are practically no significant volumes above it that could provide resistance. It’s difficult to say how the price will react in this range. But, most likely, we’ll see another wave of sales in the near future — there are no obvious signs of a reversal yet.
If there is a reaction from the mentioned zone, a long on recovery with a target range of $120,900-$124,000 (volume zone) can be considered.
Buying zone:
$113,600–$110,600 (high-volume area)
Selling zone:
$120,900–$124,000 (volume zone)
📰 IMPORTANT DATES
Macroeconomic events this week:
• October 14, Tuesday, 6:00 (UTC) — publication of the German Consumer Price Index for September;
• October 14, Tuesday, 16:20 (UTC) — speech by Federal Reserve Chairman Jerome Powell;
• October 15, Wednesday, 12:30 (UTC) — publication of the US Core Consumer Price Index for September and in comparison with September 2024;
• October 16, Thursday, 6:00 (UTC) — publication of the UK's GDP for August;
• October 16, Thursday, 12:30 (UTC) — publication of the volume and core index of retail sales, the US producer price index for September, as well as the number of initial jobless claims in the US and the Philadelphia Fed's manufacturing activity index,
• October 17, Friday, 9:00 (UTC) — publication of the Eurozone's consumer price index for September;
• October 17, Friday, 12:30 (UTC) — publication of the average hourly wage, changes in the number of non-agricultural workers, and the unemployment rate in the United States for September.
*This post is not a financial recommendation. Make decisions based on your own experience.
#analytics
TradeCityPro | Bitcoin Daily Analysis #195👋 Welcome to TradeCity Pro!
Let’s move on to Bitcoin analysis. Yesterday, price started an upward move, so let’s see what triggers we have today.
⌛️ 1-Hour Timeframe
Yesterday, price found support at our key zone and also activated the 112,420 risk trigger we had identified.
✨ If you opened a position, it’s not a bad time to take profits, since this was a risky setup, and such positions should be managed quickly.
🧮 Currently, a resistance high has formed around 115,698. If this level breaks, price could continue its upward movement.
💫 As long as price stays above 112,420, this trigger remains active and can be used to open positions.
✔️ For shorts, I personally won’t be taking any until price breaks below 107,000 and stabilizes under that zone.
❌ Disclaimer ❌
Trading futures is highly risky and dangerous. If you're not an expert, these triggers may not be suitable for you. You should first learn risk and capital management. You can also use the educational content from this channel.
Finally, these triggers reflect my personal opinions on price action, and the market may move completely against this analysis. So, do your own research before opening any position.

BTC market snapshotInteresting squeeze — I wouldn’t rule out a new ATH. BUT a big **but** here: there’s an unplayed divergence on the higher timeframe and fading volume. The real question is whether they can push the price higher and still hold above $100K on the pullback. 🤔

Bitcoin Price Nears $115,000 as Investors Refrain From SellingBitcoin is currently trading around $114,553, just below the critical $115,000 resistance level. It briefly surpassed this mark during the intra-day high but failed to maintain momentum, indicating ongoing selling pressure near this threshold.
In the short term, Bitcoin’s outlook remains cautiously bullish, supported by strong holder sentiment. A successful reclaim of $115,000 could pave the way toward $117,261 and eventually $120,000. However, a full recovery would require a sustained push back to $122,000.
But, if the bearish pressure from traders outweighs investor restraint, Bitcoin could slip below $112,500. This could result in the crypto king testing the $110,000 support level and invalidating the bullish outlook.

13/10/25 Weekly OutlookLast weeks high: $126,237.39
Last weeks low: $102,038.44
Midpoint: $114,137.92
Well that was an interesting week... A small reminder that when Trump talks about tariffs the markets move, and move fast!
From All-Time-High at the beginning of the week to a -19.2% move, a single hourly candle had -10.56% drawdown alone!
What can be learnt from this? Despite all the technical analysis in the world, if the President of the United States makes an announcement it can shift the market greatly causing a leverage unwind via liquidations that cascade aggressively. Although these large scale crashes are rare, they are inevitable in this market and this will not be the last of its kind.
This week will be very interesting because generally we do see a lot of backfilling the wick which would mean revisiting the key S/R level at 0.25 ($108,000). The bulls would not want to see price acceptance under this level or IMO this is the beginning of a bearish shift in HTF structure. This potential shift in structure would also line up with the 4 year cycle theory as October marks the end of the bull market.
On the other hand, the bounce from the low has been strong, although still some way off the origin of the dump a lot of ground has been recovered. In the past these liquidation events have marked local lows in the market and serve as a launchpad for the next leg up. I do think it's too early to tell if that is the case this time around, I am in no rush to position either way until at least Mondays range is established.
The altcoin market took a far worse turn, majors sinking as much as 80% in a single move! This week will be important to learn what projects are truly supported/fundamentally sound by how they recover.
Projects such as: ZEC, TAO, ANYONE and BNB have all closed higher than their original price before the crash, other projects may never recover.
Good luck this week everybody!

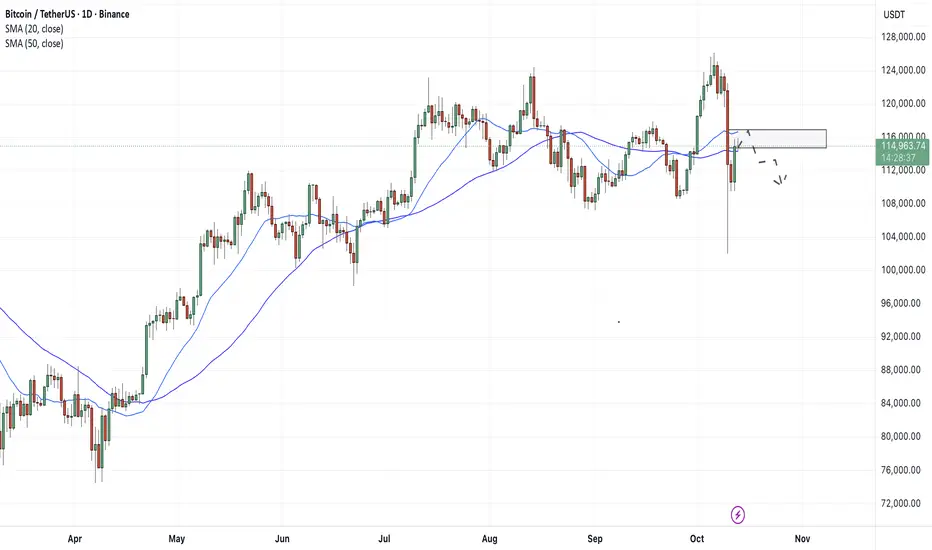
Bitcoin wobbles after Friday's crashBitcoin has suffered from Friday's sell-off, though it tends to show signs of recovery during Monday’s session. After record liquidations worth of 20 billion dollars on the crypto markets, the sentiment for cryptos remains halted, but BTC tends to act as a “digital gold”, and a safe haven to some degree, that’s why it’s possible to observe some demand coming in to the BTC market later.
From a technical standpoint, BTCUSD has come to the dynamic resistance area (the distance between 20 and 50 moving averages), and if it would not show any signs of further recovery, it would probably pull back to the $110000 price area with a further consolidation.
Don't forget - this is just the idea, always do your own research and never forget to manage your risk!
Sweep all liquidity, BTC recoversBTCUSD – Daily Analysis
The recent market move confirmed our earlier sell call at the 126K top, which played out perfectly as price reversed sharply from that resistance zone. This level aligned with the 1.618 Fibonacci extension and the upper trendline — a strong confluence area that signaled exhaustion.
Currently, BTC is rebounding from the support zone around 110K–111K, showing short-term recovery momentum. However, unless price breaks decisively above 121K, the structure still favors a potential retest toward 110K before any larger bullish continuation.
→ Key Levels:
• Resistance: 121K / 126K
• Support: 110K / 107K
• Trend: Short-term corrective uptrend within a broader range
✅ Successfully caught the 126K top — next focus on reaction around 121K zone.

BTC – Bounce Off Daily Support, Eyes on Supply!Bitcoin has bounced from the daily support area (the broad green zone around $110K–$112K), reclaiming the intraday breakdown zone near $114K and turning it into support on lower timeframes.
As long as price holds above $112K–$113K, the short-term bias remains constructive and I am looking for continuation toward $118K, followed by the $121K–$122K supply zone highlighted on the chart.
The bulls will remain in control as long as the $107,500 mark holds as support.
⚠️ Disclaimer: This is not financial advice. Do your own research and manage risk.
All Strategies Are Good; If Managed Properly!
~Richard Nasr.

This Ascending Trendline is KeyHello, fellow traders!
Today I'm looking at the BTCUSDT chart on the Weekly timeframe, and I've spotted a potentially dangerous setup that everyone should be watching.
As you can see from my chart, Bitcoin has been respecting a major ascending trendline that has acted as strong support during this recent uptrend. This trendline has been the backbone of the bullish structure, with multiple bounces confirming its significance.
Currently, the price is once again approaching this critical level after a period of Price Action.
