Bitcoin Roadmap Before FOMC Minutes – Correction or New ATH?Today, we have one of the most important macro events — the FOMC Meeting Minutes
Let’s quickly understand what it is and why it could shake the crypto market
What are FOMC Minutes?
They’re the detailed notes from the last Federal Reserve meeting, showing what members discussed about interest rates, inflation, and the economy.
Markets carefully read every line to find hints about future rate cuts or continued tightening.
Why does it matter for Bitcoin?
When the Fed turns dovish (hinting at lower rates), risk assets like Bitcoin usually rally But when the tone is hawkish (worried about inflation), investors move to cash or bonds, causing crypto to dip.
Let’s take a look at Bitcoin ( BINANCE:BTCUSDT ) on the 4-hour timeframe .
Before analyzing the chart, let’s quickly review what defines a strong uptrend :
1-Higher Lows(HL):
Each new low should form above the previous one, showing that buyers are stepping in earlier each time.
2-Higher Highs(HH):
Each new high should be higher than the last, confirming that bullish momentum is still in control.
3-Structure Respect:
The new low should not break below the previous high — if it does, it doesn’t necessarily mean the trend is over, but it indicates a weakening of the bullish structure.
Based on the points above, Bitcoin failed to form a new Higher Low(HL) during the past 24 hours, and the previous high was retested .
These signals indicate a loss of bullish momentum, suggesting that we might see at least a short-term correction from a technical perspective.
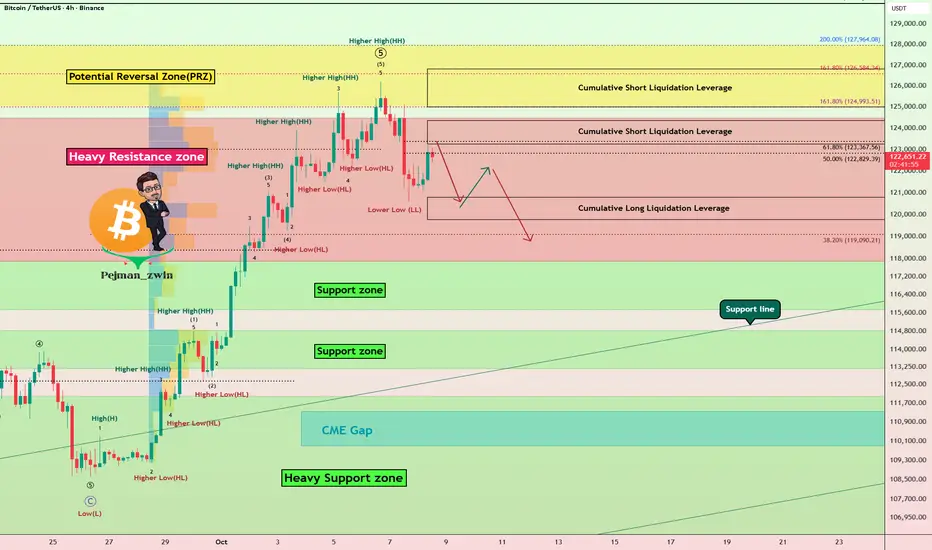
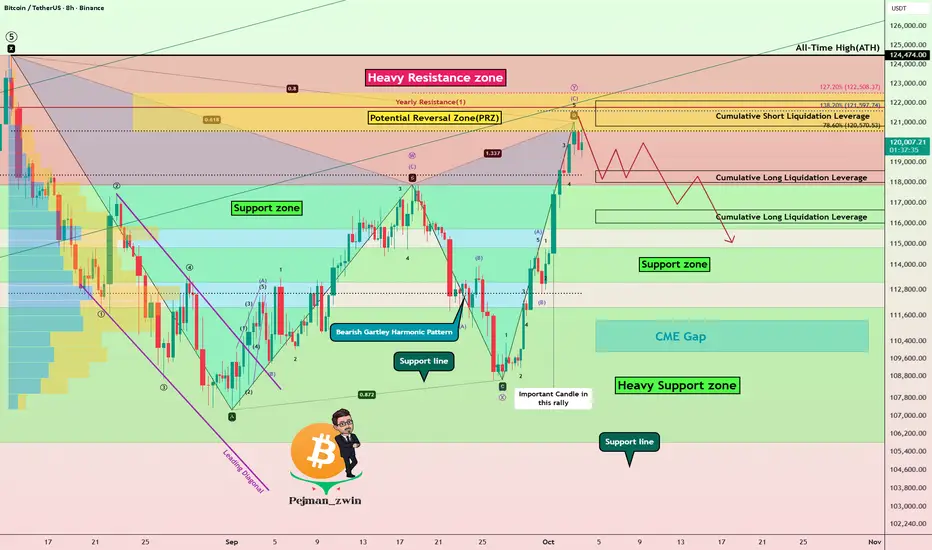
Bitcoin has already started to bounce back nicely from the Potential Reversal Zone (PRZ) and is currently trading in a Heavy Resistance zone($124,474-$117,900) .
In terms of Elliott Wave theory , it seems that with the formation of a Lower Low(LL) , Bitcoin has completed at least a series of impulsive waves , and we can now expect corrective waves .
I expect Bitcoin to drop to at least Cumulative Long Liquidation Leverage($120,779-$119,957) before the FOMC Meeting Minutes start and could continue to rise or correct depending on the tone of the FOMC Meeting Minutes .
Note: You should note that these days, Bitcoin has a higher correlation with the SPX500( SP:SPX ) index than before, so if there is a sudden movement in Bitcoin, one of the reasons could be a sudden movement in the SPX500.
Do you think this bullish move could lead to a new all-time high (ATH) for Bitcoin again!?
Cumulative Short Liquidation Leverage: $124,350-$123,244
Cumulative Short Liquidation Leverage: $126,813-$125,000
CME Gap: $111,355-$109,915
Please respect each other's ideas and express them politely if you agree or disagree.
Bitcoin Analysis (BTCUSDT), 4-hour time frame.
Be sure to follow the updated ideas.
Do not forget to put a Stop loss for your positions (For every position you want to open).
Please follow your strategy and updates; this is just my Idea, and I will gladly see your ideas in this post.
Please do not forget the ✅' like '✅ button 🙏😊 & Share it with your friends; thanks, and Trade safe.
USTBTC trade ideas
High probability strategies for the London SessionHey traders, let's break down the London session trading . In my opinion key session for the forex trading mainly for the EUR, GBP and CHF. I ll show you two high probability setups and its conditions to trade and when not to trade. Make notes and backtests so you got statistics and you can improve yourself over time. You will find out, that if you focus only on these 2 setups on 3 mentioned currencies. You will have 3-5 high probability opportunities per week.
Which is enough to make 6R gains in a week. Which is 3% on prop account with risk 0.5% per trade. And it's enough to make trading your main income.
📌 Asian Session
Low volatility & accumulation phase — the market usually consolidates inside a tight range after the previous New York close. If the Asia session is trending, London will be continuation setup.
📌 London Session
The highest-probability setups often occur during this session.
If Asia was tight range, London usually manipulates the Asian range sweeping stops above or below then reverses and starts the true daily move. London will be Reversal setup. Often sets the daily high or low of the day
📌 New York Session
Brings in the highest volume and often continuation or reversal of the London move. Based what has happen in London and on relationship with key levels and market phases. We can build market narrative for our trades.
🧪 London Continuation Bearish setup
•Narrative: Asia did the manipulation → London does the continuation.
• Asia session already made a manipulation into a key level
• Price displaced away from that level
• CIOD / OB on M15 or H1 before London open
• H1: Asia runs above the stops above H1 high into a key level
• It gets rejected and followed by order block and displacement
• At London open, price retraces into M15 premium key level and continues in the same direction
❌Invalidation: the manipulation high/low from Asia session
🧪 London Continuation Bullish setup
• Narrative: Asia did the manipulation → London does the continuation.
• Asia session already made a manipulation into a key level
• Price displaced away from that level
• CIOD / OB on M15 or H1 before London open
• H1: Asia runs bellow the stops above H1 high into a key level
• It gets rejected and followed by order block and displacement
• At London open, price retraces into M15 discount key level and continues in the same direction
❌Invalidation: the manipulation high/low from Asia session
🧪 London Reversal Bearish setup
• Narrative: London performs the manipulation → price reverses.
• Asia session consolidates near a higher timeframe key level
• London open initiates the manipulation into the key level
• Price reject at the key level and created M15 order block • H1: Asia consolidates Bellow Key Level
• London opens, price runs Asia high into that Key Level
• M15 breaks down → Change in order flow → clean short setup
• Target: higher timeframe draw on liquidity (e.g., previous day low)
❌Invalidation: the London session high (manipulation point)
🧪 London Reversal Bullish setup
• Narrative: London performs the manipulation → price reverses.
• Asia session consolidates near a higher timeframe key level
• London open initiates the manipulation into the key level
• Price reject at the key level and created M15 order block • H1: Asia consolidates above the Key Level
• London opens, price runs Asia high into that Key Level
• M15 breaks up → Change in order flow → clean short setup
• Target: higher timeframe draw on liquidity (e.g., previous day low)
❌Invalidation: the London session low (manipulation point)
🧩 to trade this method successfully you need to understand Order Blocks
🔗 Click the picture below to learn more 👇https://www.tradingview.com/chart/BTCUSD/LJ69Z8r4-Order-Block-Powerful-Key-level-and-Entry-confirmation/ 🕐 Timing is important
1️⃣Continuation setup can occur in first part of the London session. during the start of the settlement 2️⃣ Reversal setup needs a bit more time. I suggest don't enter before the 10 CET
wait for clear change in order flow after the manipulation 🧩 Day Trading doesn't mean trading every day. For highest probability setups trade only within the higher timeframes H4/D1/W1 trends.
📌 Down Trend - Trade Stop hunts above the highs
Trade London continuation or Reversal if the H4 Downtrend has run above the highs (stop hunt) It will give you chance to catch big expansion moves 📌 Up Trend - Trade Stop Hunt below the lows
Trade London continuation or Reversal if the H4 Downtrend has run below the lows (stop hunt) It will give you chance to catch big expansion moves. 🧩 In other words you want be buying loses and Selling highs.
🔗 Click the picture below to learn more 👇 I have explained how to do it in this post bellow Trend is your friend so H4 is minimum trend requirement for the London session traders. But if you want to take it to next level and enter on the sniper entries during the London session, you should also know daily and weekly trends within the monthly range. This opens a whole new world where you can catch London session model with HTF range move and it can be +10RR trades if you patient enough.
📈 Bullish LTF Ranges within HTF Range
Analyze HTF range (monthly) and define daily ranges, and wait for the London setups on the lows of the previous days within HTF trend. Always follow the same process in the London session on LTF. Asia either make manipulation - go with continuation setup or Asia consolidates and wait for the manipulation during the London session - go with London Reversal setup. 📉 Bearish LTF Ranges within HTF Range
Analyze HTF range (monthly) and define daily ranges, and wait for the London setups on the highs of the previous days within HTF trend. Always follow the same process in the London session on LTF. Asia either make manipulation - go with continuation setup or Asia consolidates and wait for the manipulation during the London session - go with London Reversal setup. ‼️ In trading, you make most money by making precisely best decisions and controlling your risk. Hence understanding the different probabilistic scenarios we can start focusing on quality over quantity by avoiding lower probability conditions. The aim is to improve our decision making process by knowing when it's better to trade and when not.
❌ Low Probability London Session Conditions
• After a series of 3 consecutive bullish daily candles - Avoid Longs.
• After a series of 3 consecutive bearish daily candles - Avoid Shorts.
• After FOMC event that produces an extreme range.
• Ahead of NFP and CPI data release
• Multiple high and medium impact news events.
• The Asian Range is has been trending and is larger than 40 pips.
• If the Asian Range is not visually consolidating.
• Absence of a candle range
✅ High Probability London Session Conditions
• The market has recently reacted off of Daily /H4 key level
• The Asian Range is visually a consolidating and smaller than 40 pips.
• Presence of a clean visual candle range
• Presence of a higher timeframe key level.
• Clean higher timeframe draw on liquidity.
✅ High Probability Intraday Setups
The highest importance is placed on the H TF Daily or 4h direction:
• Clean orderflow.
• Clean higher timeframe draw on liquidity and directional bias.
• Strong price based narrative.
• Strong time based narrative.
• 4h candle range
• 4h Key level.
• Key time
Adopt this simple concept and master it. You will not need to pay any signals group and other nonsense anymore. Just sacrifice 6 months to one strategy in one time window and find repetitiveness. Build confidence based on statistical data. Become independent.
✨ Trading Mastery is reflection of your life
Have a longterm plan, No Alcohol & Drugs, Ignore others, Focus on your journey , Backtest regularly, Review your weeks, Journal mistakes, Exercise, Sleep well, Read books, Walks in nature (no phone) , Meditate, Reduce social media time, Spend time with family, Live Life.
Trading is hard, but not impossible. I believe in you 💪
David Perk aka Dave Fx Hunter
BTC's 2021 Playbook is Back Are You Ready for the Final Rally?History doesn't repeat itself, but it often rhymes. And right now, Bitcoin is composing a symphony we've heard before, one that ended in a PARABOLIC EXPLOSION.
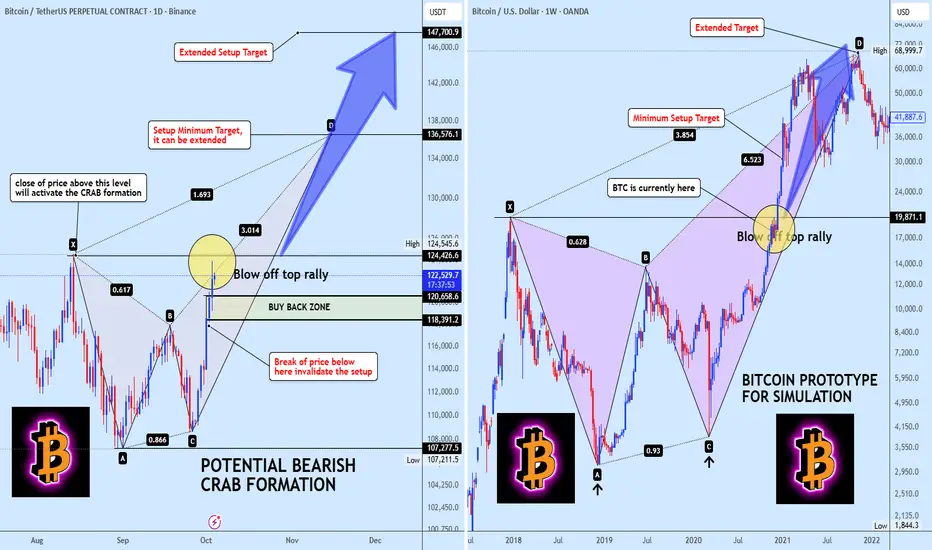
We're looking at a potential BEARISH CRAB PATTERN on the daily chart, and it's a near perfect mirror of the 2017-2021 prototype that launched us to the last cycle top. Buckle up.
The Simple Breakdown:
1. THE ACTIVATION TRIGGER: A daily close ABOVE $124,545. This is the launch button.
2. THE BUY THE DIP ZONE: $118k to $120k. Any dip here could be a gift before the rip.
3. THE FAIL SAFE: A daily close BELOW $107k invalidates the setup. This is our line in the sand.
THE TARGETS:
1. Minimum Target: $136,576
2. Extended Target: $147,700-$160k
The Ghost of Cycles Past (Right Chart):
Look at the 2017-2021 prototype. The C to D leg wasn't just a rally; it was a BLOW OFF TOP of historic proportions. It delivered the targets and then some before exhaustion set in.
The current structure is screaming that we could be at the same inflection point.
This isn't just another pattern. This is a cyclical blueprint suggesting Bitcoin is gearing up for the FINAL, EXPLOSIVE LEG of this cycle.
If this Crab confirms, we are targeting the $136K to $147K+ zone as the potential cycle peak. This is where liquidity floods in and volatility goes vertical.
A Word of Caution:
Always trade with a plan. The invalidation level at $107K is crucial. A break below there means the setup is broken, and we must re-assess.
The takeaway? All eyes on the $124.5K breakout. This could be the start of the grand finale.
BTCUSDT Analysis: Breakout and Potential Growth👋Hello everyone, what do you think about BINANCE:BTCUSDT ?
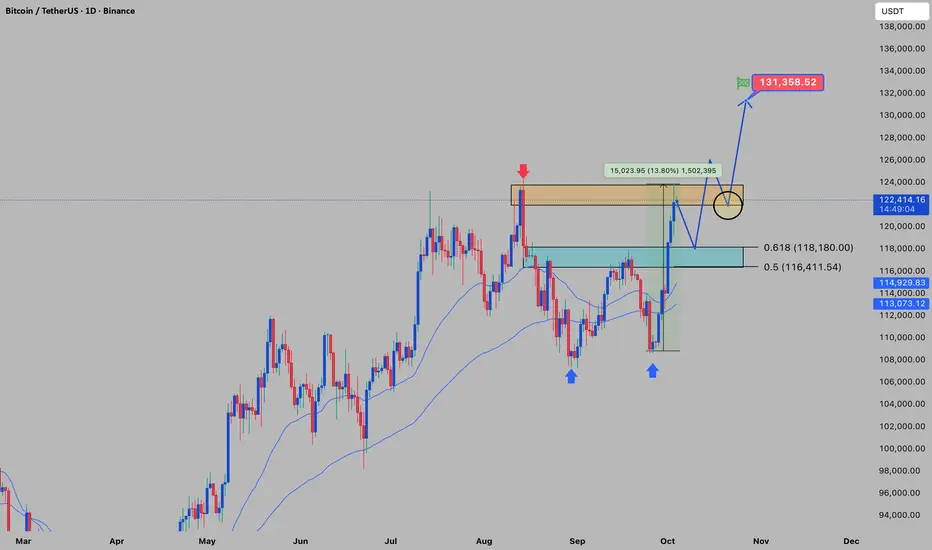
Based on technical analysis, BTCUSDT has made a strong breakout from the descending channel. Currently, Bitcoin is facing strong resistance near the 124,000 USD level. After reaching the peak, the price may correct back to Fibonacci support levels (0.5 - 0.618) before potentially continuing its upward movement.
The next target for BTC is to reach 130,000 USD if the bullish trend continues. The key to achieving this target is for the newly established support to hold, along with a clear confirmation of a candle close above the current resistance zone.
As for me, I remain optimistic. What about you? 💬What do you think about the trend of BTCUSDT? Feel free to leave your thoughts in the comments below.
Good luck!

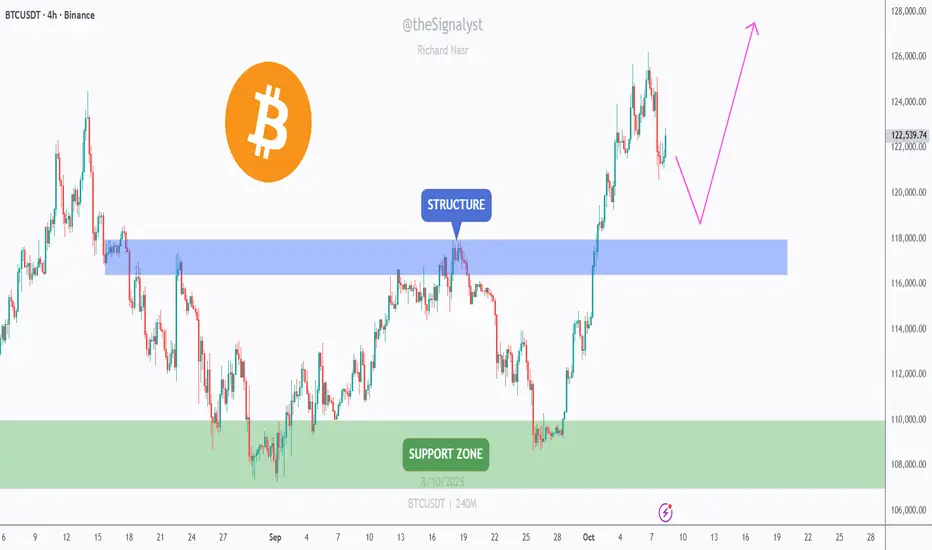
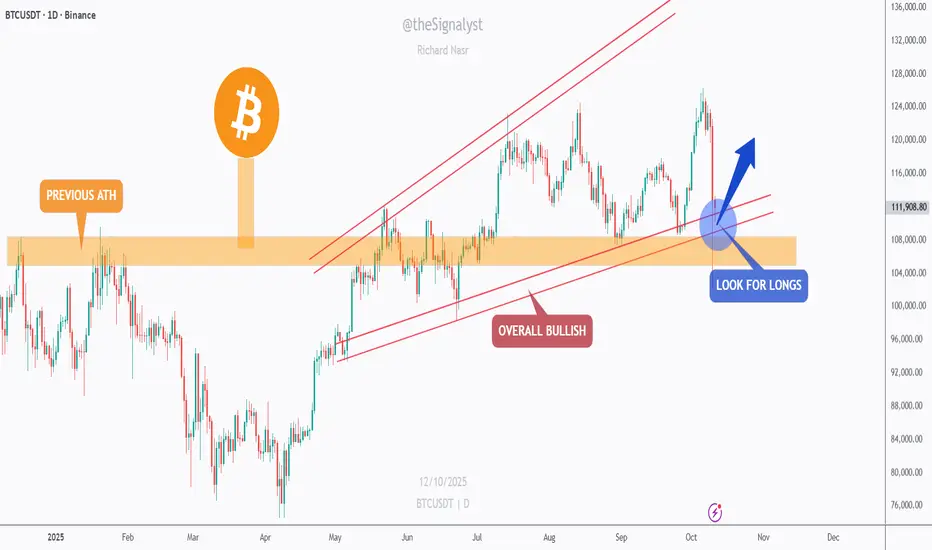
BTC – Eyeing a Retest of the $118K Structure!CRYPTOCAP:BTC broke above the $117K–$119K structure (blue zone) with strong momentum.
I’m now watching for a pullback to this area to form a higher low and resume the uptrend.
As long as price holds above $117K–$119K, I’ll look for trend-following longs toward $125K–$128K, then the $130K handle.
If the blue zone fails, the next support sits at $106K–$110K (green zone), where bulls may regroup.
⚠️ Disclaimer: This is not financial advice. Always do your own research and manage risk properly.
📚 Stick to your trading plan regarding entries, risk, and management.
Good luck! 🍀
All Strategies Are Good; If Managed Properly!
~Richard Nasr
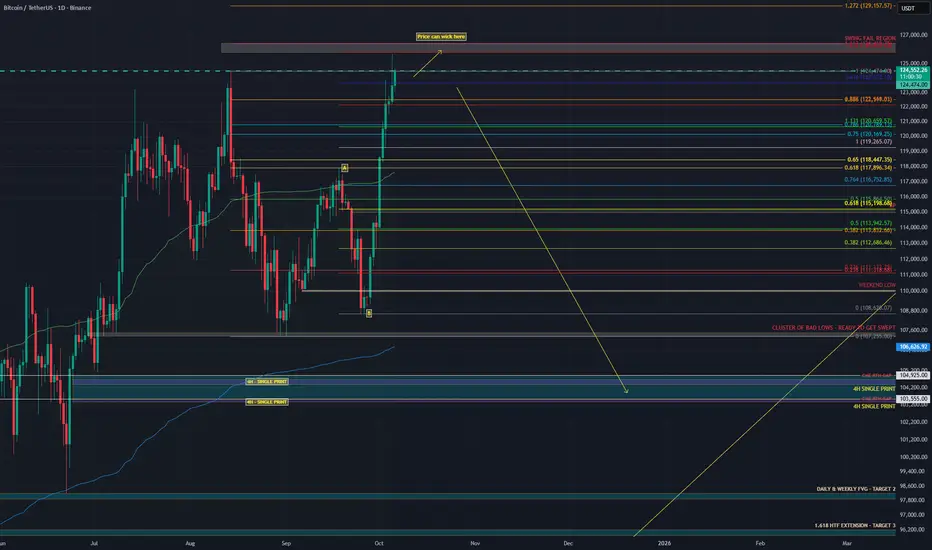
Why MY “Big Dump” THESIS STILL STANDS. BITCOIN WILL BLEEDHappy Monday traders,
I’ve reviewed the latest data again and nothing has changed my view. The structure still looks weak underneath the surface and the setup for downside remains strong.
Summary:
• Price rising → Market pushing higher, looks strong on the surface.
• Stablecoin OI increasing → New leveraged perp positions opening. Speculative money is driving the move, not real buyers.
• Coin-margined OI dropped, then slightly increased → Shorts were closed during the breakout, and now new shorts are opening near the highs.
• Spot CVD flat or slightly negative → Real demand is still missing. Spot traders aren’t supporting this move.
• Stablecoin CVD rising → Perp traders are aggressively buying, lifting price artificially.
• Long/Short ratio falling (2.05 → 1.02) → Fewer longs and more shorts entering. Shorts are fading strength while price keeps rising.
• Price up + OI up + Spot CVD flat → Buyers are being absorbed by new shorts. This is distribution forming at the highs.
• Possible short-term move to 126K → Could sweep weekend highs during RTH for liquidity before a potential reversal.
• If Spot CVD stays flat while OI rises on that move → That would likely be the final squeeze before a deeper dump.
-------------------
1️⃣ The same leverage-driven structure
The breakout on September 25 looked impressive, but it was built on leverage rather than real spot demand.
Stablecoin OI (aggregated) increased from 257K → 285K contracts (+10.9%)
This shows fresh leveraged exposure coming from perps, not genuine buyers
Coin-margined OI dropped from 7.58B → 7.29B during that breakout as shorts were closed out
It has now started to rise slightly again at current prices, meaning new coin-margined positions are opening near the highs, most likely shorts fading strength
2️⃣ Spot demand is still missing
Spot CVD moved from -18.38K → -16.44K (about +10.5%), while futures OI rose almost the same amount. That tells you everything: the breakout was driven by futures leverage, not real spot buying.
Everyone’s renting Ferraris (perp longs), but no one is actually buying one (spot BTC). Once the rental stops, the cars vanish and prices drop.
3️⃣ The long-short ratio collapse
On September 25, the aggregated long/short ratio (Binance + Bybit) was 2.05, meaning twice as many longs as shorts. Today it sits near 1.02, even though price is higher.
Early breakout longs have been closed or liquidated
New traders entering the market are mostly shorts
OI is still rising, showing new short positioning, not liquidation exits
Stablecoin-perp CVD is still climbing, meaning buyers are pushing price up but every uptick is met with new short liquidity
This is a classic case of perps pushing while smarter money fades.
4️⃣ Why I still think Bitcoin will bleed
This looks like distribution, not accumulation.
Perp traders are driving the move
Spot buyers still haven’t shown up
Shorts are building into the highs
That’s not a healthy uptrend. It’s a top-heavy market waiting for the bid to dry up. When it does, the unwind will likely be quick as leveraged positions are forced out.
Think of it like a rubber band. The more it’s stretched by leverage without real demand, the harder it snaps when buying power runs out.
⚖️ TL;DR
Stablecoin OI +10.9% → leverage driven
Coin OI fell, then rose slightly → shorts covered, new shorts forming near highs
Spot CVD flat → no real buyers
Long/Short ratio 2.05 → 1.02 → longs out, shorts in
The move up was built on leverage, not ownership.
Spot hasn’t confirmed, and shorts are stacking into strength.
🎯 Short-term note
There’s a chance we see one more push toward the 126K region during RTH to sweep the weekend highs before rolling over. If that happens with spot CVD still flat and OI climbing, it’ll likely be the final liquidity grab before a larger move down.
Until spot CVD turns positive and OI stabilizes, my view remains the same: Bitcoin will bleed.
Interested in the Order Flow data that I used for this Analysis? Check it out here => ibb.co
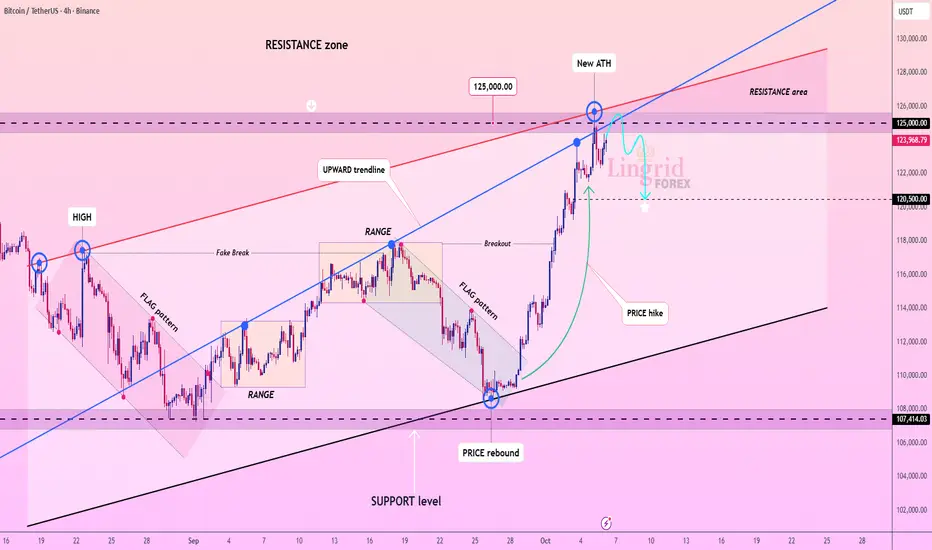
Lingrid | BTCUSDT Round Number Rejection Pullback ExpectedThe price perfectly fulfilled my previous idea . BINANCE:BTCUSDT is facing rejection near the 125,000 resistance after reaching a new all-time high. Price action shows exhaustion at the top boundary of the rising channel with early signs of retracement. A close below 123,000 may confirm a deeper correction toward the 120,000 support zone. Momentum suggests sellers are attempting to take control following the extended bullish rally.
⚠️ Risks:
A sustained move above 125,000 could invalidate the bearish setup.
Strong institutional buying or ETF inflows may renew bullish momentum.
Softer U.S. economic data could weaken the dollar, supporting crypto recovery.
If this idea resonates with you or you have your own opinion, traders, hit the comments. I’m excited to read your thoughts!
Bitcoin STRONG Weekly Bounce - What's Next?Hello BTC Watchers 📈
📢 Bitcoin was trading right on top of a crucial support zone. But the price has successfully bounced in the weekly and made a strong comeback from the support zone.
The weekly moving averages
The daily moving averages
This is telling for a number of reasons. In the weekly we see a strong bounce above the moving averages as well as in the daily, and in the daily we had just bounced back from a correction which took us to the 100d MA (which is the general zone for a correction, or at least a wick towards that area. This indicate that in the short and longer term, the chart is looking up and bulls are in control.
What are you thoughts, new ATH or just a fakeout?

Using DXY to Predict Manipulation on BitcoinIn this post it’s important to view and relate to the linked, related idea called “DXY - Major Breakdown of Ascending Channel”
I’ll keep this short and to the point since we are actively in the war zone now.
1. Identify major patterns or structure shifts on DXY. For 8 years I’ve used these same ascending channel supports on DXY and it’s made very clear this is the way it trades, as we can duplicate the line angle and move it near infinitely to any area and see how price respects it.
2. Identify major DXY events in relation to the DXY pivot. In this case, we are witnessing a bearish retest of a major bearish signal.
3. Understand what it all means. DXY falling / correcting for 4-7 years translates to BULL MARKET of the same duration on stocks, equities, and securities.
Now you may be thinking - “Okay but that means, Bitcoin will go up then?”
WRONG
The reason is, Bitcoin and Crypto is a manipulated game and it’s all rigged and intentional.
What does this really mean then?
4. If we will see a natural bullish trend on Bitcoin for the next 4-7 years, that means the market makers want their money back. Since Bitcoin has been only moving up since late 2022, this has set up a massive chain reaction of long stop losses / sell orders, paving a path to these lower zones on my BTC chart. What this should tell you is - FLASH CRASH COMING. Manipulated crash before the true bull run.
Now you may be wondering - “No way, the world would have to see an apocalypse for 8,000 to be hit”
WRONG
Stop loss orders are in place already as a natural consequence of traders decisions over the last 3+ years. These are sell orders. Once these sell orders start filling, bitcoin will see an automatic wick down to these low levels. No active selling is required, and therefor no black swan required.
Now - If DXY was retesting a bullish pattern, I’d be longing as that signals extended bear market.
And rest assured - THIS MARKET IS ALL MANIPULATION.
We can use DXY to predict the trigger of it all.
Happy trading.
- DD
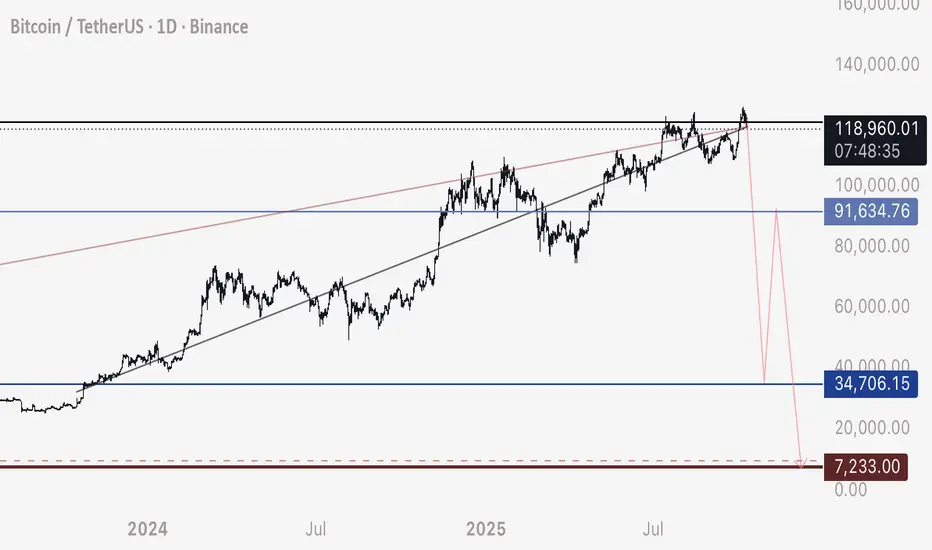
The Bitcoin bearish era has begun (1D)First of all, you should know that in our previous analyses, we had identified a large triangle. However, the market makers created another bullish wave, increasing the chart’s error margin (The scenario you see in the related ideas section.).
This sharp move indicates the beginning of new bearish branches! It is expected that with a pullback to the red zone, the correction will continue, and we will be involved in it for at least a few months.
Closing a daily candle above the invalidation level will invalidate this analysis.
For risk management, please don't forget stop loss and capital management
When we reach the first target, save some profit and then change the stop to entry
Comment if you have any questions
Thank You

06/10/25 Weekly OutlookLast weeks high: $125,735.08
Last weeks low: $111,559.20
Midpoint: $118,6547.14
New All Time High for Bitcoin in the first week of "Uptober", really impressive strength since flipping $117,500.
BTC still finds itself within a range between ATH and $108,000 but with such strength on the bounce from range lows, could we see price discovery going into the last leg of the year?
From a macro perspective month/quarter end is now over and done with, banks have completed their window dressing/de-risking and we can expect liquidity to flow back into the risk markets. Rate cut cycle continues, M2 Global money supply at ATH with seemingly no plans to stop in the near future.
For now I am still treating trading BTC as it is in a range until we get price acceptance above $125,000. If there is a breakout above and a rally altcoins should follow. In terms of news releases this week because of the US Government shutdown there is a disruption on data releases but overall nothing of great importance is disrupted.
Good luck this week everybody!

BTC – Bulls Still in Control, As Long As the Intersection Holds!CRYPTOCAP:BTC is retesting a major confluence zone, the intersection of the rising red trendline and the previous ATH structure around $110K–$112K.
This zone has acted as a strong pivot multiple times, and as long as it holds, the overall bullish trend remains intact.
Bullish scenario: Look for trend-following longs near the current intersection, targeting the upper red trendline around $125K.
Bearish invalidation: A daily close below $107K would break the confluence and signal a potential shift in momentum.
📈 The structure is still clean, a healthy correction within an ongoing bullish cycle.
⚠️ Disclaimer: This is not financial advice. Always do your own research and manage risk properly.
📚 Stick to your trading plan regarding entries, risk, and management.
Good luck! 🍀
All Strategies Are Good; If Managed Properly!
~Richard Nasr
BTC Pullback: Key Support at $99,800 – Next Move?#Bitcoin is currently experiencing a pullback, likely triggered by news, such as President Trump’s tariff announcement on China.
The price is hovering around $110,500, but it doesn’t look strong enough to hold at this level, so a move toward $99,800 is possible. The 0.5 Fibonacci retracement at $99,800 acts as a key demand zone. However, the RSI isn't oversold yet, which means there’s potential for further downside if this support breaks.
In my opinion, the best approach right now is to wait for some confirmation.
Stay tuned and follow for more updates, and if you're stuck in any coin, feel free to DM me I’ll do my best to help you out.
CRYPTOCAP:BTC BITSTAMP:BTCUSD BINANCE:BTCUSDT

Bulls are on the rise, with the MACD, SMA, and EMA all bullish!
Let's not beat around the bush; this daily chart is a stark illustration. After breaking through resistance near $110,000, Bitcoin surged to $125,725 on increasing volume, demonstrating textbook breakout behavior. But just when bulls thought it was safe to celebrate, smaller candlesticks—tiny signals of uncertainty—slowly appeared like unwelcome party guests.
With support at $120,000 and $116,000, bottom-fishing opportunities could emerge between $120,000 and $122,000. But let's be clear: if Bitcoin fails at $125,725 again, it could call the bears out again.
If Bitcoin breaks through $125,725, the target will be $130,000. All technical indicators point to a bullish outlook, and any dip near $120,000 could simply be the market's "final announcement" that Bitcoin is ready to take off. However, a failure to break above $125,000 and a break below $120,000 could signal a reversal. With momentum peaking and several oscillators flashing warning signs, a breakdown of $120,000 support would be a good time to sell.

TradeCityPro | Bitcoin Daily Analysis #191👋 Welcome to TradeCity Pro!
Let’s get into Bitcoin analysis. The market is still in a ranging phase, so let’s take a look at today’s triggers together.
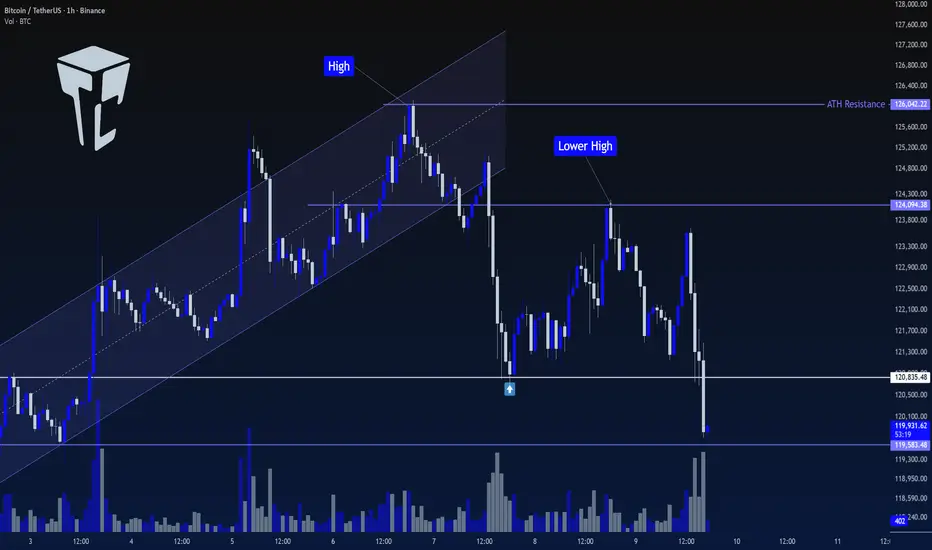
⌛️ 1-Hour Timeframe
In this timeframe, Bitcoin is still consolidating and has formed a new range high around 124,094.
✔️ Right now, the price is near the bottom of the range box it has created and is on the verge of breaking below it.
✨ If the bottom of the box breaks, price could move toward lower levels.
📊 If selling volume continues to increase, the downward move could extend further, and Bitcoin may correct to even deeper zones.
🎲 However, if this move turns out to be a fake breakdown, and we see reversal structures such as a V-pattern, we could look for a long trigger.
🔑 I still don’t see Bitcoin as being in a downtrend. In my view, every correction the market makes is still healthy and supports the continuation of the broader bullish structure, helping maintain the strength of upcoming legs.
⭐ For now, since momentum has turned bearish on the lower cycles, I don’t have any new triggers to give based on my strategy. In this phase of the market, I prefer to wait until price builds more structure.
❌ Disclaimer ❌
Trading futures is highly risky and dangerous. If you're not an expert, these triggers may not be suitable for you. You should first learn risk and capital management. You can also use the educational content from this channel.
Finally, these triggers reflect my personal opinions on price action, and the market may move completely against this analysis. So, do your own research before opening any position.
Elliott Wave + Gartley Harmonic: Why Bitcoin May Correct Soon!?Bitcoin( BINANCE:BTCUSDT ) has shown strong bullish momentum over the past week, climbing nearly +10% and testing key resistance zones . Several fundamental and technical factors fueled this rally.
Key Drivers of the Rise:
ETF inflows – Significant net inflows into spot Bitcoin ETFs boosted demand.
Macro uncertainty – U.S. government shutdown risk and weaker job data supported risk assets.
Monetary policy – Expectations of softer Fed policy improved market sentiment.
Derivatives impact – Options expiry, high OI, and short squeezes added upward pressure.
Exchange outflows – Lower BTC supply on exchanges signaled accumulation.
Positive sentiment – “Uptober” narrative and bullish analyst targets lifted confidence.
-------------------------------------------
Now, if we look at the Bitcoin chart in the above timeframes from a technical analysis perspective , we can see the following:
First of all, let me say that the rally that Bitcoin has had over the past 7 days has NOT been accompanied by high volume, and this is not good news for Bitcoin to create a new All-Time High(ATH) .
Bitcoin is entering a Heavy Resistance zone($124,474(ATH)-$117,900) and is moving near the Potential Reversal Zone (PRZ) and Cumulative Short Liquidation Leverage($122,120-$120,823) .
In terms of Elliott Wave theory , Bitcoin appears to be completing a microwave C of the main wave Y . One of the reasons I saw the waves as corrective , other than the microwaves, was the low volume of Bitcoin in the past 7-day rally .
If we look at the Bitcoin chart from a pattern perspective , the important Bearish Gartley Harmonic Pattern is also well and standardly defined on the chart, such that point D in the PRZ can be completed. The Gartley Harmonic Pattern is the most important pattern among the harmonic patterns .
I DO NOT expect a new ATH formation for Bitcoin in this rally due to the above reasons, and I expect it to at least decline to the Support zone($114,820-$113,180) .
Note: Important prices to watch for if Bitcoin reverses (in order of importance of volume): $118,400-$112,700
Note: You should note that these days, Bitcoin has a higher correlation with the SPX500( SP:SPX ) index than before, so if there is a sudden movement in Bitcoin, one of the reasons could be a sudden movement in the SPX500.
Educational Tip : The volume of each candle is considered to be the identity and credibility of that candle, and you can find these candles with the help of volume candle charts.
Cumulative Long Liquidation Leverage: $118,583-$118,000
Cumulative Long Liquidation Leverage: $116,652-$116,000
CME Gap: $111,355-$109,915
Stop Loss(SL): $125,00(Worst)
Please respect each other's ideas and express them politely if you agree or disagree.
Bitcoin Analysis (BTCUSDT), 8-hour time frame.
Be sure to follow the updated ideas.
Do not forget to put a Stop loss for your positions (For every position you want to open).
Please follow your strategy and updates; this is just my Idea, and I will gladly see your ideas in this post.
Please do not forget the ✅' like '✅ button 🙏😊 & Share it with your friends; thanks, and Trade safe.
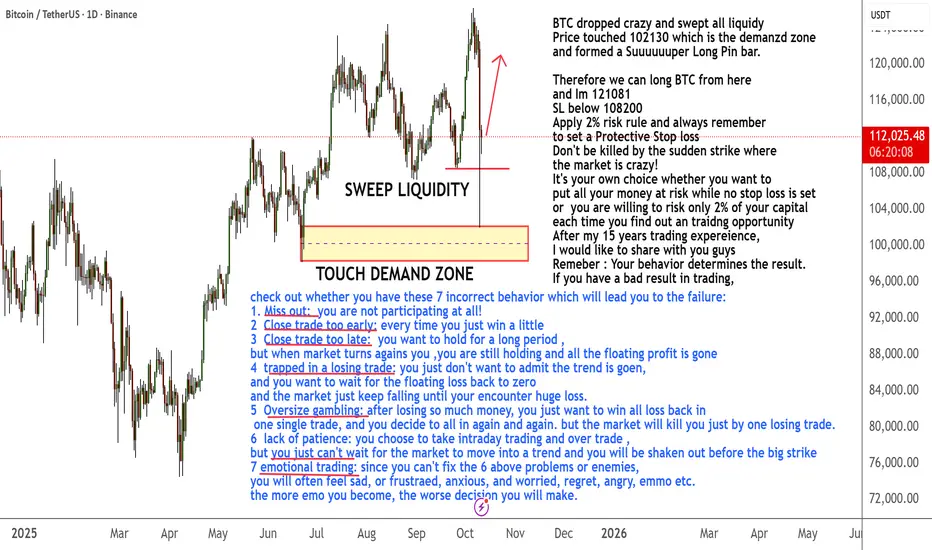
BTC Trading Plan after the sweeping of liquidity BTC dropped crazy and swept all liquidy
Price touched 102130 which is the demanzd zone
and formed a Suuuuuuper Long Pin bar.
Therefore we can long BTC from here
and Im 121081
SL below 108200
Apply 2% risk rule and always remember
to set a Protective Stop loss
Don't be killed by the sudden strike where
the market is crazy!
It's your own choice whether you want to
put all your money at risk while no stop loss is set
or you are willing to risk only 2% of your capital
each time you find out an traidng opportunity
After my 15 years trading expereience,
I would like to share with you guys
Remeber : Your behavior determines the result.
If you have a bad result in trading
check out whether you have these 7 incorrect behavior which will lead you to the failure:
1. Miss out: you are not participating at all!
2 Close trade too early: every time you just win a little
3 Close trade too late: you want to hold for a long period ,
but when market turns agains you ,you are still holding and all the floating profit is gone
4 trapped in a losing trade: you just don't want to admit the trend is goen,
and you want to wait for the floating loss back to zero
and the market just keep falling until your encounter huge loss.
5 Oversize gambling: after losing so much money, you just want to win all loss back in
one single trade, and you decide to all in again and again. but the market will kill you just by one losing trade.
6 lack of patience: you choose to take intraday trading and over trade ,
but you just can't wait for the market to move into a trend and you will be shaken out before the big strike
7 emotional trading: since you can't fix the 6 above problems or enemies,
you will often feel sad, or frustraed, anxious, and worried, regret, angry, emmo etc.
the more emo you become, the worse decision you will make.
BTCUSD NEXT POSSIBLE MOVEBitcoin is holding near a strong support zone, showing signs of accumulation. If the price continues to respect this level, a bullish breakout can be expected soon.
Buyers may step in once momentum shifts upward — structure remains bullish above support.

BTC/USD | BTC Crashes to $102K, Then Bounces Back – Still UnstabBy analyzing the Bitcoin (BTC) chart on the 12-hour timeframe, we can see that last night, following Trump’s tweet, the market faced a sharp sell-off, with BTC dropping all the way down to $102,000. After hitting this key demand zone, Bitcoin bounced back strongly, rallying up to $115,000, and is now trading around $110,000.
However, BTC still looks unstable, struggling to hold steady — to continue its bullish trend, it must stay above $110K. If it fails to hold this level, we could see the price dip below $100K again. This analysis will be updated soon as the market develops.
Please support me with your likes and comments to motivate me to share more analysis with you and share your opinion about the possible trend of this chart with me !
Best Regards , Arman Shaban

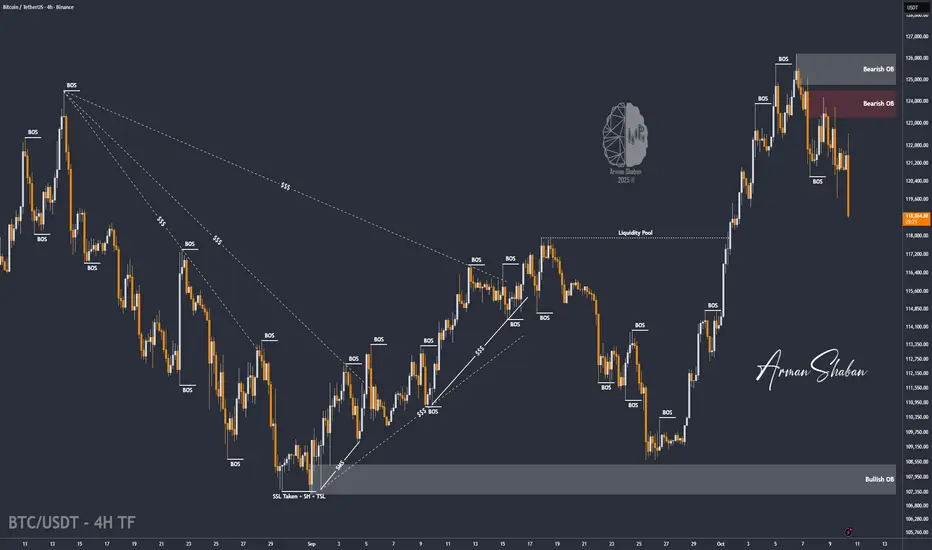
BTC/USDT | BTC Uptober Begins – Massive Rally Loading!By analyzing the Bitcoin chart on the 4-hour timeframe, we can see that the price moved exactly as expected — it hit the $118,000 target and even rallied up to $123,900 . After reaching this key supply zone, which we had marked earlier, BTC faced selling pressure and is now trading around $121,800.
If Bitcoin can hold and stabilize above $120K , we could see a new ATH soon ! “Uptober” has just begun, and it looks like we’re in for a strong bullish month. The next upside targets are $125K, $132K, and $138K.
Please support me with your likes and comments to motivate me to share more analysis with you and share your opinion about the possible trend of this chart with me !
Best Regards , Arman Shaban

What are your thoughts on the current trend ? At this level, the price may experience a slight pullback to the Fibonacci support levels at 0.618 – 0.5, which could present a good opportunity for the next buying entry. If these levels hold, we could witness a strong breakout above the resistance zone BINANCE:BTCUSD
BTC/USDT | BTC Correction in Play – Will $117K Hold the Line?By analyzing the Bitcoin (BTC) chart on the 4-hour timeframe, we can see that after rallying up to $126,000 and setting a new all-time high (ATH), the price faced a sharp correction and is now trading around $119,000.
This drop could extend further toward $117,000, which is a key level to watch closely. If Bitcoin manages to hold above this zone, we could see the next bullish wave begin. Otherwise, the next major demand zones are at $115,000, $113,500, and $112,120.
Please support me with your likes and comments to motivate me to share more analysis with you and share your opinion about the possible trend of this chart with me !
Best Regards , Arman Shaban
The key is whether the upward trajectory can continue
Hello, fellow traders.
If you "Follow," you'll always get the latest information quickly.
Have a great day.
-------------------------------------
(BTCUSDT 1D chart)
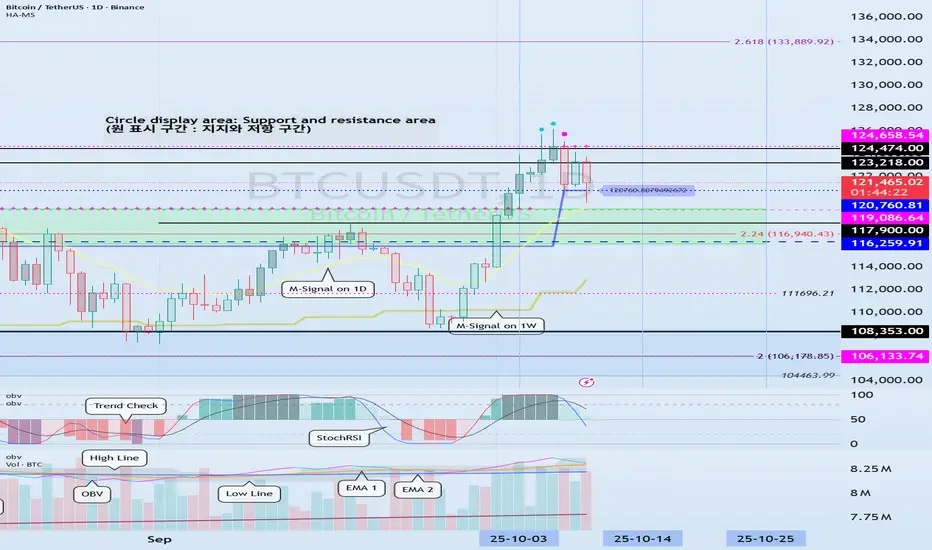
The price rose after forming a DOM(-60) ~ HA-Low range, and is now forming a HA-High ~ DOM(60) range, showing a upward trajectory.
Trend-wise, a decline below the M-Signal indicator on the 1W chart is likely to initiate a downtrend, and a decline below the M-Signal indicator on the 1M chart is expected to initiate a downtrend.
Therefore, when the price falls to the HA-High ~ DOM (60) range, it's important to identify support and resistance levels formed at the M-Signal indicator on the 1W chart.
-
Therefore, it's important to maintain the price above the 116259.91-119086.64 range.
The next important range is the 104463.99-108353.0 range.
-
To break above these key levels or ranges,
- The StochRSI indicator must be trending upward. If possible, it's best to avoid entering the overbought zone.
- The On-By-Signal (OBV) indicator must be trending upward. If possible, it should remain above the High Line.
- The TC (Trend Check) indicator should show an upward trend. If possible, it should remain above the 0 level.
If the above conditions are met, an upward breakout of the HA-High ~ DOM (60) range is expected.
The next period of volatility is expected around October 14th (October 13th-15th).
-
Thank you for reading to the end.
I wish you successful trading.
--------------------------------------------------
- This is an explanation of the big picture.
(3-year bull market, 1-year bear market pattern)
I will explain in more detail when the bear market begins.
------------------------------------------------------