BTC/USDT Short Trade Setup📉 BTC/USDT Short Trade Setup 📉
🔹 Entry Price: $114,632
🔹 Targets:
TP1 → $113,900
TP2 → $113,250
TP3 → $112,400
🔹 Stop Loss (SL): $115,450
🔹 Leverage: 25x–50x (trade safe, don’t over-leverage)
📊 Analysis:
Bitcoin has hit a key resistance zone around $114,600–$114,800. Multiple rejections on the chart suggest a potential pullback is near. If the bearish momentum confirms, BTC could retrace toward the $112,400 support zone.
⚠️ Risk Management Tip: Always use SL to avoid liquidation. Remember, smart trading is about consistency, not chasing every move.
💬 What do you think — will BTC reject from here or surprise us with another breakout? Share your views below!
CRYPTOCAP:BTC
#BTC #Bitcoin #CryptoTrading #ShortTrade #TradingView #BinanceFutures
USTBTC trade ideas

#BTC/USDT Bullish Divergence on 1H, Low Risk Trade#BTC
The price is moving within a descending channel on the 1-hour frame, adhering well to it, and is heading for a strong breakout and retest.
We have a bearish trend on the RSI indicator that is about to be broken and retested, which supports the upward breakout.
There is a major support area in green at 0.0, representing a strong support point.
For inquiries, please leave a comment.
We are in a consolidation trend above the 100 Moving Average.
Entry price: 112090
First target: 112177
Second target: 113111
Third target: 113963
Don't forget a simple matter: capital management.
When you reach the first target, save some money and then change your stop-loss order to an entry order.
For inquiries, please leave a comment.
Thank you.

09-09-2025 BTCUSDTAs shown in the figure: 1H Bullish Bat
The market is not always chaotic and disorderly, and there is a precise geometric beauty hidden in price fluctuations. The harmonic form long strategy is a powerful tool for accurately identifying potential market reversal points based on the Fibonacci ratio. When the form forms perfectly at the key support level, it often indicates the depletion of bearish momentum and the initiation of bullish trends.

Bitcoin (BTC): Buyers Secured 200EMA | Going For $116-117KBTC finally managed to break above the 200EMA after multiple failed attempts — a key bullish signal we’ve been waiting for. Buyers have been showing strength since the reaction from the liquidity zone, and this breakout adds further confirmation to our bullish scenario.
Our next focus remains the bullish CME gap around $116K–117K. As long as buyers hold momentum above the 200EMA, continuation to the upside is the plan.
Swallow Academy

Bitcoin Price Eyes Breakout as ETF Inflows Mirror ATH TrendBitcoin’s price is trading at $114,192 at the time of writing, facing resistance at $115,000. Sustained buying interest at this level will be crucial to trigger the next stage of upward movement.
If ETF inflows remain strong, BTC could flip $115,000 into support and rally toward $117,261 before targeting $120,000. This level would represent a critical milestone in Bitcoin’s ongoing bull cycle.
However, if the breakout attempt fails, Bitcoin may consolidate between $112,500 and $110,000. Such a pullback would invalidate the immediate bullish thesis but still keep BTC within its broader uptrend channel.

BTCUSDT - What next ?? We can see a retest of 111k7 level, but bitcoin was not successful in closing above it.
111K7 continues to remain as our area of interest for now. Closing above which we will change bias.
For now bitcoin is still bearish....
Happy Trading!!!

BTC WEEKLY OUTLOOK - TARGETS & TIME RESISTANCEAs long as Bitcoin holds above 98,200, upside remains open with targets at 129,130 and 135,000.
Watch Oct 27, 2025, marked as a key time resistance (W-1, W-W, W+1). This date can also flip into an inversion, so price action around it will be decisive.

BTC Price Prediction and Elliott Wave AnalysisHello friends,
>> Thank you for joining me in my analysis.
- As I mentioned in my previous idea, we are still moving in this micro correction pink wave X.
- after reaching our main target and hitting it successfully, I made a deep analysis, and I have found that:
We ended all those old steps in the part wave A of the pink X, but my confirmation will be after breaking 113650k and staying below it.
- To create the micro correction wave B, we should go down to test 111k again.
- Breaking 110k, that means we finished the Pink wave X directly, and we will go deeper.
- I will update you soon, and still monitor how we will reach to retest 116800/117350 again or never ....
>> Reminder:
* For the bigger imagination of the BTC path, we are still moving into the Orange wave A of the final White C for ABC from its beginning.
* For the smaller imagination of the BTC path, we are still moving into the Blue wave B of the final Green C for the upper Orange wave A.
* For the tighter imagination of the BTC path, I think we are still moving into the correction wave A for the upper Blue wave B.
Keep liking and supporting me to continue. See you soon!
Thanks, bros

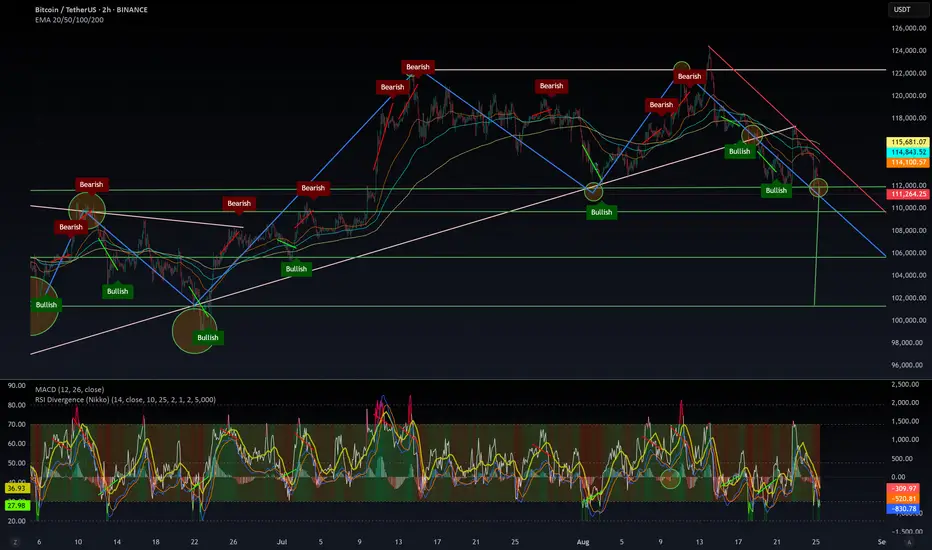
#BTCUSDT 2H ChartPrice reached the 1h supply zone exactly as predicted and got rejected. MACD is showing bullish weakness, RSI is bought and EMAs are turning bullish. This supply zone is not expected to hold and we shall see further bullish movements for #BTC.

Bitcoin Eyes $124K After Confirming Major Market Structure ShiftAfter struggling under the weight of a bearish macro-structure, Bitcoin has decisively shifted momentum by reclaiming a new higher high. The bounce off a critical Fibonacci retracement level signals renewed strength and the possibility of charting a fresh all-time high.
Key Technical Points:
- Support confirmed at the 0.618 Fibonacci retracement.
- Point of control resistance established at $118,000.
- Break above $118K opens the door toward $124K and new ATH.
Bitcoin’s recovery began when price action respected the 0.618 Fibonacci midpoint, a level often seen as a “golden pocket” for reversals. This bounce sparked a sequence of higher highs, signaling a departure from the broader bearish structure that had dominated since the previous all-time high.
Momentum has carried price toward the point of control at $118,000, where a significant volume cluster lies. A sustained breakout here is crucial for continuation, as it would validate demand above this level and neutralize lingering resistance.
Should buyers push through with conviction, the path toward $124,000 becomes increasingly likely. That move would not only establish a new all-time high but also cement the broader reversal in market structure.
What to Expect in the Coming Price Action:
Bitcoin remains poised for expansion, with $118,000 as the key pivot point. A breakout here could accelerate a rally toward $124,000, while holding above the 0.618 Fibonacci ensures that bullish momentum remains intact.

BITCOIN passed the PIVOTOn the daily timeframe, Bitcoin broke above the monthly pivot at 113,350 with a strong green candle yesterday, surpassing the resistance area at 112,700. The next resistance is around 119,380, the first pivot resistance.

$BTC bounce at $112 or drop down to $101.3??CRYPTOCAP:BTC is forming a massive “M” pattern with a potential target around $101.3.
There are multiple support levels on the way down, so a bounce could happen at any of them. Ideally, this scenario gets invalidated with a strong rebound from $112K. Otherwise, the correction may drag on for weeks until a solid bottom is found.
The RSI is oversold on the 2H, but on the 1W timeframe, CRYPTOCAP:BTC looks like it’s just entering a longer-term correction.
⚠️ If the weekly bearish trend confirms, we could be facing several months of downside.
Will this trigger the start of alt season, or will altcoins get crushed even harder? Nobody can say for sure—so stay cautious and don’t get trapped by FOMO.
Here is the 1W chart, which is scary to be honest.
$BTC : bearish MACD crosover on 1WThe chart speaks for itself: we have a bearish crossover on the weekly MACD — historically a strong signal for a 3 to 6-month correction.
I know this goes against the current bullish sentiment, but every time this setup has appeared, the market corrected for several months. This time, however, the RSI isn’t extremely overbought, which could mean a shorter correction (1–2 months).
👉 Will this time be different?
If history repeats, the correction target sits around $96K–$98K at the 50-week SMA, a level that has always provided strong support in the past.
But if that support breaks… welcome to a new bear market.

BTC Breakout Update – Bullish Setup in Play#Bitcoin has been consolidating in a falling wedge pattern – a historically bullish formation. Recently, #BTC has broken out of the wedge, signaling potential momentum shift.
Key Points to Watch:
Wedge breakout already confirmed (bullish sign)
Structure shows LLs & LHs turning – possible trend reversal
Next confirmation needed: break above previous LHs & resistance zone
Only after this breakout can we confidently enter a long trade with proper risk management
Strategy:
I’ll be waiting for a clear breakout + retest of the resistance to position long. Until then, patience is key.
What’s your view – do you think #BTC will continue its breakout and start a strong uptrend, or is this a fake-out before another drop?
Drop your thoughts in the comments & don’t forget to hit like if you found this useful. Follow for more daily #BTC updates & trade ideas!
#BTC #Bitcoin #Crypto #CryptoTrading #BTCUSD #BitcoinAnalysis #BitcoinPrice #CryptoMarket #BTCUpdate #BitcoinTrading #CryptoAnalysis #CryptoSignals #BTCChart #CryptoCommunity #BitcoinBreakout #CryptoTrend #BTCPriceAction #BitcoinTechnicalAnalysis #CryptoIdeas

Bitcoin | Long | 6 hrsThis technical analysis is for informational and educational purposes only. It does not constitute financial advice. Remember to always research and consult with a professional before making investment decisions. Good luck! 📈💼🚀

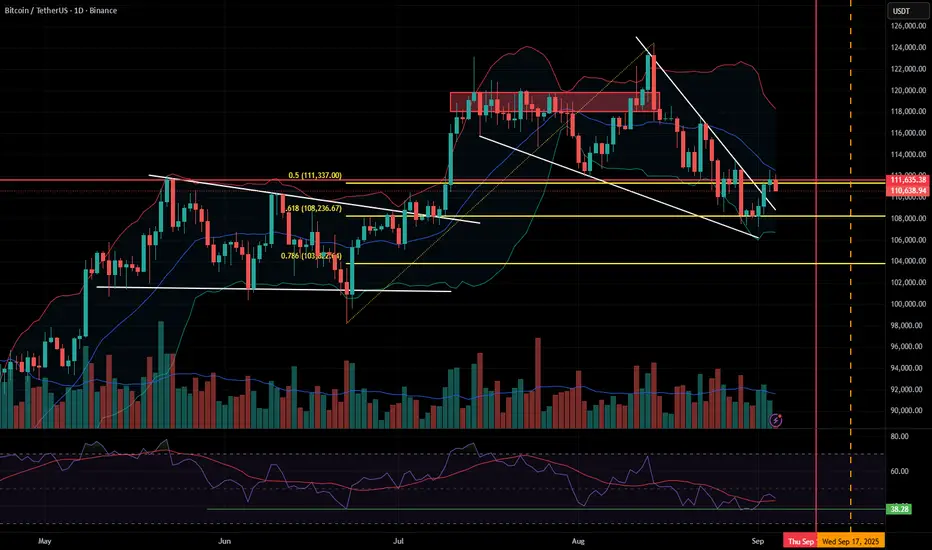
How will BTC play in September?BTC has been in a correction since reaching its most recent ATH of 124,474 USDT. As shown in the shared chart, the correction has formed a bullish falling wedge and this chart pattern was strongly broken to the bullish side with good volume after bouncing off from the 0.618 Fibonacci level of the recent decent.
The breakout is further confirmed by the fact that RSI in the daily frame has bounced off the 38.28 support, where it has not being broken since mid-June.
Even though a strong breakout took place, the price action seems to struggle to break the basis line of the Bollinger Band in the daily time frame. This can be the healthy price action waiting to continue the bullish momentum and waiting for this breakout will be the ultimate conformation.
Most people are stuck with the unhealthy statistics of September being historically bad for BTC and other altcoins. Markets follow cycles. The cycles change as markets mature as their driving dynamics and fundamentals expand. So, sticking with such a statistic is a very unhealthy mindset for a trader.
Compared to previous cycles, the market is heavily driven by institutional flows through ETFs along with the derivatives market. Also, with the high probability of rate cuts in the September FOMC meeting on 16th and 17th of September the current Bull run can extend until somewhere around November to end of the year.
BTC is already at a 13.17% correction from its recent ATH. If the above technical factors go through successfully with positive news from rate cuts and healthy inflow in the derivatives market, we will see BTC resuming its bullish sentiment.
If it fails break these resistances, we may see the continuation of the correction at least till mid to end September and then the resumption of the bullish trend.
What people have to understand is whether thus cycle is extended or not, we are slowly approaching the last boost towards the cycle peaks. The corrections might end quickly or continue for some more days. But based on the current stage, the ultimate action is reaching the cycle tops.
So make sure to take advantage of the corrections and cash out along the reversal with a disciplined strategy. If not you'll just sell into corrections and buy into tops as the majority.
BTC Inverse Head and ShouldersThe chart clearly shows an inverse head and shoulders formation:
Left Shoulder: ~Aug 26 low.
Head: ~Aug 29 low.
Right Shoulder: ~Sep 5-7 low.
This is a bullish reversal pattern after a prolonged downtrend. The breakout above the neckline (around 113,200 – 113,500) confirms the bullish bias.
Fib & Extension Targets :
Immediate target: Fibonacci 1.0 extension ~119,600.
Extended target: 1.618 extension ~123,500.
These align well with previous resistance levels (early August highs).

BTC SLOW SLOW TRADE Short BTC with SL 114k, first target 112.8k, main target 111.9k–111.5k.
TP1: 112.8k (first liquidity pocket).
TP2: 111.9k–111.5k (main draw).
114k (last rejection high).
Too slow for me. But this is after all the expansion.

BTC is bullish bullish!BTC is expected to visit 12600-111000 region first before going up inside this curve.

Btcusdt Btc heading to 117k easily . The resistance has been broken on the 4hrs clearly I think one final push up is left until bull run finish maybe after the rate cuts then we see btc reach a new ATH

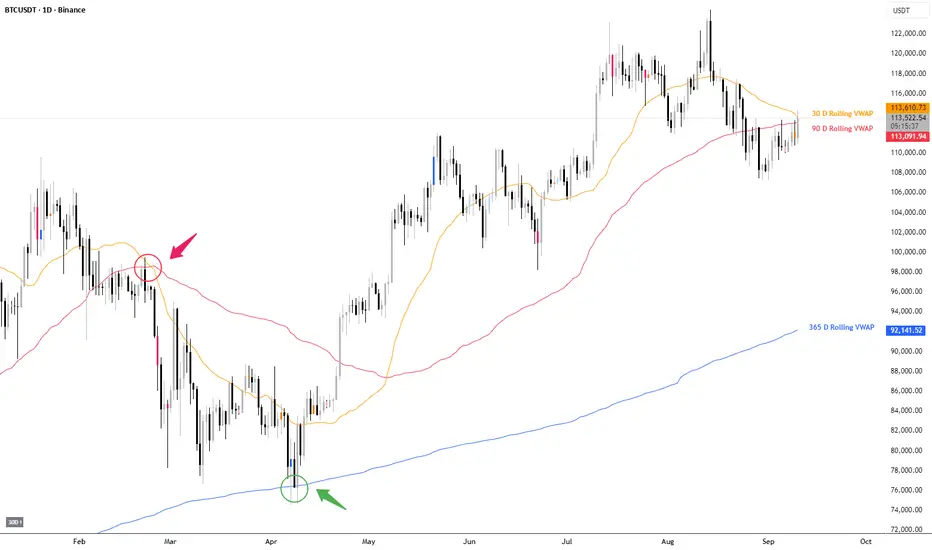
BTC Daily – Auction at VWAP BalanceBTC is testing a key auction battleground where the 30-day rolling VWAP (short-term value) and the 90-day rolling VWAP (quarterly value) are converging.
In February (red circle), the 30D VWAP slipped under the 90D VWAP — a sign that the short-term auction was no longer able to sustain bids above intermediate value. This imbalance triggered a liquidation move, pushing price down toward the 365D VWAP (yearly value).
In April (green circle), buyers defended the 365D VWAP, treating it as a long-term fair value anchor. That defense re-initiated the rally and reset the auction higher.
Today, the market is once again probing this value overlap zone between the 30D and 90D VWAP. The outcome will define whether short-term participants can accept higher value or whether rejection sends price back into deeper balance.
Auction scenarios to monitor:
Acceptance above 113.6K → short-term value migrates higher, opening path for continuation towards 119-120K.
Rejection here → signals that buyers are unwilling to accept higher value; price may rotate lower toward 103-106K, with the 365D VWAP (92K) acting as the deeper fair value magnet.
In auction terms, BTC is in price discovery mode at overlapping value areas .
Watch for where acceptance forms — that’s where the next directional conviction will emerge.
My next trade idea! 🔎 What we do:
Identify high-probability setups
Break down price action with clarity
Focus on continuation plays, deviations, and market structure shifts
Keep learning simple, practical, and effective
⚡ Today’s Trade Idea:
Setup: Simple continuation play from demand OR a deviation play from the consolidation range.
Entry Trigger: Waiting for a market structure change ✅ for confirmation before involvement.
💡 Mission:
Helping traders build confidence, discipline, and a solid edge in the markets.

My next trade! 🔎 What we do:
Identify high-probability setups
Break down price action with clarity
Focus on continuation plays, deviations, and market structure shifts
Keep learning simple, practical, and effective
⚡ Today’s Trade Idea:
Setup: Simple continuation play from demand OR a deviation play from the consolidation range.
Entry Trigger: Waiting for a market structure change ✅ for confirmation before involvement.
💡 Mission:
Helping traders build confidence, discipline, and a solid edge in the markets.
