Bitcoin to retest the trendline the formation of a third leg on the trendline before a bullish takeoff is expected on the daily TF. Bitcoin on a bullish trend mean we can only anticipate a buy eventually it didn't break the trendline. the price is expected to reach the 130,000 price level.
USTBTC trade ideas

Where can Bitcoin Go? Part 2🌟 Bitcoin's Breakout Surge: Professor's Big Charts Revealed 🌟
Part1 was a Legendary one with amazing, pin-point precision from miles away:
📈 Live Analysis
Watch thean in-depth journey through Bitcoin's latest surge as we go live on TradingView. Get ready for a session packed with insights and the unveiling of the Professor's big chart. Join us: Live Stream: www.tradingview.com
🚀 The Breakout Chart Breakdown
Witness the bullish momentum as Bitcoin smashes past the $47,650 barrier. With my analysis, we're looking at a bull run targeting $59.9K,
69K
, and the ambitious $79K. 🎯 Stay bullish and watch as the charts unfold the story live!
💹 Historic Patterns: A Roadmap to $79K
Reflect on the last breakout at $31,100 and its staggering rise to $46,000. Our charts have been the compass leading us to these profitable winds. Don't miss out as we dissect the potential climb to $79K, live!
🔍 Last Year's Chart: The Trendline Triumph
Cast your minds back to January 2023, when Bitcoin was a humble $18,000. Fast forward, and we're witnessing a breakout reminiscent of December 2020's rally from $7,500 to $24,000. Could we be on the cusp of reaching new all-time highs? Let's explore together.
⏱️ Halving Cycles: This Time It's Different
Every cycle writes its own story, and this one's no exception. We're approaching the halving with a market more aware and ready to advance. Tune in as we analyze why we might see an all-time high sooner than the previous cycles.
🌐 Join the Live Stream for the Full Picture
There's much more to cover, from halving cycles to breakout patterns. Ensure you're part of the live session for a comprehensive analysis that could redefine your trading strategy.
Catch the full live session and secure your front-row seat to Bitcoin's exciting journey: Join the Live Stream: www.tradingview.com
One Love,
The FXPROFESSOR 💙


Daily Bitcoin Signal: Sell Now , target 110,500Bitcoin is currently showing signs of strength as it tests the key resistance level around 113,000.
A confirmed 1H candle breakout this zone could trigger fresh bearish momentum, opening the door for lower targets in the short term.
My Personal Long Setup
Entry : Sell Now from current Price 112,900
🎯 Target 1: 111,900
🎯 Target 2: 110,600
❌ Stop-loss: 115,500
👍 Don’t forget to boost this trading idea if you found it helpful,
and follow me for more daily crypto insights and trade signals.
⚠️ Please note:
This is not financial advice – I’m only sharing my personal trades.
Always do your own research before taking action.
Best of luck 🌹

BTCUSDT Bullish Rebound Setup From Support RetestTrade Setup Analysis
Pair: BTCUSDT
Timeframe: 1D (Daily)
Position Type: Long (Buy)
Entry Point: 115,554.94
Positioned exactly between the stop loss and take profit zones, providing an optimal entry after a pullback to support.
Stop Loss (SL): 112,693.78
Placed below the key support zone to limit downside risk. Risk is approximately -2.48% from entry.
Take Profit (TP): 124,843.07
Target set at a recent swing high, offering a potential upside of around +8.04% from entry.
Risk/Reward Ratio: 3.25
A favorable setup offering more than triple the potential reward compared to the risk.
Technical Outlook:
BTCUSDT experienced a sharp pullback after testing highs, now retesting a support level that aligns with previous consolidation. This could present a buying opportunity if bullish momentum resumes.
Bullish Scenario: Holding above 115,554.94 and forming higher lows could trigger a rally toward 124,843.07.
Bearish Invalidation: A break below 112,693.78 would invalidate the setup and may open the door to further downside.
Summary:
This setup targets a rebound from support with a clearly defined stop loss and a strong reward potential, making it suitable for swing traders seeking favorable R/R conditions.

#BTCUSDT 4H ChartPrice is currently retesting the S/R Flip at 113k where it is bouncing from as well as the 100MA. MACD is showing some bullish weakness, RSI is bought and EMAs are turning bullish. Price is expected to keep pushing up aiming towards the 115.5k area where we have a minor supply zone.

Forecast for BTCUSDT 30th September 2026 (Updated)My projection / guess for BTC for the current week. Continuation to ~$115k followed by a retrace to ~$106k then continuation up to ~$120k followed by a huge dump to ~$98k-100k then up to new all time high.

BTC 4H Update – Correction Possibly EndingOn the 4H chart, it looks like Bitcoin’s corrective phase might be over, but we don’t yet have full confirmation.
🔑 Confirmation signal:
If BTC makes a higher low above $108,810 or even a double bottom, that would confirm the end of the correction.
Until then, patience is key — don’t rush into trades.
❌ Invalidation:
If BTC breaks below $108,810, this analysis becomes invalid.

BTC to go parabolic to 100 oz Gold by EOY 2025!Gold and Bitcoin are both valuable hard assets and from my observation, the Bitcoin chart to Gold is much better predictable than it's price to USD. The reason might be because Gold holds it's purchasing power over time through the history, and in fact it is the base line for the purchasing power, but Dollar depends on how much it gets printed and cannot be reliably predicted. That's why when you look at BTC/Gold chart, most of the times you see exact double tops or exact double bottoms.
I was predicting BTC would get to $100K USD when it hits it's previous top to Gold (37 oz) and so I was predicting about 8 month before it happens that BTC will be $100K when Gold is 2650 and it happened. I was surprised myself that it held true.
Looking into Gold price history, we can reliably say that Gold will not stop here and will march to $8000 within couple of years. However I think it has hit it's top for the year, or max $4000 will be the 2025 top. Then when Gold pulls back, BTC will get the chance to go parabolic, and has it's last rise of this bull market, and I expect it should take BTC to near 100 oz Gold. So if we want to put all together, Gold = 3350 where it pulls back and BTC= 100 oz = $335,000. I know the Bitcoin whales are playful sometimes, so we might get into $333,333 per BTC.
I remember in Nov 2013 everyone was talking about bitcoin flipping gold (1 BTC getting to 1 oz Gold) and well, it didn't happen at that time and it had to come back in 2017, but it got close enough. We might have the same kind of situation here so starting to drop anywhere from $270k to $330k might be what we get.
I don't publish many analysis's on TV, but I thought I'd put this here, it might get me famous ;)

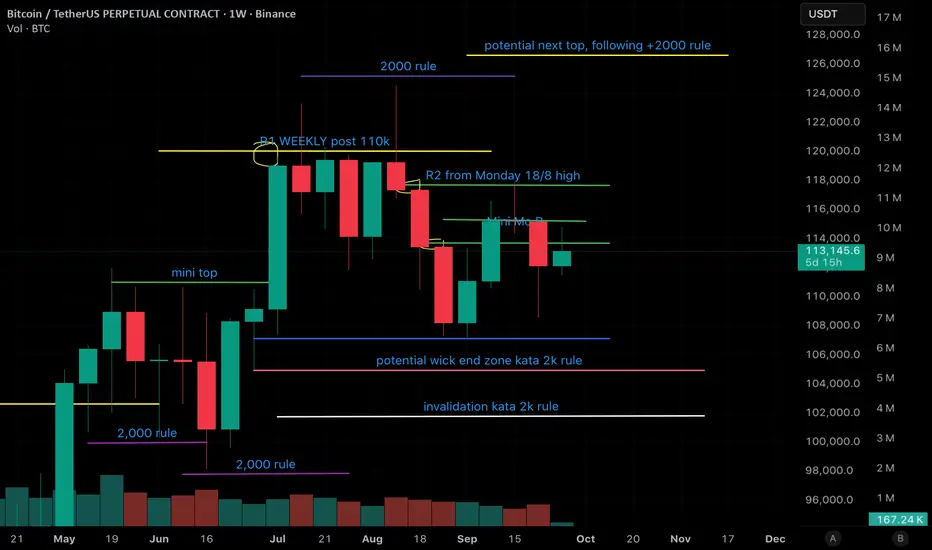
Presenting the bottom/top formula: The $2,000 RuleIn this idea we try to present The $2,000 Rule , which has been back tested as far as one year with 90% accuracy hitting the very wick end exact top or bottom.
The formula is simple, in order to find the very next wick top or bottom singularity, simply calculate either from the previous top or bottom wick singularity either +- $2,000.
(if you're trying to find a top it's +$2,000, if bottom -$2,000).
You can back-test it yourself, works best on 1Week timeframes for a clearer picture.
GLOSSARY:
Wick Singularity: The very end of the wick, the very last point of the wick.
kata: Ancient greek for 'according to'. κατά
$BTCUSDT Long Limit SetupCRYPTOCAP:BTC is taking short term pull back here.
Confluences:
Broke out from the current lower-lower structure.
Shifted 4hr+1D Structure to Bullish
Getting a pull back to 1D-4H OB.
Keep limits open or stay updated with me.
Follow for more <3

BTCUSDT Short Position on futuresBitcoin seems to have a downtrend below 114,000. Opened a short position around these important levels
Entry Price: 113,950
SL: 114,950
TP1: 112,000
TP2: 110,950

BTCUSD BUYBTCUSD H4 CHART
Hello Traders. If you find this analysis useful, please support me with your likes and comments.
If you have another analysis at this pair, please share in comments, I will be glad to discuss with you.

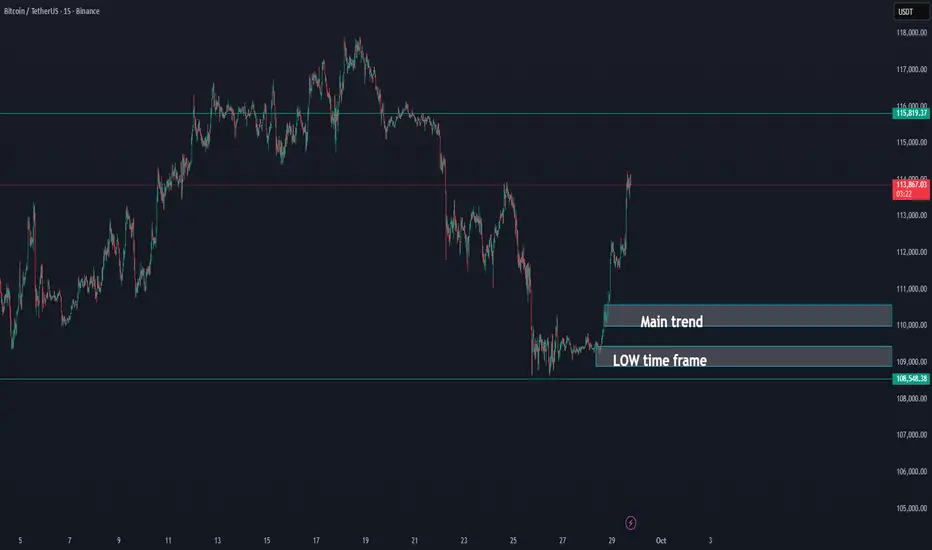
Bitcoin going on the flow UPDATE 29-09-2025BTC/USDT Update
✅ Bitcoin has successfully moved above the main trend, a strong signal that momentum is shifting positively.
🔑 As long as BTC holds this main trend support, the outlook remains bullish.
📈 This structure opens the door for further upside continuation, with buyers maintaining control above this level.
📌 Summary:
BTC is currently holding above the main trend, which keeps the short-term outlook positive as long as this level is defended.
BITCOIN BITCOIN WATCH 114-116 ZONE descending trendline rejection and break and close will be 119-120k.
then we will change our chart to reflect the new upswing.
#btc #bitcoin

Bitcoin Recovery: Key Levels to Watch This WeekIn the past 24 hours, Bitcoin has shown a solid recovery — but will it continue?
This week’s pivot point is at 112,054 , while the risk level is 110,307 . If that breaks, there’s a high probability of seeing a move down toward 105K (explained in more detail in the video idea).
At the moment, the price is above key moving averages. The last breakout happened on increased volume, and as long as momentum holds, the outlook remains bullish. Still, the price can’t rise forever, so a local correction would be logical, with the support zone for such a move in the 111,400 – 110,700 range.
Targets for this week: 114,636 , 116,231 , and 118,813 .

Last Point of Supply - 110k to 117kAfter today, it is in my opinion that the drop will be DELAYED!
I believe we will visit around 110k or lower, get everyone shorting and then 116.8k-117.4k will be revisited for a "BULLISH OCTOBER" before 100k breaks down
The majority loses

#BTCUSDT 6H ChartPrice moved up aggressively once again after liquidating the low at 109.33k. MACD is showing strong bullish momentum, RSI is bought and EMAs are neutral. Price needs to close above the resistance at 113k in order to expect further bullish movements.

BTC long, because ... why not?BTC is "THE" asset against monetary expansion and Powell kind of gave the green light, not for more rate cuts, but he acknowledged that Trump might be "irght" about cutting rates.
Market still price 2 or 3 rate cuts by EOY.
there is no reason BTC does not trade above 120k soon, and why not 144k when we are at it?
H12 200 MA/EMA as a nice inflection point here.

btcBitcoin is at resistance
We are waiting for it to break through and enter the sale after reaching resistance

$8 Billion Bitcoin Accumulation Could Launch Price to $115,000At the time of writing, Bitcoin is trading at $111,966, just shy of the $112,500 resistance. The recent bounce from below $110,000 reflects investor demand, but breaching key resistance remains critical for further upside momentum.
If Bitcoin successfully climbs past $112,500, the crypto king could reclaim $115,000 as a support level. This would open the door for a rally toward $120,000 in the coming days, fueled by accumulating investor demand and reduced selling pressure on exchanges.
However, failure to overcome $112,500 resistance would expose Bitcoin to further downside risks. A drop back to $110,000 or even $108,000 remains possible. This would invalidate the bullish outlook and trigger renewed skepticism about Bitcoin’s near-term recovery.

$BTC - LTF PlayCRYPTOCAP:BTC | 1h
If we can hold 111k during New York session, I think we can still tag 113.5k (swing point)
We could see a rejection around 113.2-113.5k, though I'm still looking to tag 114.5-114.8k to rebalance (bearish imbalance)
