$BTCUSDT Long Limit SetupCRYPTOCAP:BTC is taking short term pull back here.
Confluences:
Broke out from the current lower-lower structure.
Shifted 4hr+1D Structure to Bullish
Getting a pull back to 1D-4H OB.
Keep limits open or stay updated with me.
Follow for more <3
USTBTC trade ideas

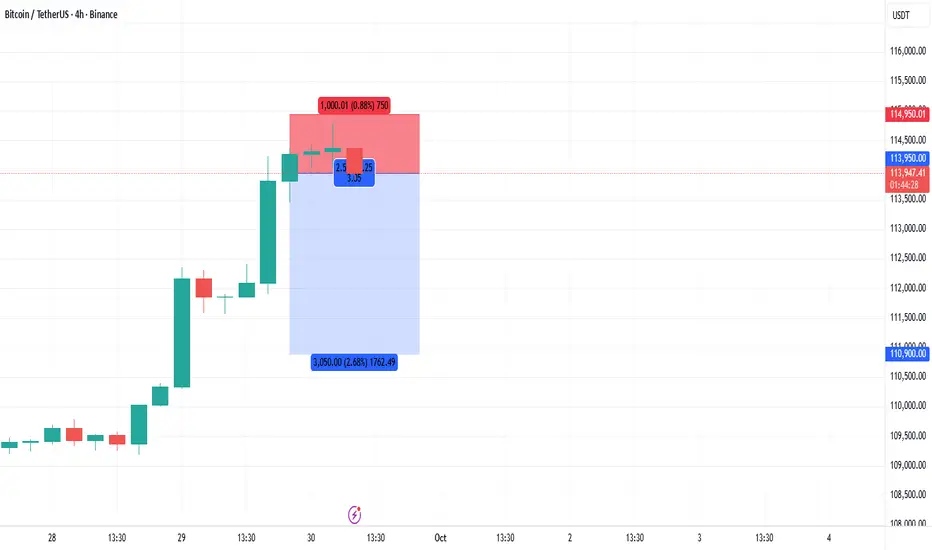
BTCUSDT Short Position on futuresBitcoin seems to have a downtrend below 114,000. Opened a short position around these important levels
Entry Price: 113,950
SL: 114,950
TP1: 112,000
TP2: 110,950

BTCUSD BUYBTCUSD H4 CHART
Hello Traders. If you find this analysis useful, please support me with your likes and comments.
If you have another analysis at this pair, please share in comments, I will be glad to discuss with you.

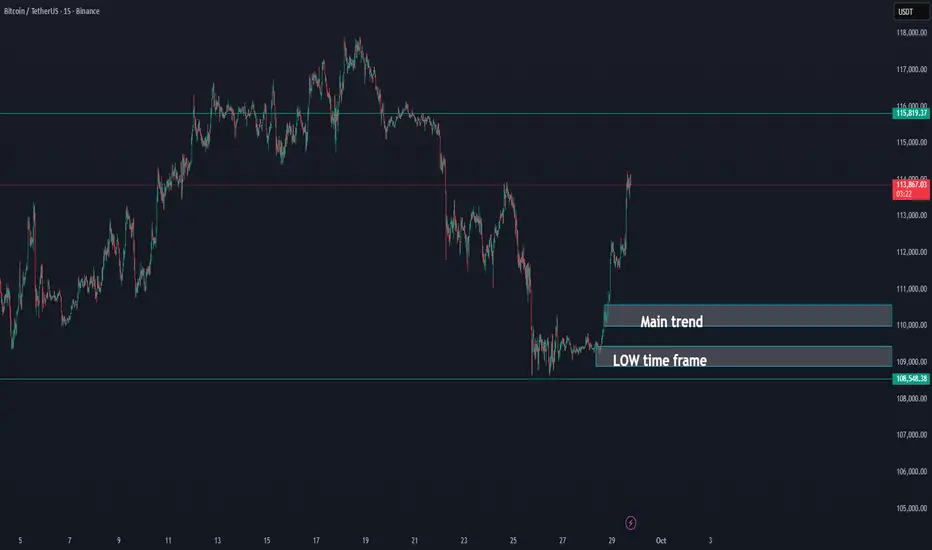
Bitcoin going on the flow UPDATE 29-09-2025BTC/USDT Update
✅ Bitcoin has successfully moved above the main trend, a strong signal that momentum is shifting positively.
🔑 As long as BTC holds this main trend support, the outlook remains bullish.
📈 This structure opens the door for further upside continuation, with buyers maintaining control above this level.
📌 Summary:
BTC is currently holding above the main trend, which keeps the short-term outlook positive as long as this level is defended.
BITCOIN BITCOIN WATCH 114-116 ZONE descending trendline rejection and break and close will be 119-120k.
then we will change our chart to reflect the new upswing.
#btc #bitcoin

Bitcoin Recovery: Key Levels to Watch This WeekIn the past 24 hours, Bitcoin has shown a solid recovery — but will it continue?
This week’s pivot point is at 112,054 , while the risk level is 110,307 . If that breaks, there’s a high probability of seeing a move down toward 105K (explained in more detail in the video idea).
At the moment, the price is above key moving averages. The last breakout happened on increased volume, and as long as momentum holds, the outlook remains bullish. Still, the price can’t rise forever, so a local correction would be logical, with the support zone for such a move in the 111,400 – 110,700 range.
Targets for this week: 114,636 , 116,231 , and 118,813 .

Last Point of Supply - 110k to 117kAfter today, it is in my opinion that the drop will be DELAYED!
I believe we will visit around 110k or lower, get everyone shorting and then 116.8k-117.4k will be revisited for a "BULLISH OCTOBER" before 100k breaks down
The majority loses

#BTCUSDT 6H ChartPrice moved up aggressively once again after liquidating the low at 109.33k. MACD is showing strong bullish momentum, RSI is bought and EMAs are neutral. Price needs to close above the resistance at 113k in order to expect further bullish movements.

BTC long, because ... why not?BTC is "THE" asset against monetary expansion and Powell kind of gave the green light, not for more rate cuts, but he acknowledged that Trump might be "irght" about cutting rates.
Market still price 2 or 3 rate cuts by EOY.
there is no reason BTC does not trade above 120k soon, and why not 144k when we are at it?
H12 200 MA/EMA as a nice inflection point here.

btcBitcoin is at resistance
We are waiting for it to break through and enter the sale after reaching resistance

$8 Billion Bitcoin Accumulation Could Launch Price to $115,000At the time of writing, Bitcoin is trading at $111,966, just shy of the $112,500 resistance. The recent bounce from below $110,000 reflects investor demand, but breaching key resistance remains critical for further upside momentum.
If Bitcoin successfully climbs past $112,500, the crypto king could reclaim $115,000 as a support level. This would open the door for a rally toward $120,000 in the coming days, fueled by accumulating investor demand and reduced selling pressure on exchanges.
However, failure to overcome $112,500 resistance would expose Bitcoin to further downside risks. A drop back to $110,000 or even $108,000 remains possible. This would invalidate the bullish outlook and trigger renewed skepticism about Bitcoin’s near-term recovery.

$BTC - LTF PlayCRYPTOCAP:BTC | 1h
If we can hold 111k during New York session, I think we can still tag 113.5k (swing point)
We could see a rejection around 113.2-113.5k, though I'm still looking to tag 114.5-114.8k to rebalance (bearish imbalance)

BTC market snapshot BTC level at 108K has held so far. A breakout above 116K would send us to test a new all-time high. But I’m still holding a short position — there’s a divergence on the higher timeframe, and if we reach new highs, there’s a strong chance of a short squeeze. For now, it’s the classic sideways movement where there’s nothing to do.
Alerts: 108K and 116K.
A breakout to new highs would be my opportunity to open a short.

BTC/USDT - BREAKOUT Or BREAKDOWN AHEADThe price is currently trading around the 112,112 USDT level with slight intraday fluctuations. The chart highlights a key horizontal support and resistance (S/R) structure with two red horizontal lines marking these zones.
1. Resistance (R) Zone
The upper red horizontal line, marked as “R,” is acting as a resistance level around the 112,400 USDT region. Price has tested this level multiple times in the recent sessions. A clear breakout above this resistance could signal further bullish continuation.
2. Support (S) Zone
The lower red horizontal line, marked as “S,” is situated around the 111,600 USDT level. This zone has provided a strong demand base for buyers. If the price retraces, this level will act as a critical support.
3. Current Price Action
At the time of observation, Bitcoin is consolidating right above the resistance zone, suggesting a possible breakout attempt. The candlesticks indicate bullish momentum leading into the resistance, with a series of higher lows forming before the test of resistance. This pattern reflects increasing buying pressure.
4. Possible Scenarios
• Bullish Scenario: If the price successfully breaks and holds above the resistance zone (R), it may trigger a move towards the next target to the upside, projected around the 112,800 – 113,200 USDT region. The structure suggests the possibility of forming a bullish continuation pattern, with traders targeting higher resistance levels.
• Bearish Scenario: If the breakout attempt fails and Bitcoin gets rejected at resistance, price could retrace downward. A move below the support zone (S) at 111,600 USDT would likely signal bearish momentum, with the next target projected around the 111,200 – 110,800 USDT range.
5. Market Sentiment
The price action is consolidating in a range-bound structure between support and resistance. This often reflects market indecision before a breakout. A breakout from this range, either above resistance or below support, will provide a clearer directional bias.
⸻
Conclusion:
The BTC/USDT 15-minute chart is currently at a critical juncture. Traders should closely monitor whether Bitcoin sustains above the 112,400 resistance to confirm a bullish breakout, or if it fails and drops back below support at 111,600, signaling bearish continuation. Patience and confirmation of breakout direction are key before entering new trades.

[SeoVereign] BITCOIN BEARISH Outlook – September 30, 2025Today, as of September 30, I am writing to share my bearish perspective on Bitcoin with a short position.
In this idea as well, I am leaning toward a decline. There are two main reasons for this.
First, the 1.13 ALT BAT pattern. This harmonic pattern has already been confirmed, but since the detailed Fibonacci ranges do not fully match, we cannot rule out the possibility of one more upward wave. Therefore, I am first entering a short position with only a small portion, and then plan to flexibly increase the position depending on the price action. In other words, if the decline unfolds immediately, my analysis will be accurate; on the other hand, I also judge that there is a sufficient possibility of one more short-term wave forming before a reversal to the downside.
Second, the downward breakout of the trendline. Rather than analyzing the harmonic pattern independently, I prefer to combine it with trendline analysis. This is due to the flexible nature of harmonic theory, and through trendlines I can measure both the reference points for position sizing and the strength of momentum.
For these reasons, I entered the first short position, with an average target price set at 110,500 USDT.
Recently, not only the stock market but also the cryptocurrency market as a whole has been in poor condition. I hope that those who are experiencing losses will soon encounter better conditions, and I also hope that sharing my perspective can provide even a small help.
I will continue to update my ideas in line with the chart developments and transparently share my thoughts.
Thank you for reading.

BTCUSDT Review September 29 2025Short-term price movement ideas.
The price reached a weekly Break of Structure (BtS), which was later confirmed on the daily chart, initiating a bearish Order Flow (OF). At the moment, we’ve seen an aggressive bullish reaction that brought price into a daily zone of interest. If this zone receives confirmation on the 4H chart, we can then consider opening short positions with the target of updating the previous low.
Be flexible, adapt to the market, and the results will come quickly. Good luck to everyone.

Bitcoin (BTC): Price Remains Above EMAs | Bullish For Now!BTC is ranging tightly around the EMAs, with buyers and sellers battling for short-term dominance. The structure is clear — we’re holding above the $108K liquidity zone, and as long as this level doesn’t get broken, the higher targets remain in play. The key here is a breakout from the current range, which would open the door for continuation toward $140K–$150K. Patience is key while price consolidates.
Swallow Academy

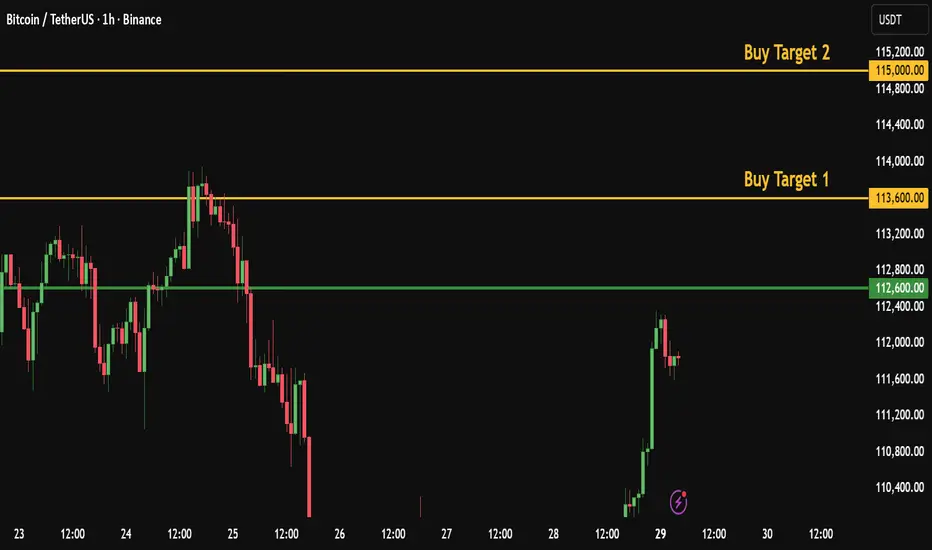
Daily Bitcoin Signal: Watching the 112,600 Breakout, target 115K
Bitcoin Daily Numeric Analysis
Bitcoin is currently showing signs of strength as it tests the key resistance level around 112,600. A confirmed breakout above this zone could trigger fresh bullish momentum, opening the door for higher targets in the short term.
My Personal Long Setup
If price breaks and closes a 1H candle below 109,150, I will enter a short trade.
🎯 Target 1: 108,250
🎯 Target 2: 107,500
❌ Stop-loss: 110,600
👍 Don’t forget to boost this trading idea if you found it helpful,
and follow me for more daily crypto insights and trade setups.
Please note:
This is not financial advice – I’m only sharing my personal trades.
Always do your own research before taking action.
Best of luck 🌹
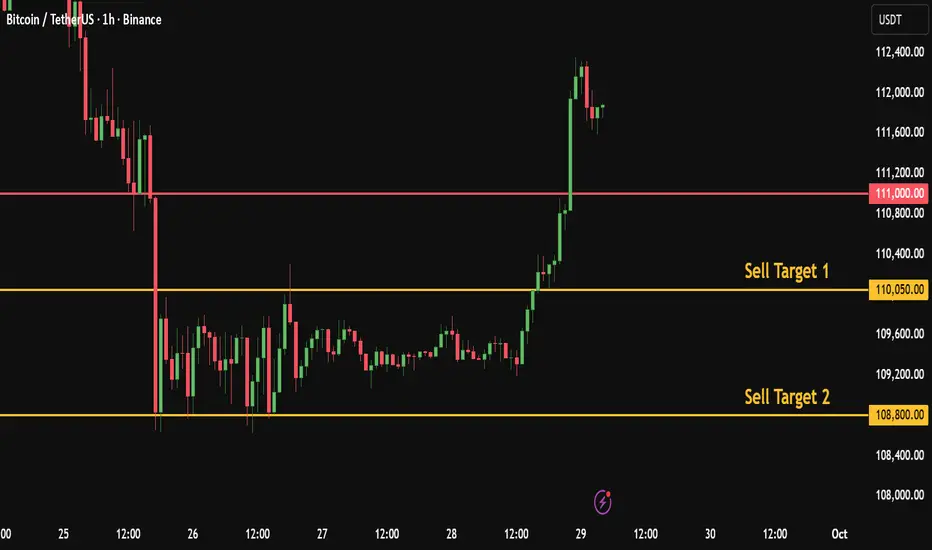
Daily Bitcoin Signal: Watching the 111K Breakout, target 108KBitcoin Daily Numeric Analysis
Based on my numeric analysis, Bitcoin is showing potential weakness near key support.
My Personal Short Setup
If price breaks and closes a 1H candle below 111K, I will enter a short trade.
🎯 Target 1: 110,050
🎯 Target 2: 108,800
❌ Stop-loss: 112,700
👍 Don’t forget to boost this trading idea if you found it helpful,
and follow me for more daily crypto insights and trade setups.
Please note:
This is not financial advice – I’m only sharing my personal trades.
Always do your own research before taking action.
Best of luck 🌹
Bitcoin (BTC): Calm Past Weeks | Beginning of 2026 Expectin PeakSince the start of this month, the price of BTC has been way too stable in a way where the price struggles to establish a proper breakout.
Despite that the game plan remains the same, we are expecting 2026 to be the local top for this cycle and mark the start of a bear market.
Swallow Academy

#BTCUSDT.P (1H Chart)#BTCUSDT.P
(1H Chart)
🔹️ Bitcoin Analysis Update 🔹️
The bullish outlook from the previous analysis remains valid.
The yellow box resistance has been engulfed, and I expect the bullish move to continue.
📌 Best entry zone: Blue Box
🎯 Main target for this long setup: Red Box (114,000 – 114,500)
🚀 If you enjoyed this analysis, please give it a boost 💙
and to not miss any new analyses or setups, make sure to follow me 📊
🆔️ @Rasoolahmadi

#BTCUSDT.P (15m Chart)#BTCUSDT.P
(15m Chart)
🔹️ Update 🔹️
Entry zone (109,800 – 109,500) was not reached,
but Targets 1, 2, and 3 (111,000 – 112,400) have been hit ✅
⚠️ Bullish scenario played out, but no entry was triggered. Risk management first.
🆔 @Rasoolahmadi
