Complete system for Day & Swing TradersHey whats up traders,
Today Im going reveal simple but effective way to analyze and trade any markets - Stocks, Indices, Forex and Crypto. This thing works on everything because it's based on liquidity manipulations.
It's 100% mechanical structured aproach with fixed targets and defined. So unlike traders who trade various patterns and have on charts different patterns and diagonal subjective lines, you can backtest it and measure its and yours execution performance to get your statistical data for Risk Reward and Winning Ratio.
‼️Once you obtain such data from data sample large enough you will also solve biggest trading problems - FEAR, GREED and OVERTRADING. Why ?
📊 Because if you know you win rate is 60 - 70 % trades with RR 2.3 with aprox. 4 trades in a month per instrument, why would you then do following?
Try to look for trade every day when there is not your setup.
Fear open next trade after few losses?
Open huge gamble trade if you know 30% of trades can be loss
Try to hold for unrealistic target if you know most of your trades hit 2.5 RR
Try to pass prop challenge in one trade ?
... and many more psychological and undisciplined mistakes which discretional pattern traders without EDGE and statistical data about their strategy are doing.
🧠 Having mechanical system with backtested data is your EDGE.
💪 That is what makes you DISCIPLINED TRADER.
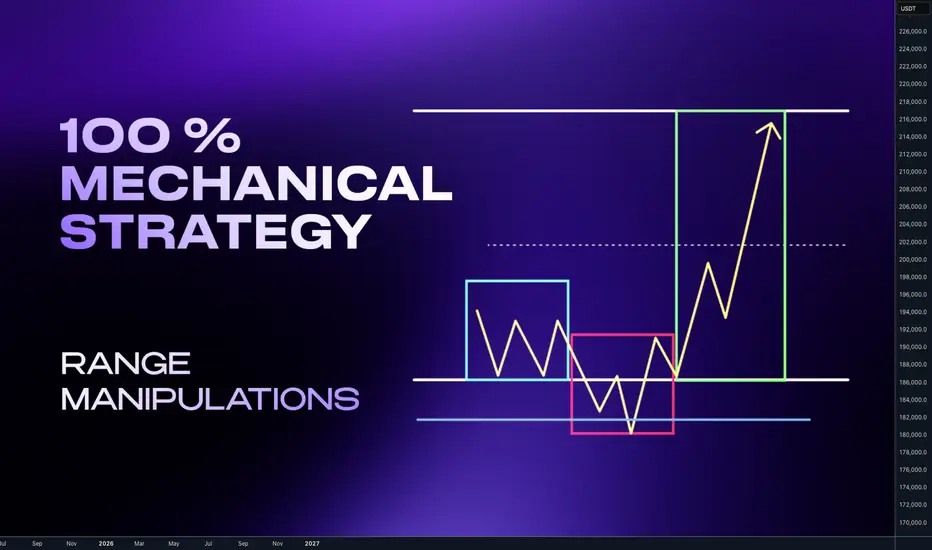
🧩 Basic Concept
Im looking for the fake break out of the range. Whether we call it manipulation or Stop hunt. It really doesn't matter. The idea is that once big candle is created it creates fomo and break out traders are entering continuation. I trade against them.
📍Bullish continuation setups
Model 1 - Entry after manipulation - 50% target
Model 2 - Entry on pullback on level between 61.8 - 80% pullback
📍Bearish Continuation setups
Model 1 - Entry after manipulation - 50% target
Model 2 - Entry on pullback on level between 61.8 - 80% pullback
🧩 Manipulation phase
is key for this concept. Without it happening, institutional move cant happen. Why ? Market makers are not looking to stop hunt our stop losses. They dont care about your or mine stop losses even if we trade 100 lots. Most of the brokers are B-Book anyway. But they are seeking the liquidity and they are placed above the highs and lows. You dont even need to read order book or book map to know it. To understand liqudity better read this post below
Now you understand after the liquidity was swept. Big players have guns loaded and the move can start. This is what we want to participate. But !! What I have just shown you are patterns. Without adding them in to the right context with the market they will not have highest winning ratio. You must be selective. Basically you want to:
📍Down Trend - Trade Stop hunts above the highs
📍Up Trend - Trade Stop Hunt below the lows
In other words we want be buying lows and selling highs. 🧪 How to do it I explained in this post below 📍 Top- Down analysis
Before we go to the refined entries we must understand top down analysis and what to look for on the charts. Never start with LTF. You always must go with top Down analysis.
🧩 TOP Down analysis
HTF Timeframe for the trend
ITF - Timeframe - Ranges and Key Levels
LTF - Timeframe Profiling and entries
Once we analyze the trend define our range on our timeframe we are looking for manipulation before we go to entries remember this:
🧪Range is mostly created close the key level. If any candle close above the range - Its makes it invalid.
🧪We want see and trade wicks above the range, there you are looking for LTF entry.
📍 Bearish Scenario - (ITF view ) Price should not have candle close above the range on the same timeframe otherwise setup is invalidated and new range created. 📍 Bearish Scenario - (LTF view) - price (yellow has structured movements and should be crating AMD profiles on the edge of the range. We need to drop to LTF to read the structure. 📍 Bullish Scenario ITF view - Price should not have candle close below the range on the same timeframe otherwise setup is invalidated and new range created. 📍 Bullish Scenario - (LTF view) - price (yellow) has structured movements and should be crating AMD profiles on the edge of the range. We need to drop to LTF to read the structure. ‼️Note that Im always referring to the key level. It's called key level , because it's key for the success of the setup. Without it it will work only sometimes. This element must be part of the setup. I personally like the Order Block in other word Supply / Demand zone.
🧪 I have explained Order block in the post below Before we go to trade setup let's clarify timeframes again. Price is fractal you can basically trade this on any timeframes, but you still need to keep structure of 3 Timeframes.
🧩 Timeframe Alignments
🧪Short Term Trading
Trend - Monthly - Directional draw on liquidity
RangeS - Weekly - Stop hunts
AMD Profiles / Entries - H4/H1
🧪Swing Trading
Trend - Weekly - Directional draw on liquidity
Range - Daily - Stop hunts
AMD Profiles / Entries - H1/M15
🧪Day trading
Trend - Daily - Directional draw on liquidity
Range - H4 - Stop Hunts
AMD Profiles / Entries - M15/ M5
🧪Scalping
Trend - H4 - Directional draw on liquidity
Range - H1 - Stop hunts
AMD Profiles / Entries - M5/M1
🔥I recommend to trade daily and weekly ranges. Im not saying Day trading and Scalping is impossible. But Im sure none of us started trading for being isolated nerd behind the PC whole day stressing yourself about every minute. You want live social live and enjoy the freedom which trading can give you and mainly Daily and weekly ranges are higher probability.
🧩 AMD- Accumulation Manipulation Distribution
This is happening on the markets over and over. Everyone who trades profitably use it and if not they are not continuous about using it but they use it is what is necessary to move the market. And we want see It on the Edge of the range with confluence of the key level.
USTBTC trade ideas
BITCOIN SIGNAL: NEXT TARGET REVEALED!! (scary) Yello Paradisers! Enjoy the video!
And Paradisers! Keep in mind to trade only with a proper professional trading strategy. Wait for confirmations. Play with tactics. This is the only way you can be long-term profitable.
Remember, don’t trade without confirmations. Wait for them before creating a trade. Be disciplined, patient, and emotionally controlled. Only trade the highest probability setups with the greatest risk to reward ratio. This will ensure that you become a long-term profitable professional trader.
Don't be a gambler. Don't try to get rich quick. Make sure that your trading is professionally based on proper strategies and trade tactics.

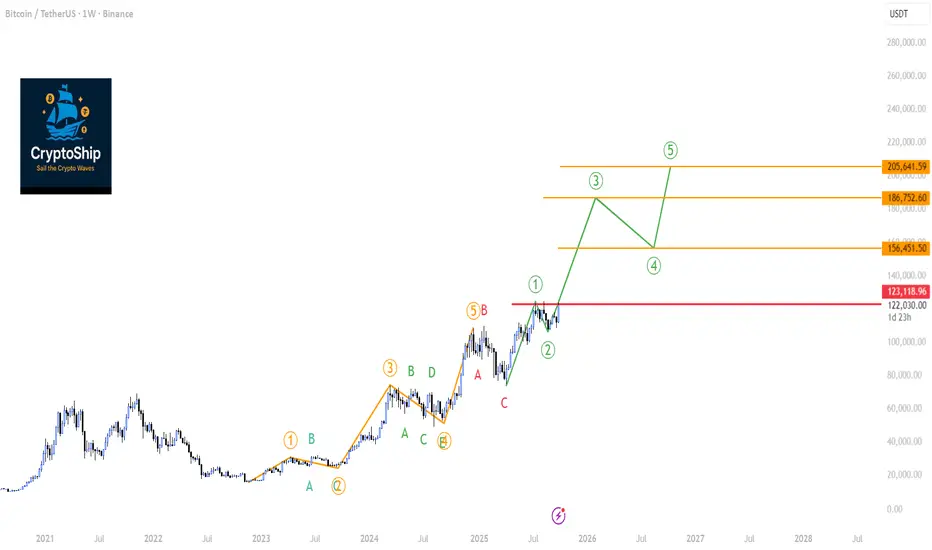
BTC vs. The Broader Market: A Dangerous Powerful Wave is Coming Today, we're taking a deep dive into the two most important charts in the crypto space: Bitcoin (BTC/USDT) and the Total Crypto Market Cap (TOTAL). Using an Elliott Wave framework on the weekly timeframe, we can see a clear bullish structure taking shape. However, some underlying weaknesses in key indicators warrant a cautious approach. Let's break it down.
1. Bitcoin (BTC/USDT): The Path to a new All-time high Hinges on a Key Level
As we can see on the weekly chart, Bitcoin appears to have completed a major five-wave impulse cycle which topped out around the $108,000 mark. This was followed by a necessary ABC corrective phase.
The exciting part is what comes next. We are potentially witnessing the beginning of a brand new five-wave impulse.
Wave (1): Appears to have started from the $74,000 low and peaked near $124,000.
Wave (2): A healthy correction followed, finding support around $107,000.
If this count is valid, we are now in the early stages of Wave (3), which is typically the most powerful and extended wave in an impulse sequence.
The Critical Condition:
For this bullish count to remain the primary scenario, the current weekly candle must NOT close below $123,000. A weekly close below this crucial level would risk invalidating the start of this new impulse, suggesting that we may still be within a more complex corrective structure (such as a regular flat correction Check the article).
Also during wave (3) the Weekly RSI must go beyond "80" showing strong momentum ( if it fails to do so then it's a caution signal to be strongly considered because a reversal could happen at any time!)
Indicator Analysis:
Bearish Divergences: We must note the lingering bearish divergences on both the RSI and MACD. These signals are suspicious and suggest that momentum is not fully confirming the recent price highs. They need to be monitored closely.
Volatility Coiling: The Bollinger Band Width Percentile (BBWP) is showing significant contraction. This coiling of the bands indicates that weekly volatility is decreasing, which often precedes a massive price expansion in the coming weeks or months, However the lack of BBWP exhaustion (spectrum crossing 90%) remains a bullish sign combined with the contraction
Trend Strength: The ADX is rising on the weekly chart, confirming that a strong trend is in progress.
Volume: On-Balance Volume (OBV) and general volume profiles appear adequate for now.
2. Total Crypto Market Cap (TOTAL): The Broader Market Picture
The Total Crypto Market Cap chart tells a very similar story, reinforcing our Bitcoin analysis. The bullish phase began in sync with BTC back in November 2022.
The current Elliott Wave structure for the entire market is as follows:
Wave (1): Completed in March 2024.
Wave (2): Corrected into May 2024.
Wave (3): Finshed on March 2024
Wave (5): Finshed on December 2024
Currently the Total market cap chart is closely alligned with BTC chart which confrims the BTC leadership is intact. The current Elliot count of TOTAL market cap indicated wave (1) started April 2025 but curretly wave 2 showing caution signals
A Significant Red Flag - The Volume Divergence:
While the price structure remains bullish, there's a concerning signal under the hood. On the weekly RSI, we see a double bottom pattern, which is typically bullish. However, looking at the On-Balance Volume (OBV) during the same period, the OBV printed a lower low.
This is a classic bearish divergence between price/momentum and volume. It indicates that the recent push higher is not being supported by genuine, strong volume, suggesting conviction is weak.
Alternative Scenario:
If this volume weakness persists, we might see Wave (2) extenstion to around $3.23 Trillion. This would lead to a deeper Wave (2) correction, From that support, Wave 3 could launch that would still likely reach our ultimate ATH.
Conclusion: Bullish Outlook with a Note of Caution
Bringing both analyses together, the macro view for the crypto market remains decisively bullish. The Elliott Wave structures on both BTC and the TOTAL chart point towards significantly higher valuation, the lack of BBWP exhaustion on weekly charts of BTC & Total market cap remains a strong bullish indication combined with the BBWP expansion.
However, the market is showing signs of fatigue. The bearish divergences on Bitcoin's indicators and the critical volume divergence on the TOTAL chart cannot be ignored. This suggests that while the overall destination is uptrend, the journey might include a corrective dip before the next explosive leg higher.
Key Takeaways:
Overall Bias: Bullish.
Key Level for BTC: Watch the weekly close relative to $123,000. This is our line in the sand for the current impulsive structure.
Key Concern: The lack of strong volume confirming the market's recent move up warrants caution.
Volatility: Brace for a significant expansion in price movement. The compressed BBWP on both charts suggests a major move is brewing.
Stay vigilant and manage your risk accordingly. The next few weekly closes will be critical in determining whether we blast off directly or take a detour first.
Bitcoin — worst-case scenario. Possibility...Profit-taking has begun around the $125,000 zone, as visible from the descending channel connecting the last three all-time highs. Should the market face another correction, a move toward $109,000 is plausible — not a guaranteed outcome, but a potential support level based on current structure. Traders preparing for worst-case scenarios may consider this as a reference point. With the upcoming FED meeting, the $109K region could serve as a liquidity zone capable of fueling a short-term rebound.
Reminder: This is not a prediction — just a worst-case scenario. Of course, if Trump keeps his mouth shut, a rebound toward 138,000 is also possible.

BTC Cycle Target 136–155K | Dominance, Alts, and Strategy Map🔹 Elliott Wave Outlook
According to my Elliott Wave projections, the current Bitcoin cycle is expected to end around 136K–137K.
Historically, past cycles showed an 8–10% deviation, which extends the possible top range to 136K–155K.
🔹 Q4 / Santa Rally View
For a short-term window (Q4 / Santa period), altcoins could outperform Bitcoin — but selectively.
There are over 35 million altcoins, and liquidity cannot support them all.
Focus on:
Strong market structure
Historical trend data
Consistent hold above the 200MA
Only a few alts will actually capture capital rotation.
🔹 Bitcoin Dominance Watch
BTC.D could rise toward 60–62% before a major shift.
Until that happens → no rush for broad alt exposure.
Patience will give better entries.
🔹 Strategy Zone
If Bitcoin holds its bullish structure, a pullback toward 95K–105K would be an excellent long-term buy zone.
If structure breaks, hold your current positions and hedge when you spot local weakness or reversal patterns.
⚠️ As always — this is not financial advice. Manage risk and stay adaptive.
#BITCOIN SUNDAY ANALYSIS $BTC the daily and monthly charts are#BITCOIN SUNDAY ANALYSIS
CRYPTOCAP:BTC the daily and monthly charts are now confirming that view. Bitcoin is trading around 123K, right at the upper resistance zone that has triggered every major correction since 2018.
🔸 Weekly Chart View:
BTC has once again touched the long-term trendline that has acted as a selling for every bull cycle top (2018, 2021, and now 2025). Each red arrow marks a rejection, and this latest test looks no different. Until we see a clean weekly close above this trendline, the risk of another major pullback remains high.
🔸 Daily Chart View:
On the lower timeframe, price is trading inside the green supply box between 110K and 125K, the same area that rejected BTC multiple times this year. Structure remains weak, holding below 125K still high chances of big correction.
And it’s not just the trendline or resistance we’re also seeing typical top signals: overly bullish headlines, extreme optimism, and calls for “1M BTC soon.” These usually show up near market tops, not bottoms.
📉 My Trade:
I’m still holding my shorts. All limit orders are filled and my average entry is around 122K. I’ll share updates if I make any changes or close the position.
📌 Downside Targets:
105K → 100K → 95K → 90K

BTC/USDT Short Set-up High-frequency test strategy
#1
BTC/USDT Short Set-up
— Retest of the all-time high, two reversal signals on higher timeframes, higher timeframe divergence still unplayed, declining volume
— Entry: $121,500 (market sell)
— Stop: $130,600 (7.5%)
— Target: $109000
Risk per trade: 0.5% of total balance
Position size: 7% of total balance, 10x leverage
RR 1:1.36
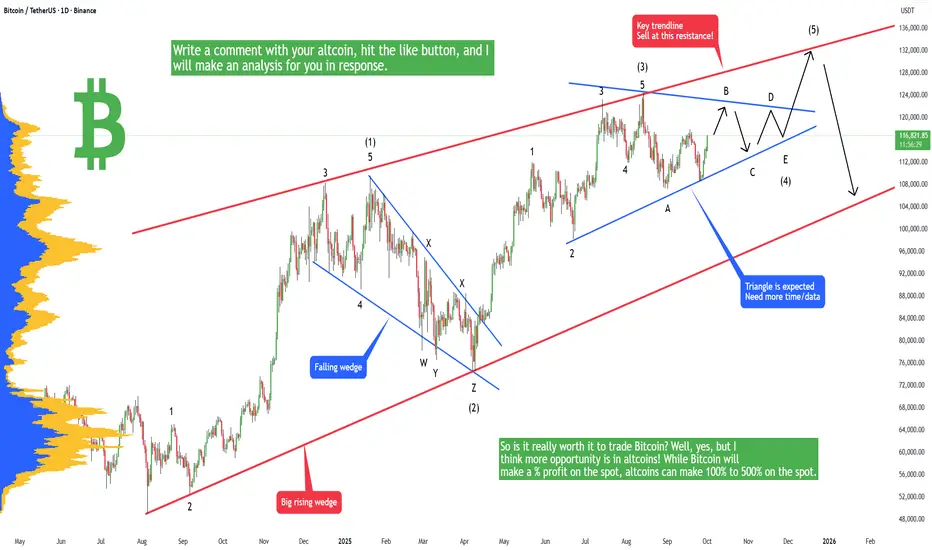
Bitcoin - LifeTime opportunity if you read this!Bitcoin is in the last stage of the current bull market (from 15k to 130k) and you definitely want to know where to sell otherwise you can experience a huge loss in 2026. You don't want to watch your portfolio dropping by 50% to 80%. You probably already know that the market is completely manipulated by banks and huge institutions, so you have to trade with big money. In the Elliott Wave theory there is a well-known fact that triangles usually occur in the last stage of the trend, so if you see a triangle, you should be aware of this fact and act accordingly. I think this is exactly what can happen on Bitcoin during the September-October-November-December time period.
So what is the plan? I think Bitcoin may go sideways in the next weeks, as you can see on the chart, to form a triangle, and then in December we may see a big breakout to the upside. 128k to 132k is something very real for the price at the end of this year. So is it really worth it to trade Bitcoin? Well, yes, but I think more opportunity is in altcoins! While Bitcoin will make a % profit on the spot, altcoins can make 100% to 500% on the spot. Choosing the right altcoins is not that easy, but I can tell you that DOGE looks promising, and we may see a new all-time high on this coin this year! Why is DOGE a good investment in the next weeks? First, because big players, they like this coin, and they want this coin to go up. There is really no second reason, because you want to trade with big money, not against it. No, there is another reason, and it's that you like dogs and you like this MEME.
But if you are not sure about your coin, please leave me a comment + hit the like button, and I will make an analysis in response to you! Trading is not hard if you have a good coach! This is not a trade setup, as there is no stop-loss or profit target. I share my trades privately. Thank you, and I wish you successful trades!
BTC 4HNow that people are feeling fear, I'm preparing my long positions. I can smell the scent of fear.💩💩💩💩💩💩

Bitcoin September 2025 Outlook: a/b/c price fractal structureBTC enters September post-ATH with a seasonal headwind. Base case: a ~10% A-leg dip toward $108k, a B-bounce into ~$122k, then a C-flush near ~$94k—echoing April’s ABC rhythm. Once complete, the uptrend should re-assert into year-end. 📉🔁📈 #Bitcoin #Seasonality #Crypto
🟠 Bitcoin September Outlook: Seasonality vs. Structure
After a fresh ATH, September’s historical bias skews mildly red. Base case is a ~10% A-leg dip that develops into an A/B/C correction before trend continuation. Think controlled pullback → consolidation → next markup. 📉➡️🔁➡️📈
________________________________________
🗓️ Seasonality Snapshot (2015–2024)
• Mean (10-yr): −2.55% · Median: −4.52%
• Red months: 6/10
• Worst September: 2019 (−13.88%)
• Best September: 2024 (+7.39%)
• Last 3 yrs avg: +2.8% (2024 +7.39%, 2023 +3.99%, 2022 −3.09%)
• Last 5 yrs avg (2020–2024): −1.3%
Read: September has tended to be weak, but the last two years printed green. Seasonality is a headwind—not a handbrake. 🌬️
________________________________________
🧩 Structure Thesis (Fractal Analog)
You’re looking for a repeat of April 2025’s A/B/C rhythm—scaled up:
• April 2025 reference: A ≈ $92k → B ≈ $106k → C ≈ $80k
• Now (projected):
o A ≈ $108k (≈ 10% pullback from recent highs) 📉
o B ≈ $122k (relief rally / lower high) 🔁
o C ≈ $94k (final flush into demand, completing the correction) 🧱
Interpretation: A measured September fade aligns with the A-leg. A reflexive B-bounce can follow as funding resets and late longs get cleaned up, with a C-leg completing the pattern before the next expansion. 🚀
________________________________________
📊 How Seasonality Supports the Call
• Typical drag: Median −4.5% and multiple red Septembers justify a down-bias.
• Volatility window: The historical 21-point spread (best +7.39% vs worst −13.88%) means a 10% dip sits well within normal bounds.
• Cycle context: With a new ATH just printed, a shallow corrective phase is constructive—not bearish regime change.
________________________________________
🧭 Levels & Triggers
• Bias line: Momentum cools into $108k → watch for seller absorption and open interest reset.
• Relief cap: $122k acts as B-rally resistance; sustained closes above $122k would invalidate the ABC idea and argue for immediate continuation. ✅
• Completion zone: $94k (C) is the buy-the-dip completion area; clean breaks below raise risk of a deeper time correction rather than a swift V-reversal. ⚠️
________________________________________
🧪 What to Monitor (Confirmation/Invalidation)
• Liquidity & OI: De-leveraging into A, controlled OI rebuild into B, washout into C.
• Spot-ETF flows / stablecoin issuance: Weakening into A, stabilizing by late month supports B→C rhythm.
• Funding/basis: Overheated → normalize during A; negative spikes near C often mark capitulation.
• Breadth (alts): Underperform into A/C; broad risk-on breadth usually returns post-C.
________________________________________
📝 Base Case Path (Textbook)
September: drift to $108k (A) → bounce toward $122k (B) → final tag of ~$94k (C) → reset + markup into Q4.
(If price reclaims and holds above $122k early, treat that as trend continuation—not a correction.)
________________________________________
🔒 Risk Notes
• Seasonality is a tendency, not a rule. Macro catalysts (CPI, policy, liquidity) can dominate calendar effects.
• This is market commentary, not financial advice. Manage risk and invalidation levels. 🛡️
Bitcoin Showed Breakout zone from top SideBitcoin’s price is currently testing a new all-time-high zone and encountering strong resistance around 123,000. A false breakout has formed at this level, and the market has entered a phase of local consolidation.
Price action is now moving aggressively toward testing the uptrend support zone. While a retest of 123,000 cannot be completely ruled out, technical signals from Friday’s sell-off — including profit-taking and a long upper shadow on the daily candlestick — suggest that a medium-term correction is likely.
I expect Bitcoin to retrace toward the local break-even / imbalance zone near 117,500 before attempting another move to the upside.
You may find more details in the chart.
Trade wisely best of Luck Buddies.
Ps; Support with like and comments for better analysis Thanks for Supporting.

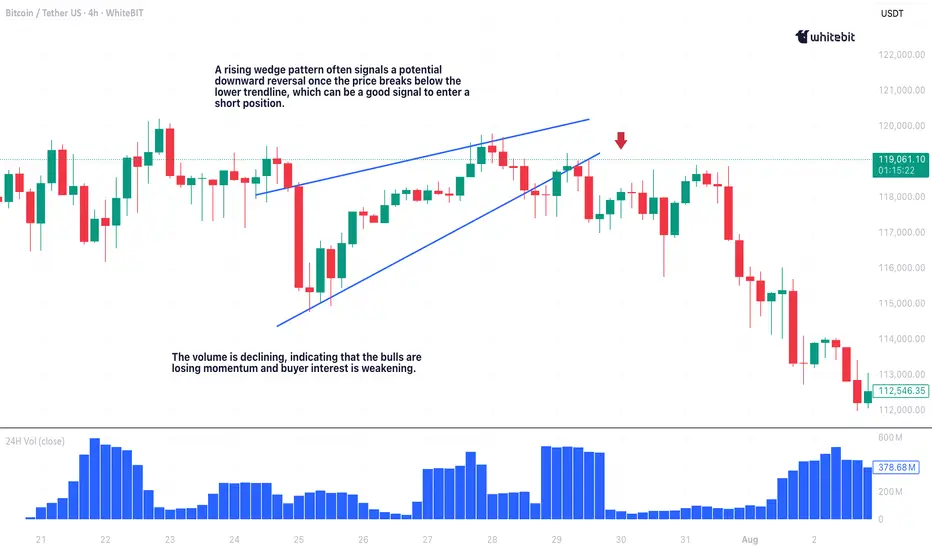
What’s a Wedge Pattern?What's up traders! 👋
Wedge patterns are a powerful tool in technical analysis that can give you a heads-up about potential price moves. Whether you’re spotting a falling wedge or a rising wedge, these formations can reveal key signals about market direction.
What’s a Wedge Pattern?
A wedge pattern forms when price moves between two converging trendlines, creating a shape resembling a triangle. These patterns usually appear when the market is slowing down or consolidating before making a bigger move. Wedges can slope upwards or downwards, and the key difference lies in whether the trendlines are converging in an uptrend (rising wedge) or a downtrend (falling wedge).
Falling Wedge Pattern: Bullish Reversal 📈
The falling wedge pattern is a bullish reversal signal. This formation occurs when price moves between two downward-sloping trendlines, creating a series of lower highs and lower lows. The downward momentum weakens as the trendlines converge, indicating that sellers are losing strength, which sets up the potential for a bullish breakout.
How to Trade the Falling Wedge
Entry: Wait for the price to break above the upper trendline. This is your signal to enter long.
Target: Measure the height of the wedge at its widest point and project it upwards from the breakout point.
Stop Loss: Place it just below the most recent swing low to protect your position if the breakout doesn’t happen.
The chart illustrates a falling wedge pattern on the Bitcoin / Tether US pair with a 1-hour timeframe. Price action is contained within two converging downward-sloping trendlines, suggesting weakening bearish momentum. The breakout above the upper trendline signals a bullish reversal, and the subsequent uptick in price confirms the shift in momentum.
In rare cases, a breakout failure can lead to a bearish falling wedge pattern, but this scenario is less common. Keep an eye on the price action for signs of continued upward momentum.
Rising Wedge Pattern: Bearish Reversal 📉
The rising wedge pattern is a bearish reversal signal. This formation happens when price moves between two upward-sloping trendlines, creating higher highs and higher lows. The rising wedge indicates weakening buying pressure and a potential reversal to the downside.
How to Trade the Rising Wedge
Entry: Enter a short position once the price breaks below the lower trendline.
Target: Measure the height of the wedge and project it downward from the breakout point.
Stop Loss: Set it just above the most recent swing high to protect your trade.
Wedge Chart Pattern Trading: Key Tips ⚡
Context is everything when trading wedge patterns. If a bullish wedge pattern appears in an uptrend, it’s more likely to break to the upside. If a bearish wedge shows up in a downtrend, expect a breakdown.
Here are a few quick tips to improve your wedge trading pattern game:
Trendlines are key: Ensure your trendlines are drawn accurately. Properly drawn trendlines lead to better trades.
Breakout confirmation: Confirm breakouts with increased volume and, ideally, by checking for confluence with other indicators like RSI or MACD. A breakout without volume is often a false signal.
Risk management: Always use a stop loss to protect your capital.
Use other indicators: Wedge patterns work well with additional tools such as RSI, moving averages, or MACD. The more confluence, the better!
Final Thoughts 🏁
Wedge patterns, whether it’s the falling wedge pattern signaling a bullish reversal or the rising wedge pattern trading indicating bearish pressure, are some of the most reliable chart formations out there. But remember: no setup is perfect, so always use a stop loss and never rely on a single indicator.
With practice, you’ll get better at spotting these setups and timing your entries and exits like a pro. Happy trading, and may the charts be in your favor! 💰📊
BTC ready for longsWe scrapped the last trade because the 1 hour did not close in our favor but I believe the HTF is now ready.

Descriptions about the market! Read the caption!Given Mr. Trump's remarks and the unprecedented crash in cryptocurrencies, I must say this individual significantly harms markets, especially investors. Imposing a 100% tariff on Chinese goods essentially means "we want no trade with you," which is fundamentally unfeasible. The United States and China will undoubtedly negotiate. However, our main focus here is the financial market collapse. This decline isn’t merely about falling prices—it goes beyond that. The core issue is the loss of market trust and credibility. Once confidence is broken, it is difficult to restore and may take a long time.
In any case, I felt it was my duty to bring this up and remind you to stay composed. Never forget to use stop-losses in your trades and practice proper capital management.
If needed, you can always message me on this platform for advice.
NOTE: This post is This post is educational.
BTC Prime Levels These are my Prime Levels, key price zones where BTC reacts the most.
How I Trade Them:
Close Above a Level : I buy - price showing strength.
Close Below a Level : I sell - price showing weakness.
Rejection at a Level : I trade the bounce - moving opposite of the rejection.
The idea is simple, let price decide.
I don’t predict i just react to how BTC behaves around these Prime Levels.
You can scalp on 5 min tf or day trade them on any tf, depending on your style.
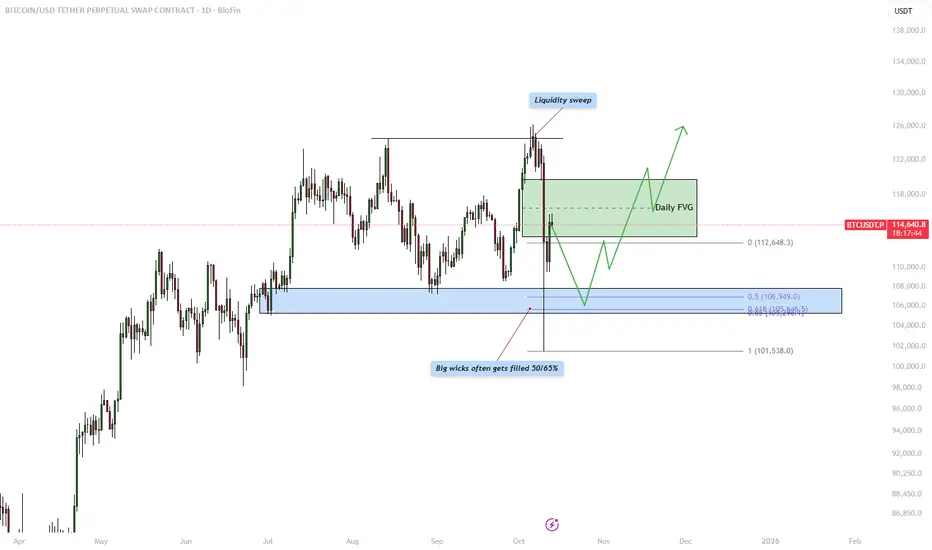
Bitcoin - What to expect from this week?Introduction
This analysis examines the recent price behavior of Bitcoin against USDT on the daily timeframe. The chart highlights several key technical concepts, including a liquidity sweep at the highs, a daily Fair Value Gap (FVG) acting as resistance, and the likelihood of a wick fill within a major imbalance zone. Together, these elements provide valuable insight into how institutional traders may be engineering liquidity and preparing for the next significant move. Understanding these areas can help traders anticipate high-probability reaction zones and better align with the market’s underlying structure.
Liquidity sweep
The market recently executed a liquidity sweep above previous swing highs, triggering buy stops and attracting breakout traders into the move. This sudden push to the upside was quickly rejected, signaling that smart money likely used this moment to gather liquidity and distribute positions. Liquidity sweeps often serve as the market’s way of collecting orders before a reversal or retracement, indicating that the bullish momentum may be temporarily exhausted. This event sets the stage for price to rebalance inefficiencies left behind during the rapid move.
Daily FVG resistance
Following the liquidity sweep, price left behind a clear daily Fair Value Gap, which represents an area of imbalance caused by strong displacement. This gap often acts as resistance, where price is expected to return and mitigate before potentially continuing lower. The FVG provides an ideal area for institutional traders to reposition, as it offers a point of confluence between inefficiency and structure. If price reacts bearishly within this zone, it would strengthen the bearish outlook and suggest a continuation toward lower levels.
Wick fill
The large wick seen during the recent sell-off is an important feature of this chart. Historically, big wicks tend to get filled by 50% to 65%, reflecting the market’s tendency to rebalance inefficiencies over time. The marked blue zone below shows where this fill is most likely to occur. This zone aligns closely with previous support levels and Fibonacci retracement levels, further reinforcing it as a potential area of interest. A wick fill into this region could provide liquidity for future bullish movement, allowing the market to establish a more solid foundation for the next impulsive leg upward.
Conclusion
In summary, the current daily structure of Bitcoin suggests that price has completed a liquidity sweep at the highs and is now in the process of rebalancing inefficiencies through a possible retracement. The daily Fair Value Gap above serves as a critical resistance zone where sellers may re-enter, while the wick fill area below marks a high-probability target for price to revisit before establishing new direction. Traders should monitor how price reacts to these two regions, a rejection from the FVG coupled with a move toward the wick fill zone could signal the next significant swing opportunity. In this environment, patience and precision are key, as the market seeks equilibrium before its next major directional move.
-------------------------
Thanks for your support. If you enjoyed this analysis, make sure to follow me so you don't miss the next one. And if you found it helpful, feel free to drop a like 👍 and leave a comment 💬, I’d love to hear your thoughts!
BTCUSD NEXT POSSIBLE MOVE Bitcoin is holding strong near a key support zone, showing signs of buyer accumulation. If the price continues to respect this area, a bullish move can be expected in the coming sessions.
Structure remains bullish above support, indicating that buyers may soon regain control.

BTC Next Leg Down?Price closed. below the important level of $123,742. I am expecting the newly created supply to send price down lower.

DeCode | Crypto Macro OutlookTopic: Macro Crypto Outlook
Context: BTC.D, DXY, Equities, CRYPTOCAP:BTC , News
Article:
Macro Crypto Outlook (Weekly Summary)
Assets: BINANCE:BTCUSDT.P TVC:DXY CRYPTOCAP:BTC.D BINANCE:ETHBTC
In this Weekly Macro Crypto Outlook , we break down the current state of the market and outline our forward-looking thesis for Bitcoin, Ethereum, and Altcoins.
Volatility is high.
Some believe the cycle has topped.
Others expect one final leg before the market turns.
At DeCode, we look past the noise and focus on data, structure, and context.
Let’s decode the charts together and map out what’s ahead for the rest of 2025.
Bitcoin Outlook
Bitcoin is now attempting a breakout on the weekly chart, reclaiming the previous structural Higher High. To confirm this move, we need at least two consecutive candle closes above $119,655. Despite multiple rejections from the recent highs, the market has absorbed that bearish pressure and pushed higher; a strong signal of underlying bullish strength.
If this breakout holds, the next targets lie at the +5 and +6 VWAP standard deviations, sitting around $137,000 and $151,500, which represents a potential +10% to +20% move from current levels. On the daily chart, we’re seeing six consecutive bullish closes, but short-term momentum is starting to fade, specially with a clear 3-Drive pattern that often lead the start of a pullback from Short Sellers.
Entering at all-time highs is rarely optimal, neither profitable so pullbacks are opportunities, not threats.
Key zones to watch on a retracement are:
$118,880
$112,600
$107,450
While a deep correction is unlikely given current momentum, the deeper the pullback, the better the Risk/Reward for those waiting with patience and a plan.
BItcoin Dominance & ETHBTC
Bitcoin Dominance (BTC.D) turned bearish a few weeks ago, but we’re now seeing early signs of a potential pullback. From a weekly perspective, the trend remains to the downside as long as BTC.D stays below 62.62%. However, the recent failed auctions on both the Weekly and Daily timeframes suggest we could see a short-term bounce in dominance.
A rising BTC.D means Bitcoin takes the spotlight and altcoins suffer disproportionately. Until we see clear weakness in BTC.D, it’s wise to keep altcoin exposure controlled.
The 60.85% – 59.57% zone is the key area to watch. If BTC.D starts showing rejection or weakness there, it could open a high-conviction window to rotate into undervalued alts.
ETHBTC remains the primary signal for altcoin strength and the true beginning of altseason. In our view, it hasn’t started yet. Recently, ETHBTC broke out of a multi-year bearish trend on the weekly chart; a significant structural shift.
On the daily chart, ETHBTC is gaining strength from a key Volume Level Zone, while BTC.D creeps higher. This divergence is critical:
If ETHBTC holds while BTC.D rises, we could be setting up for a massive ETHUSDT expansion, followed by strong moves in L1s and L2s.
ETHBTC must hold above 0.03749 to maintain this momentum. As Bitcoin cools off, ETH could lead the next phase of the cycle.
TradFi Correlation
In traditional markets, the U.S. Dollar Index (DXY) is often viewed as a risk-off indicator, when the dollar strengthens, risk assets like crypto, equities, and commodities tend to suffer.
At the moment, the DXY is showing signs of strength on the weekly chart, forming a solid base after multiple rejections from its previous structural lower low. If this structure holds, we could see a move toward 100.54, a key level that aligns with a potential short-term pullback across crypto markets. A break and sustained move above that level would shift the daily DXY structure to bullish, signaling increased demand for dollar safety. Historically, this tends to put downward pressure on risk assets, as investors rotate out of speculative positions.
This price action isn’t happening in a vacuum. Here’s what’s adding fuel to the fire:
📈 U.S. Treasury Yields are rising again as markets price in “higher for longer” rates. This strengthens the dollar and drains liquidity from risk assets.
📊 CPI and employment data are keeping the Fed cautious, which delays any meaningful pivot or rate cuts, even as parts of the economy show signs of slowing.
🧠 Global liquidity conditions are tightening, especially with ongoing geopolitical tensions and lower than expected growth in major economies like China and the EU.
🏦 Institutional capital is cautious; inflows into crypto ETFs have slowed, and hedge funds are increasing USD exposure as a hedge.

Long BTC📊 BTC Market Update
Weekly TF: BTC is closing with a bullish weekly candle, signaling strong momentum continuation.
4H TF: Price has broken above the range high and is now retesting it as support — a classic breakout-retest setup.
✅ Long Bias
Structure and momentum align with a long entry, with favorable R:R as outlined in the chart.
Breakout confirmation on the retest strengthens the case for continuation to higher targets.
⚠️ Key to Monitor
Hold above the reclaimed range high.
Volume confirmation on the retest for sustainability.
Macro events and BTC dominance shifts that could affect follow-through.
Disclaimer:
This analysis is based on my personnal views and is not a financial advice. Risk is under your control.

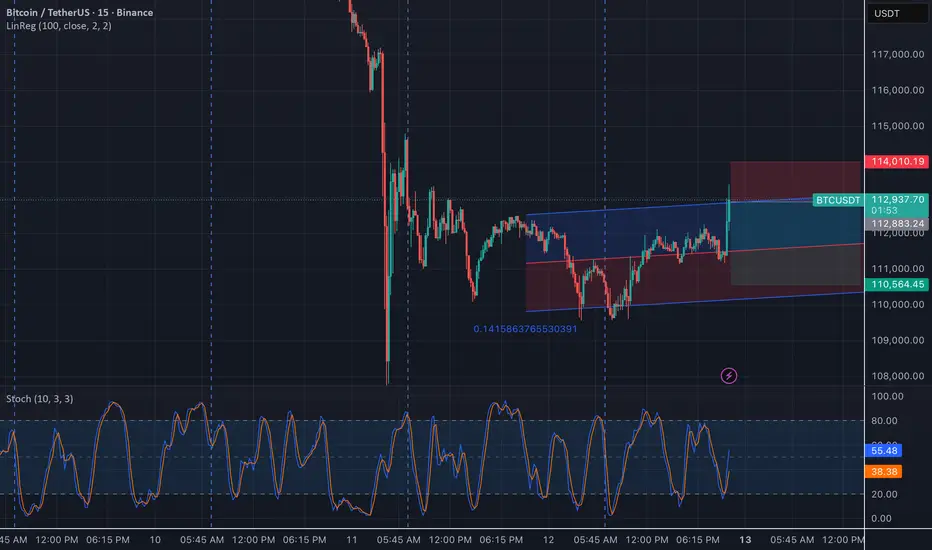
BTCUSDT — Bullish Rebound Within Regression Channel (15m AnalysiBitcoin is showing a potential bullish rebound inside the linear regression channel after a sharp drop.
Price is currently testing the midline resistance area around $112,800, supported by a strong bounce from the lower boundary near $110,500.
The Stochastic Oscillator has crossed upward from the oversold zone, signaling short-term bullish momentum.
If the price breaks above the upper channel, next resistance could be seen near $114,000.
Failure to hold above $111,800 may invalidate the bullish setup and retest the lower boundary.
🔹 Tools used: Linear Regression (100), Stochastic (10,3,3)
🔹 Timeframe: 15m
🔹 Exchange: Binance
#BTCUSDT #Bitcoin #TechnicalAnalysis #TradingView #CryptoAnalysis #Scalping #DayTrading
BTC to new ATH. Next reversal pullback at $132K-$135K$BTC. Congrats new ATH after ATH. Price heading to 132-135K zone.
I put resistance/reversal zone on the chart. Based on two different Fibonacci projections on different weekly swings.
Lets see how accurately it works. On backtesting it has been amazingly accurate. Especially when price going to discovery mode.
