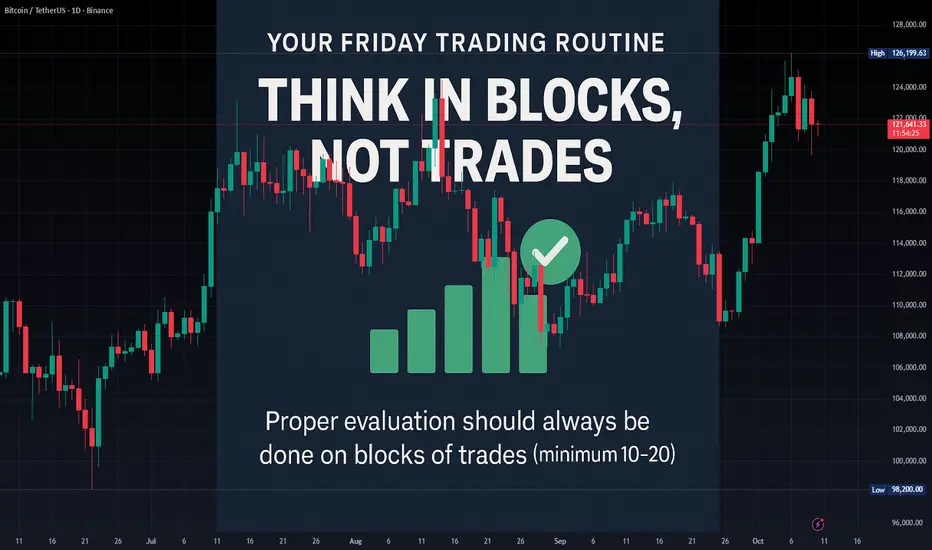
The Process Notebook #1 — The Successful Trader’s RoutineThe Successful Friday's Trader Routine: Evaluate but Think in Blocks, Not Trades
Another trading week is about to end. For most traders, Friday means checking wins and losses. For professional traders, it means evaluating the system.
💡 Remember: a single trade means nothing.
Proper evaluation, to avoid emotional bias caused by variance, should always be done on blocks of trades (minimum 10–20).
But here’s the real twist: If you’re judging your system only by Win Rate (WR) or Reward-to-Risk (RR)… you’re missing the real picture.
A robust trading system needs to be monitored through a small set of key metrics that reflect not just how much you earn, but how consistent and reliable your edge truly is.
Here’s the minimum you should be tracking 👇
📈 Return Metrics (How much your system makes)
Expectancy (average return per trade): quantifies the true profitability of your edge.
CAGR (Compound Annual Growth Rate): shows long-term compounding efficiency.
Payoff Ratio (avg win / avg loss): evaluates quality of your wins vs. losses.
📉 V olatility & Risk Metrics (How stable your system is)
Standard Deviation of Returns: measures the variability of your outcomes.
Max Drawdown: identifies the deepest pain your account can face.
Recovery Factor (Net Profit / Max DD): shows resilience and system efficiency.
⚙️ Consistency Metrics (How repeatable your process is)
Sharpe Ratio: return per unit of volatility — higher = more efficient risk use.
Win/Loss Streak Distribution: reveals your emotional endurance threshold.
Trade Frequency Stability: checks if your system behaves consistently over time.
🧠 Why this matters
When you evaluate your trading in blocks (using statistics, not emotions), you detach from the noise and connect with your system’s real performance.
You stop judging yourself trade by trade… and start thinking like a risk
manager.
How do you evaluate your system — by emotion or by metrics?
USTBTC trade ideas

BTC new ATH, decision making levelsToday BTC achieved ATH 125,819k.
From the day start bounce from the support zone.
Today BTC went up around 2.6 % .
At the top ATH we have LQ + Res + VAH, at this point we are in Supply zone, but BTC not reacting much.
BTC going uptrend channel, that indicates possible uptrend even higher because there is more liquidation in po levels + Stocks +- 1% .
USA economics dont show weakness and BTC traders are still hyped about new highs.

Bitcoin Fake Breakout and Potential Long SetupAfter the fake breakout at $120,836, Bitcoin is showing early signs of recovery. A risky long position can be considered if $121,692 breaks, with a stop loss just below $120,836.
If BTC falls back below $120,836, a short position can also be taken — but remember to take quick profits or move to breakeven, as this setup goes against the main bullish trend.
For the long setup, it’s reasonable to keep the position open and accept the stop-loss risk, since there’s strong upside potential if momentum confirms.
Also, if the RSI on the 1-hour chart breaks above 50, it would serve as a confirmation for the long trade.

BTC Will Flash Crash to 35,000 / 8,000 - This is the Theory I’ve been seeing a lot of comments on my posts about this, discreting the idea, or claiming there’s no reasoning behind it. Here I will dive deeper into the WHY by presenting this on the weekly time frame.
In recent times, we have witnessed many times on a small scale what happens after we see a slow, downwards consolidation and price movement.
On the way days as shorts are accumulated, they leave a trail above the price that contains buy orders that don’t automatically fill if price is below. These buy orders are short stop loss orders and short liquidation orders.
As Bitcoin moves down, the price will then slowly begin to rise. Sooner or later, there is a high volume candle on the minute time frame pushing price up - into the series of short position buy orders.
What follows is a very fast upwards candle as these buy orders are filled and the shorts are stopped out, liquidated, and traders enter longs.
Think of this as a replacement of positions. The market makers use the traders own decisions, to get themselves into the positions they want to be in. They cannot make those choices, but they can manipulate and entice traders to make the wrong decision.
Market makers who allow traders liquidity to take leveraged positions, they want their money back and to an extreme lesser degree, don’t want you taking profit in a winning trade. Hence, we see these very fast moves occur, which were once known as “stop hunts”.
These stop hunt candles, extreme, fast price movements that liquidate and stop out trades by nature, can be understood by chart analysis.
If you read disclaimers for the heat map platforms (IE Coinglass), you’ll see that these are only predictions, and not based on real data. The only accurate way of understanding where these hidden orders are, is by chart analysis.
On my chart are red boxes. These red boxes are drawn from the upwards consolidation zones, where price never came down to reclaim the liquidity from. These zones are filled with long position sell orders that don’t automatically fill when price is above.
You can imagine a ladder of sell orders, one after the next, all the way down through the boxes.
Now you may think, how can Bitcoin lose all that value if we drop to 8,000 when there’s ETF’s, Strategy, Holders, etc?
The answer is - the majority of Bitcoins market cap, including companies like Strategy who leverage, is all liquidity used for leveraging and trading derivatives.
It is liquidity supplied by market makers and exchanges, and has no bias towards price going up or down. It’s liquidity that’s fluid, moves in and out, and while you may think that bitcoin would “lose” all the value if it drops to 8,000 momentarily - you must think of it another way.
Bitcoin is a balloon of dollars. The dollars doesn’t affect the function of what Bitcoin does. People from all over use their money to inflate that balloon, and a liquidation event such as a stop loss, then deflates that balloon and transfers the wealth into very few pockets.
The balloon is then quickly re-inflated by the liquidity that’s first deflated, and becomes inflated again by the long orders placed and the shorts stopped out or liquidated.
It’s highly likely the “floor price” of bitcoin is $8,000 - the amount of bitcoin held in stable sources divided by the dispersed amount of bitcoin on the market.
The rest is leveraging liquidity, that is simply a function of inflating and deflating, moving in and out and accommodating orders of both directions - or in other words, the “ gambling industry” within Bitcoin.
Now, TECHNICALLY SPEAKING
We have 2 key trendlines to show.
The first is an ascending channel, that starts at the 8,000 zone. Price consolidated around it all throughout the chart.
Duplicating this trendline we can find a channel, and I show that as the lower red ascending line. This is the main support and resistance we have to understand.
The second trendline is shown in grey. This is again a bearish trend that Bitcoin has been consolidating around since its bottom.
This trendline breakdown takes Bitcoin to 35,000.
If price drops from current level to 35,000 - we can measure the downwards movement, place that measurement from 8,000 - and see that we would form a bear pennant type pattern, rise back up to the RETEST OF THE BOTTOM RED CHANNEL LINE, and then fulfill the measurement of the downwards move all the way to 8,000.
Technically speaking, we can use pattern prediction and support resistance levels to serve as confluence for the liquidity levels and the mechanics of this drop.
So there we have the MECHANICS and TECHNICALS
Additionally about the mechanics or the HOW… the more times Bitcoin doesn’t drop down, moves up - the more of those sell orders are accumulated.
The more TIME Bitcoin spends doing this, and the more AMOUNT of times Bitcoin wicks up like this - this means the FASTER and MORE POWERFUL the drop will be as a consequence.
This is very simply because of the amount of sell orders accumulated in the chart. The more sell orders there are, and the greater the quantity of Bitcoin ordered to be sold, the faster price will drop down.
So in theory, these drops will be the fastest movements we’ve ever seen in bitcoins history.
It’s quite literally a chart filled with rocket fuel and propellant, and all it takes is a fuse to be lit.
Thank you

Good moment for Buy BTCGood moment for Buy BTC. We have formed the up trend and now we are on the low level of this trend. It is good moment for try to buy BTC with good risk\reward ratio. The stop to the below local low. Will see...

BTC HTFOn the higher timeframes, I believe we still have reasons to remain bullish. Monday will be an important day since the markets haven’t yet had the chance to react to Friday’s events. We made a fakeout of the anchored VWAP from the last bottom, the wick bounced off the annual VWAP, and we also have an SFP in play.

Bitcoin getting rejected at all time highBTC is preparing for another BOS; however, it seems that big players want to suppress the price. Momentum remains bullish, and so does the trend, but more importantly, the sentiment is still bullish. A bearish response that fails to produce a lower low is an opportunity to accumulate.
BTC/USDTCRYPTOCAP:BTC has been moving within an ascending channel since April last year. Support has consistently held stronger than resistance has rejected, showing clear strength. I believe we are about to invalidate this bearish structure and break above channel resistance. Bitcoin looks ready to enter all-time-high mode.

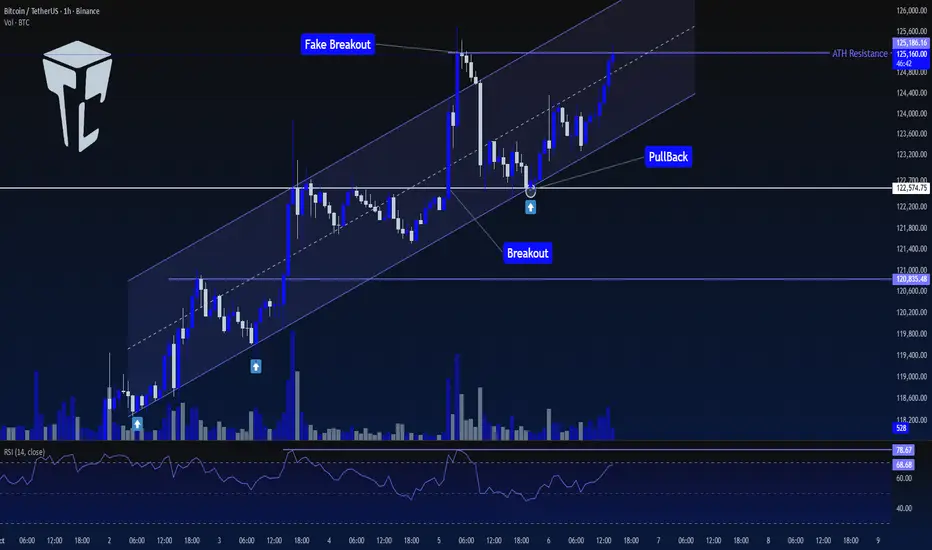
TradeCityPro | Bitcoin Daily Analysis #188👋 Welcome to TradeCity Pro!
Let’s move on to the Bitcoin analysis. Today, after pulling back to its previous resistance, Bitcoin is ready to start its next move.
⏳ 1-Hour Timeframe
On the 1-hour timeframe, Bitcoin continues its upward trend. Yesterday, after a pullback to the 122574 area and support from the channel’s bottom, it is once again ready to begin its next leg upward.
✨ The top formed at 125186 is Bitcoin’s new ATH resistance, and breaking this level would lead to further bullish continuation.
✅ Today, if this level breaks, we can have a long position on Bitcoin. If you already have an open position, there’s no need to re-enter at this point — it’s better to look for opportunities in other coins.
🎲 Since Bitcoin’s dominance trend is generally declining, if the next bullish leg begins, altcoins could also become attractive options. Therefore, it’s best to hold one position on Bitcoin and another on selected altcoins.
❌ Disclaimer ❌
Trading futures is highly risky and dangerous. If you're not an expert, these triggers may not be suitable for you. You should first learn risk and capital management. You can also use the educational content from this channel.
Finally, these triggers reflect my personal opinions on price action, and the market may move completely against this analysis. So, do your own research before opening any position.
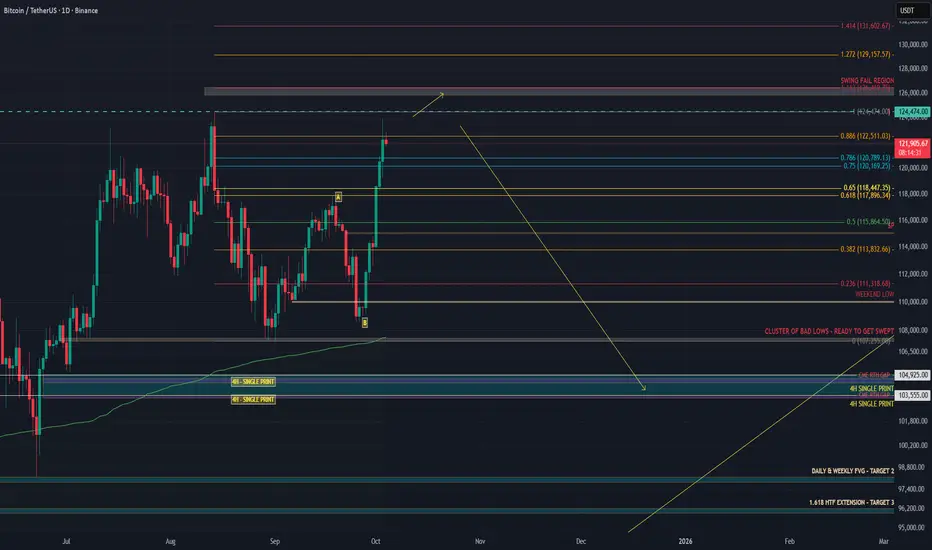
BITCOIN’S FINAL TRAP – THE SENTIMENT SWITCH IS COMING FASTIn my last BTC post I said a dump was likely based on data, and that thesis still stands. If anything, it’s even stronger now. .
On 13 August, CME made a high at 123,590.
That high was weak, no excess, flat TPO top, unfinished auction.
Binance topped at 124,474, Coinbase at 124,522.
CME opened with a gap down, leaving that poor high unrepaired with unfinished business and clean liquidity sitting above.
From 26 September, BTC started grinding up.
I expected a run of the 18 September high and a reversal around 118–119K, but price extended the move to the 1.618 extension. See my last analysis.
Structure was weak, spot CVD flat, futures CVD ripping, open interest climbing.
That shows perps were driving it, not real spot demand.
This week CME finally cleaned it up.
CME ripped through 125,025, taking out the August high at 123,590.
That level matched the old highs on Binance and Coinbase almost perfectly.
CME swept the old poor high left behind by spot and perps, completing the auction.
This is typical CME behavior, it hunts untested reference points during RTH and often reverses right after.
Flow data confirms the setup:
Spot CVD down means real buyers not following.
Stablecoin CVD pushing up means overleveraged longs chasing.
Coin-margined CVD rolling means profit taking or hedge flow.
Open interest flat at the top means trapped longs with no squeeze left.
The move looks like a leveraged markup driven by perps, cleaned up by CME liquidity, and now hanging on air.
CME repaired the August inefficiency, swept the prior spot high, and left another weak high with no excess, a textbook sign of distribution.
There’s still a chance we see one more SFP around 126K before momentum flips, but unless spot demand picks up aggressively, that should be the final liquidity grab.
My targets are 104K and 99K if 104K fails to hold, with potential for an even deeper drop beyond that level.
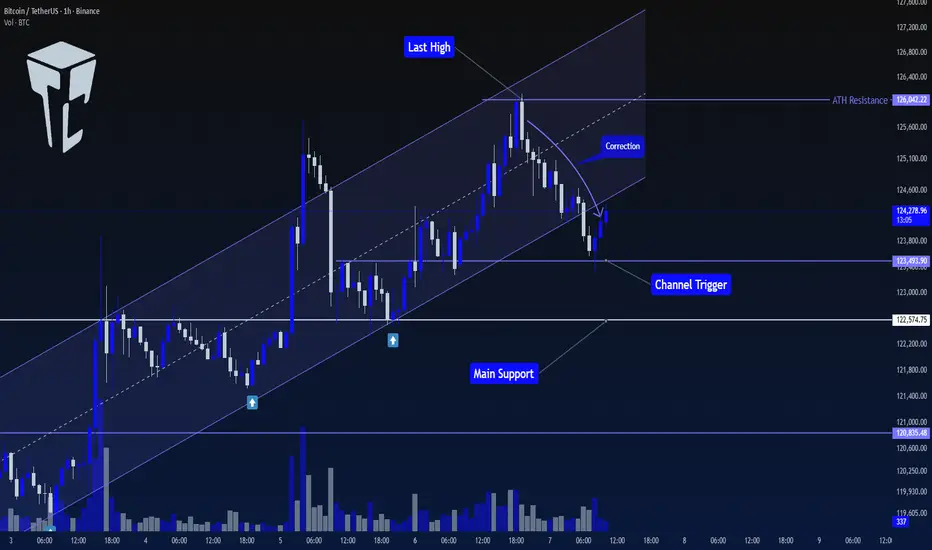
TradeCityPro | Bitcoin Daily Analysis #189👋 Welcome to TradeCity Pro!
Let’s move on to the Bitcoin analysis. Yesterday, after setting a new ATH, Bitcoin began its correction — let’s review the market together.
⏳ 1-Hour Timeframe
On the 1-hour timeframe, Bitcoin had been moving inside an ascending channel that had provided multiple supports. However, after being rejected from 126042, the price experienced a downward move and broke the channel to the downside.
⭐ The channel breakout trigger is at 123493, where the price has already reacted once, and it’s now moving slightly upward with very low volume.
📊 If this low-volume bullish movement continues, the likelihood of trigger activation will increase, and in that case, the price could move toward 122574.
🔍 For now, none of these triggers are suitable for short positions, as the market still looks too bullish to consider shorting.
✨ For long positions, the current trigger is 126042. However, if the market consolidates longer and forms a new structure, we might find an opportunity to enter earlier.
❌ Disclaimer ❌
Trading futures is highly risky and dangerous. If you're not an expert, these triggers may not be suitable for you. You should first learn risk and capital management. You can also use the educational content from this channel.
Finally, these triggers reflect my personal opinions on price action, and the market may move completely against this analysis. So, do your own research before opening any position.
Bitcoin Holds Range Midpoint as Bulls Aim to Reclaim $123KBitcoin continues to consolidate around the key $123,000 level after briefly losing it on the 4-hour chart. Despite short-term weakness, structure still supports the probability of a bullish continuation toward $133,000.
Bitcoin’s recent price action reflects a measured correction following an impulsive advance earlier this month. The market briefly lost the $123,000 handle, registering a bearish engulfing candle on the 4-hour timeframe.
However, price remains positioned around the range midpoint — a structurally significant level that continues to attract bids. This area, which aligns with the lower boundary of the local value area, has historically served as a reliable demand zone that precedes expansion phases.
The consolidation near the midpoint highlights an ongoing equilibrium phase rather than a full-fledged trend reversal. Volume profile analysis shows that liquidity remains concentrated between $121,000 and $123,000, suggesting strong two-way participation.
Should bulls manage to reclaim the $123,000 region with acceptance on higher timeframes, it would confirm renewed momentum toward the channel high near $133,000.
From a structural perspective, Bitcoin continues to maintain its series of higher lows, keeping the broader bullish trend intact. The current correction could form a base of accumulation before the next impulsive move. As long as price does not close below $120,000, the overall bias remains constructive.
What to Expect:
If $123,000 is reclaimed with volume confirmation, a bullish expansion toward $133,000 remains highly probable. Failure to hold $120,000, however, could invite deeper liquidity sweeps before continuation.

BTC Short Update - Target 1 Hit Hold steady at this point. Everyone is longing thinking bitcoin will do the same thing it always will
It won’t, it will go much lower. Next targets on their way.
Don’t be a victim to this. We could see it coming

TradeCityPro | Bitcoin Daily Analysis #187👋 Welcome to TradeCity Pro!
Let’s go over Bitcoin’s analysis — today, Bitcoin has recorded a new ATH. Let’s review the market conditions together.
📅 Daily Timeframe
In the daily timeframe, Bitcoin is moving inside an ascending channel with a steady upward slope.
⭐ After a corrective move from the top of the box, the price made a fake breakdown of the channel’s bottom and then, with the bullish momentum that followed, moved upward and managed to set a new ATH.
✔️ During the correction, the volume was decreasing, but after the price was supported at the key support zone and the fake breakdown occurred, buying volume entered the market.
✨ The main confirmation of the bullish continuation could be taken after breaking above 117056. Currently, the next confirmation trigger is a price stabilization above 123433.
💥 In my opinion, since RSI is getting rejected from the 70 level and the price has reached a strong resistance zone, there’s a high chance that the market will range below this resistance for a few days to test it.
🧩 At the moment, the main RSI resistance level seems to be 75.38 — if this level breaks, the main market momentum could start, leading to a sharp move upward.
📊 It’s completely normal for the trend to show weakness after reaching an ATH, because this level is Bitcoin’s largest supply zone. These wicks hitting the resistance zone don’t necessarily mean trend weakness — it’s typical for the price to form such candles when testing its all-time high.
🔑 What really matters is how the price reacts in the next few attempts at this zone, which will tell us whether we have an actual trend weakness or not.
💫 Right now, the most important support Bitcoin has built is around 107000. If a bearish move begins, the first confirmation of a downtrend will be breaking this area. However, the main confirmation of a full bearish reversal would be the break of 100961.
🎲 Overall, since the price is currently at the top of the market, finding precise triggers on Bitcoin is difficult. But considering Bitcoin dominance has the potential to drop, altcoins could provide excellent trading setups in the coming days if that dominance decline begins.
❌ Disclaimer ❌
Trading futures is highly risky and dangerous. If you're not an expert, these triggers may not be suitable for you. You should first learn risk and capital management. You can also use the educational content from this channel.
Finally, these triggers reflect my personal opinions on price action, and the market may move completely against this analysis. So, do your own research before opening any position.

TradeCityPro | Bitcoin Daily Analysis #190👋 Welcome to TradeCity Pro!
Let’s dive into today’s Bitcoin analysis. The market, after experiencing a decline, is now ready to resume its primary bullish trend.
⏳ 1-Hour Timeframe
Yesterday, after Bitcoin confirmed a break below the channel, it retested the channel and activated the trigger at 123493, leading to a brief bearish movement.
📊 The first support zone was 122574, but the price didn't react to it, resulting in a break below. The next key support zone was 120835, where the price reacted and formed a low.
✨ After the price found support at 120835, a peak formed at 122084, creating a compression between 120835 and 122084.
📈 Currently, after breaking above the compression range, a bullish movement has started, and the price has reached back above 123491.
⚡️ The good thing about the correction to 120835 is that many long positions that hadn’t taken profit were now closed, reducing selling pressure in the market. This provides Bitcoin a chance to continue its bullish trend with a more structured approach.
🚀 However, if the price fails to break the previous high of 126042, a lower high would form, which is a sign of weakness in the bullish trend.
🎲 If that happens, and if the price stabilizes below 120835, we’ll get confirmation of a bearish shift in this timeframe. But for now, this hasn’t happened, and the market momentum remains bullish.
🔍 For a new position, if you haven’t opened a position after breaking 122084, there is no valid trigger at the moment, and we should wait for the market to create a proper structure for entry. Otherwise, the only trigger we have right now is breaking 126042.
🔽 For a short position, I am waiting for the trend change scenario to unfold before considering any short triggers.
❌ Disclaimer ❌
Trading futures is highly risky and dangerous. If you're not an expert, these triggers may not be suitable for you. You should first learn risk and capital management. You can also use the educational content from this channel.
Finally, these triggers reflect my personal opinions on price action, and the market may move completely against this analysis. So, do your own research before opening any position.

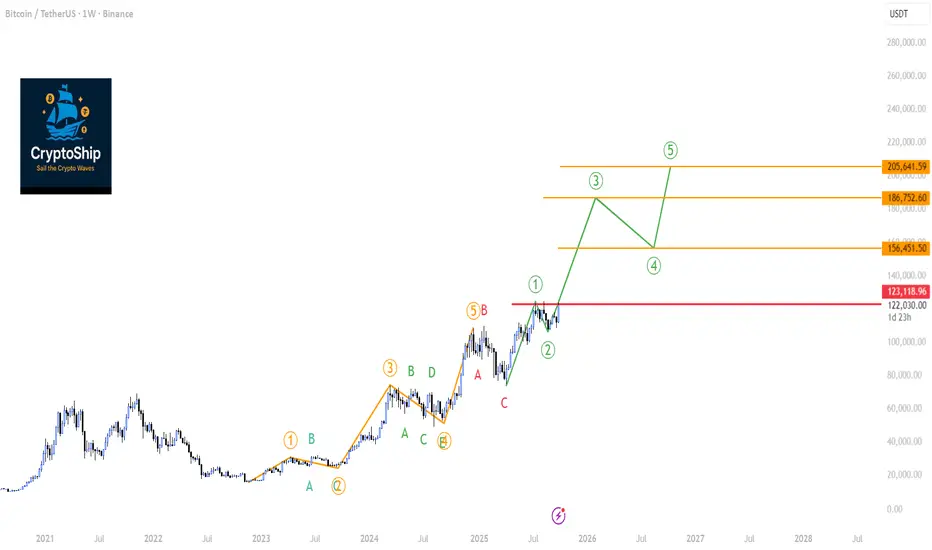
BTC vs. The Broader Market: A Dangerous Powerful Wave is Coming Today, we're taking a deep dive into the two most important charts in the crypto space: Bitcoin (BTC/USDT) and the Total Crypto Market Cap (TOTAL). Using an Elliott Wave framework on the weekly timeframe, we can see a clear bullish structure taking shape. However, some underlying weaknesses in key indicators warrant a cautious approach. Let's break it down.
1. Bitcoin (BTC/USDT): The Path to a new All-time high Hinges on a Key Level
As we can see on the weekly chart, Bitcoin appears to have completed a major five-wave impulse cycle which topped out around the $108,000 mark. This was followed by a necessary ABC corrective phase.
The exciting part is what comes next. We are potentially witnessing the beginning of a brand new five-wave impulse.
Wave (1): Appears to have started from the $74,000 low and peaked near $124,000.
Wave (2): A healthy correction followed, finding support around $107,000.
If this count is valid, we are now in the early stages of Wave (3), which is typically the most powerful and extended wave in an impulse sequence.
The Critical Condition:
For this bullish count to remain the primary scenario, the current weekly candle must NOT close below $123,000. A weekly close below this crucial level would risk invalidating the start of this new impulse, suggesting that we may still be within a more complex corrective structure (such as a regular flat correction Check the article).
Also during wave (3) the Weekly RSI must go beyond "80" showing strong momentum ( if it fails to do so then it's a caution signal to be strongly considered because a reversal could happen at any time!)
Indicator Analysis:
Bearish Divergences: We must note the lingering bearish divergences on both the RSI and MACD. These signals are suspicious and suggest that momentum is not fully confirming the recent price highs. They need to be monitored closely.
Volatility Coiling: The Bollinger Band Width Percentile (BBWP) is showing significant contraction. This coiling of the bands indicates that weekly volatility is decreasing, which often precedes a massive price expansion in the coming weeks or months, However the lack of BBWP exhaustion (spectrum crossing 90%) remains a bullish sign combined with the contraction
Trend Strength: The ADX is rising on the weekly chart, confirming that a strong trend is in progress.
Volume: On-Balance Volume (OBV) and general volume profiles appear adequate for now.
2. Total Crypto Market Cap (TOTAL): The Broader Market Picture
The Total Crypto Market Cap chart tells a very similar story, reinforcing our Bitcoin analysis. The bullish phase began in sync with BTC back in November 2022.
The current Elliott Wave structure for the entire market is as follows:
Wave (1): Completed in March 2024.
Wave (2): Corrected into May 2024.
Wave (3): Finshed on March 2024
Wave (5): Finshed on December 2024
Currently the Total market cap chart is closely alligned with BTC chart which confrims the BTC leadership is intact. The current Elliot count of TOTAL market cap indicated wave (1) started April 2025 but curretly wave 2 showing caution signals
A Significant Red Flag - The Volume Divergence:
While the price structure remains bullish, there's a concerning signal under the hood. On the weekly RSI, we see a double bottom pattern, which is typically bullish. However, looking at the On-Balance Volume (OBV) during the same period, the OBV printed a lower low.
This is a classic bearish divergence between price/momentum and volume. It indicates that the recent push higher is not being supported by genuine, strong volume, suggesting conviction is weak.
Alternative Scenario:
If this volume weakness persists, we might see Wave (2) extenstion to around $3.23 Trillion. This would lead to a deeper Wave (2) correction, From that support, Wave 3 could launch that would still likely reach our ultimate ATH.
Conclusion: Bullish Outlook with a Note of Caution
Bringing both analyses together, the macro view for the crypto market remains decisively bullish. The Elliott Wave structures on both BTC and the TOTAL chart point towards significantly higher valuation, the lack of BBWP exhaustion on weekly charts of BTC & Total market cap remains a strong bullish indication combined with the BBWP expansion.
However, the market is showing signs of fatigue. The bearish divergences on Bitcoin's indicators and the critical volume divergence on the TOTAL chart cannot be ignored. This suggests that while the overall destination is uptrend, the journey might include a corrective dip before the next explosive leg higher.
Key Takeaways:
Overall Bias: Bullish.
Key Level for BTC: Watch the weekly close relative to $123,000. This is our line in the sand for the current impulsive structure.
Key Concern: The lack of strong volume confirming the market's recent move up warrants caution.
Volatility: Brace for a significant expansion in price movement. The compressed BBWP on both charts suggests a major move is brewing.
Stay vigilant and manage your risk accordingly. The next few weekly closes will be critical in determining whether we blast off directly or take a detour first.
BTCNEW UPDATE (1D)In the previous analysis, we considered Bitcoin’s scenario as a triangle, which has now failed.
It now appears that this is not a triangle but a diametric pattern. Currently, it seems we are in the middle of wave F. The potential corrections we expect are buying opportunities, and we will look to buy within the green box if a correction occurs.
The target for wave E could be between 138K and 140K.
A daily candle closing below the invalidation level will nullify this analysis.
invalidation level : $106418
For risk management, please don't forget stop loss and capital management
Comment if you have any questions
Thank You

Now 127,000… BUT?!First of all check may 3 days ago published analysis
Now its time to go to 127,000!
But before they will hit again. Then 127K

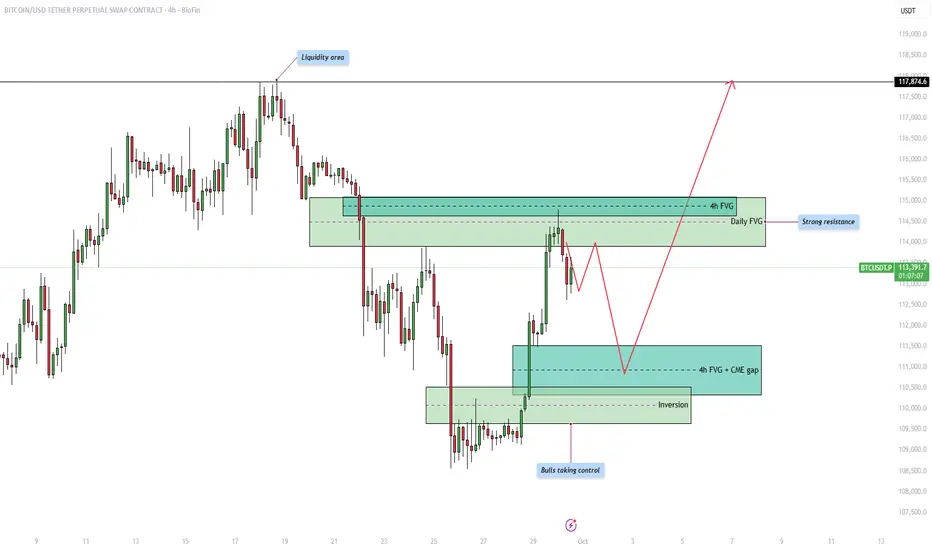
Bitcoin - Shortterm correction in the bullish trend!Introduction
The Bitcoin price action is currently moving within a structured range where both liquidity and fair value gaps (FVGs) are playing an important role in shaping potential market direction. By analyzing the chart, we can identify key areas of liquidity, resistance, and support that traders are likely to pay close attention to in the coming days. Understanding how price reacts around these zones will help anticipate whether bulls can maintain control or if bears will attempt to reclaim lost ground.
Upside liquidity
At the top of the range, we can see a clear liquidity area where price previously reversed. This liquidity pool represents buy-side liquidity, and the market could be drawn towards it as price seeks to sweep the highs. Liquidity is often targeted by the market before making a significant move in the opposite direction, which makes this area important to watch closely.
Resistance from the 4h and daily FVG
Before price can reach higher liquidity levels, it must contend with a strong resistance zone that overlaps with both the 4-hour and the daily fair value gap. This confluence strengthens the resistance, making it more likely that price will struggle to break through immediately. Traders will be watching for signs of rejection within this area, which could cause short-term pullbacks before any potential breakout.
4h FVG and CME gap support
On the downside, the 4-hour fair value gap aligns with the CME gap, providing a strong support level. This zone acts as an attractive area for price to retrace into before continuing higher. It is common for the market to return to such imbalances to fill inefficiencies, so a temporary dip into this support could serve as a healthy retracement before bulls attempt to push price further upward.
Bullish inversion
Another critical development is the inversion zone, where previous resistance has now flipped into support. This shift highlights that bulls are taking control of the market structure, strengthening the overall bullish outlook. As long as this inversion level holds, buyers are likely to defend it aggressively, reducing the probability of a deeper breakdown.
Final thoughts
Overall, the market remains in a bullish posture with upside liquidity acting as a magnet, but significant resistance awaits at the overlapping 4h and daily FVG. Short-term pullbacks into the 4h FVG and CME gap support are likely before the next major move upward. If the bullish inversion continues to hold, we could see a strong push towards the higher liquidity zones, potentially targeting levels beyond 117,000. The coming days will be crucial in determining whether bulls can maintain this control or if resistance proves too strong.
-------------------------
Thanks for your support. If you enjoyed this analysis, make sure to follow me so you don't miss the next one. And if you found it helpful, feel free to drop a like 👍 and leave a comment 💬, I’d love to hear your thoughts!
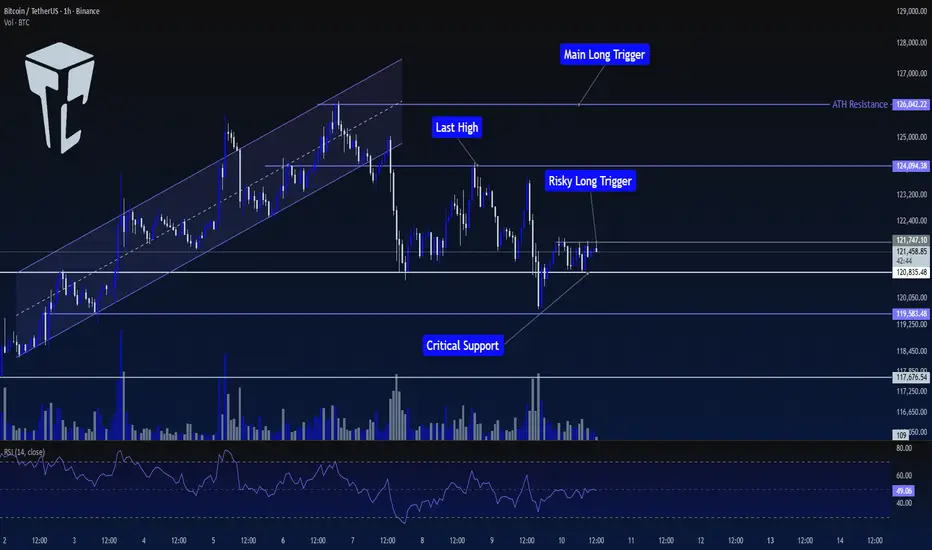
TradeCityPro | Bitcoin Daily Analysis #192👋 Welcome to TradeCity Pro!
Let's dive into Bitcoin analysis. Today, Bitcoin is still in a consolidation and range-bound phase. Let’s take a look at the current market conditions.
⏳ 1-Hour Timeframe
In yesterday’s analysis, Bitcoin was in the process of breaking the $120,835 level. I mentioned that I wasn't opening any short positions yet, but a rejection of this downward movement could be a good sign for a potential upward move.
⭐ This scenario played out, and the price has now moved back above $120,835, which gives us an opportunity to look for long triggers.
✔️ One trigger that has formed is $121,747, which can be used as a risky trigger for a long position.
📊 Market volume has decreased slightly, so it’s better to wait for an increase in volume when this level is broken, as that would raise the likelihood of an upward move.
📈 The next reliable long triggers we have are $124,094 and $126,042. These triggers are more reliable for a position, but they are currently farther from the price, so the chance of them activating today is lower.
💥 For short positions, I'm still not focusing on them and prefer to focus on long positions. Therefore, I currently don’t have any short triggers to provide.
❌ Disclaimer ❌
Trading futures is highly risky and dangerous. If you're not an expert, these triggers may not be suitable for you. You should first learn risk and capital management. You can also use the educational content from this channel.
Finally, these triggers reflect my personal opinions on price action, and the market may move completely against this analysis. So, do your own research before opening any position.
BTCUSDTThe price has formed an "S" pattern and has once again declined to around $117,000. Therefore, the horizontal support level of $117,000, which the price has touched multiple times, is considered a significant level. The overall trend appears to be upward, with the price respecting an ascending channel (diagonal lines). The recent drop from the peak suggests a potential correction or profit-taking, with the price currently testing the support level. This indicates a volatile period that may lead to consolidation or a further decline if the support breaks, or a recovery if it holds.

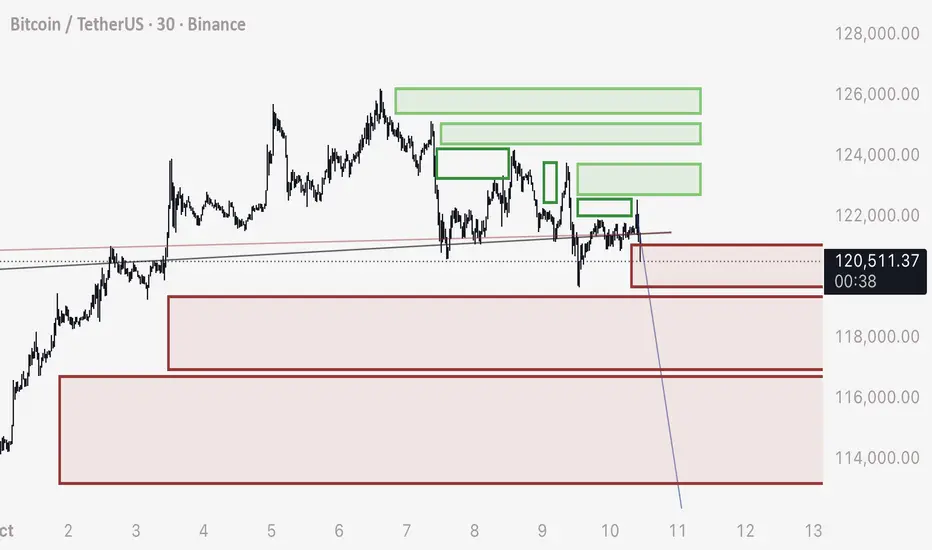
BTC - Use Order Blocks to Predict if Price with move UP OR DOWNI will give a practical demonstration here on how to draw your own order blocks and heat maps to predict if price will move up or down from this 121,400 current level.
First understand that stop loss order blocks are opposite to what we have learned as traders.
We are told that buy orders are below price (limit buys) and sell orders are above us (limit sells).
The truth of Bitcoin however is the exact opposite is true. The stop loss orders carry much more power than limit orders, as they are filled for the “whole leveraged position size”, not for only the margin used.
While limit buys will automatically fill if price is below that price, or limit sells will automatically fill if price is above that price - this is not true for stop loss orders or liquidation orders.
Stop Losses and Liquidations only FILL if price CROSSES the level.
This means we can use order blocks from open candle sets, extended out past price currently, to understand where these gaps of orders are located.
Green boxes for BUYS above price.
Red boxes for SELLS below price.
When price enters into these boxes zones, these orders will start filling - acting as a type of propellant that’s implanted in the chart from traders previous choices. This creates “wicks” and fast movements.
WILL PRICE GO UP OR DOWN FROM 21,400?
In this example from 121,400 I drew both long stops and sell stops.
The emptied green boxes have already been reclaimed. The filled in green boxes are left unreclaimed and contain these orders.
For price to go up, it would have to move past the previous wick, and enter into these zones - which have a significant gap in between them.
For price to DROP, we can look at the boxes of long stops or sell orders.
Note that these order blocks are neatly placed one after the next, with no significant gaps between them.
Therefor, there is much better odds of price dropping from 121,400 - entering into these sell order blocks, and naturally dropping as those orders are filled one into the other.
It would be a good day trade strategy to SHORT the 121,400 level, and expect the price to move down through these blocks.
It would be a bad day trade strategy to LONG the 121,400, as the orders are very few compared to the downside, therefor, lower odds.
This is really the only strategy you need to scalp trades on Bitcoin and predict where price is going.
If you find these helpful, please let me know below.
Yours truly,
- DD