BTC/USDTI think wave A of C is complete, so I will enter a buy position with this setup for wave B of C.
USTBTC trade ideas

BTC: $115K Support Zone Under PressureBitcoin is currently testing the $115K support zone, and it's showing signs of breaking through. If this level doesn't hold, we could see a drop toward the next support around $110K-$112K. On the flip side, if CRYPTOCAP:BTC bounces back, it might target the $120K resistance zone.
Set a market alert for a break below $115K to track any major moves.
DYOR, NFA

Long BTCyep as the chart suggests, Its a good opp but there is a chance that the price also falls to the orange box below.
So confirm on lower TF. Hopefully it goes through.
If the price loses 110000 to 11000 support. Then thats really really bad.

BTC is forming Flag Pattern as well as slanted HnSBTC is forming a Flag Pattern as well as a slanted HnS.
I am expecting it to fall up to 104-100K.

BTCUSD CAN FLY HIGHAccording to H1 analysis BTCUSD market is in selling pressure from last few hours it will be back from SUPPORT LEVEL if you are interested then go buy from support zone is best for you dont be greedy use money management
TRADE AT YOUR ON RISK
REGARD ALBERT

BTC in its bullish channelBTC is in its ascending channel, the most likely scenario being a retest of the channel's baseline, which coincides with a strong support zone: 112,000. Its bullish momentum will resume if the support zone fulfills its function. If it breaks the channel and the support zone, it's best to wait and see. Stay tuned.

Bitcoin Has Potential to Continue – Don’t Miss Out!Hello everyone, Ken here!
Let’s dive deeper into the current price action of Bitcoin.
As you can see, price is moving within a clear upward channel, signaling strong bullish momentum. After a sharp rise, the price has slightly pulled back to retest the broken resistance. This is a classic break and retest setup within a larger channel, a popular trading pattern I often use.
The key point here is that if this level holds as support, buyer confidence will be further solidified. And we’re already seeing that happen!
With this momentum, I believe 118,850 USDT is the next target, where the price could reverse depending on market reactions at that point.
Wishing you successful trades and a disciplined strategy!

BTC Trade Idea: Short from 117,850 at previous resistance level
Bitcoin is currently at a previous resistance level 117,500 where the price has bounced down before.
Personally, I will enter a short trade from the current price with a tight stop-loss.
✅ My Personal Strategy:
Entry: Sell from current price 117,850
🎯 Target 1: 116,000
🎯 Target 2: 115,500
Stop Lose : Daily close above the resistance level 117,500
Please note:
This is not financial advice – I’m only sharing my personal trades.
Always do your own research before taking action.
👍 Don’t forget to like if you found this useful, and feel free to follow me for more analysis of this kind.
Best of luck 🌹

Bitcoin and the WeekendCRYPTOCAP:BTC
There have been positive inflows into exchanges over the past four hours. Bitcoin has broken its trend. All signals are pointing to a decline for now. We'll be monitoring and reporting on this.

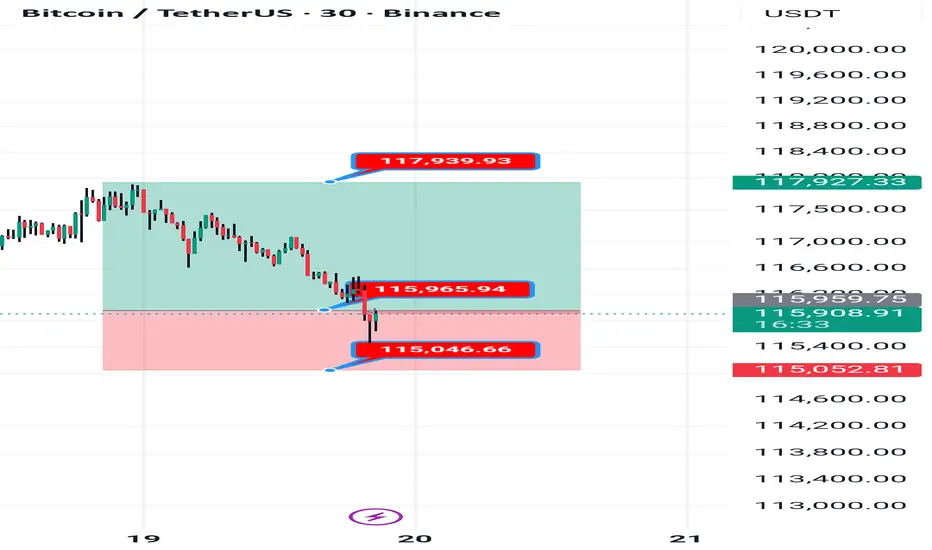
BTC/USDT Long Position – Clean R/R SetupThis chart represents a planned buy entry on BTC/USDT based on market structure and recent price action.
Entry Zone (Buy): 115,937.92
Take Profit (TP): 117,920.25
Stop Loss (SL): 115,023.24
The setup is built on a clear retracement entry, providing a favorable risk-to-reward ratio. Market recently showed a pullback after a drop, and this zone aligns with potential liquidity grab, making it a strong entry point for buyers.
📌 Plan:
Enter long around 115,937.92
Risk is strictly limited with SL below recent liquidity sweep at 115,023.24
Upside target is set at 117,920.25 for a clean R:R opportunity
This is a technical setup only, not financial advice. Always manage your own risk
BTCUSDT.P — quick analysis (1D & 4H)BTCUSDT.P is consolidating in a sideways-to-upward structure, testing a strong resistance zone. Momentum is steady but capped, and the market is building pressure for its next move. A breakout above resistance would confirm continuation of the uptrend, while a breakdown below support would shift the bias to bearish. Until either side gives way, the pair remains range-bound and best approached with patience.

BTC crossing DEATH CROSS (SMA200)You can't say I didn't tell you so. BTC and Nasdaq are highly correlated and the market is just wayyy too hot. All the FOMO in the world won't help now. Overnight we saw a big dip in the Japanese market and the cracks are starting to show. Next will the long term yields spiking as risk goes up and investors want to be compensated for long term risk. Strategy is using VIX, MSTZ, BTCZ as relatively cheap "insurance." The volatility is great, but many don't know how to enter and exit.
The technicals here show weakness at the top, and going from a historical / fundamental perspective we are bound for a nice / deep pullback. When short term rates are cut, and the market bumps up long term rates it is big FU and we all know what happens next. Could be wrong, but worse case you bought into cheap insurance with a massive high reward / risk ratio!
Best of luck out there....!

BTC Bearish ScenarioPattern Recognition:
A Head and Shoulders (H&S) reversal structure formed on the daily chart. The 1:1 measured move target has already been achieved, confirming the pattern’s validity.
Confluence Zone:
That 1:1 target aligns closely with the 0.618 retracement of the previous down leg (124,610 → 107,211). This adds weight to the idea that the move is corrective in nature rather than a fresh bullish leg.
Market Structure:
Even though price rallied strongly, the bigger picture shows a lower low was created when the 112,017 support level was broken. This keeps the macro trend bearish until proven otherwise.
Bearish Scenario:
Price is currently respecting the rising trendline. A break below this trendline followed by a retest could trigger continuation to the downside. Potential supports to watch:
112,017 (previous broken support, could flip resistance).
110,681 / 109,363 (structural levels).
108,432 (major demand zone).
RSI:
Momentum has cooled off without reaching overbought levels, suggesting that upside pressure is weakening.

Bitcoin long back to ATHJust recently opened up a long position on bitcoin. Aiming for ATH around $124600
Sl: 116380 around daily low point
Time sensitive
Market overall bullish due to fed rate cut and technical suggest higher prices at least to $119300 area. I think the market will attempt to push for new ATH though because a lot of people been waiting on rate cut for along time so at least an attempt to push higher.
Roughly 7 RR from my entry

BTC/USDT Analysis. Decision-Making Zones
Hello everyone! This is the CryptoRobotics trader-analyst with your daily market update.
Yesterday, we outlined two possible scenarios — and the market followed the second one. Bitcoin moved lower, testing the nearest buy zone, from which we can now reasonably expect renewed buying activity.
The current selling wave looks weak, so even a small reaction from buyers may lead to a retest of the local high. From that level, we will closely monitor price action, as a deeper correction could follow.
Buy Zones:
$116,200–$115,400 (accumulated volume, volume anomaly)
$114,300–$113,500 (volume zone)
$111,600–$110,500 (accumulated volume)
~$108,400 (cluster anomalies)
$108,000–$102,500 (accumulated volume)
Sell Zones:
$117,500–$119,000 (accumulated volume)
$121,200–$122,200 (buy absorption)
This publication is not financial advice.

Bitcoin fall ahead or breakout and new ATHstill the price is near 116K$ which is strong and major resistance of market and if it hold then heavy dump here will lead dump price even below 100K$ this time but also we can expect more rise and gain if we see valid breakout to the upside and then at least targets like 130K$ is easy one for bulls to reach.
also possibility of long is a little higher now with altcoin season that is started or even more range here.
DISCLAIMER: ((trade based on your own decision))
<<press like👍 if you enjoy💚

BTC 1H Aanalysis - Key Triggers Ahead | Day 42😃 Hey , how's it going ? Come over here — Winter got something for you!
⏰ We’re analyzing BTC on the 1-Hour timeframe.
👀 On the 1-hour timeframe for Bitcoin, we can see that after reaching the seller trigger zone around $117,825, price was rejected to the downside. Currently, it is losing an important support level on this timeframe, and if we get a candle close below this zone, Bitcoin will likely move toward the buyer trigger area. After that, the market will enter a decision-making phase, where we will have to wait and see what happens in the coming week.
🧮 Looking at the RSI oscillator, there is a key level around 34. If momentum breaks below this level, we could see a deeper correction in Bitcoin’s price.
🕯 The size and volume of red candles are increasing, showing that many traders are selling Bitcoin and closing their long contracts. We need to watch how far this selling pressure continues. This correction, along with the selling momentum, is not unusual — it’s a natural part of Bitcoin’s price movement. Once this correction is complete, we’ll need to see what structure Bitcoin forms next.
🧠 For Bitcoin to make a real bullish reversal without entering an accumulation phase, the support level currently being lost could turn into a strong resistance trigger for future long positions. However, the main trigger remains at $117,825. If Bitcoin breaks above and holds that level, it could even set a new all-time high (ATH).
❤️ Disclaimer : This analysis is purely based on my personal opinion and I only trade if the stated triggers are activated .

BITCOIN PREDICTION: THIS IS THE NEXT TARGET (scary) Yello Paradisers! Enjoy the video!
And Paradisers! Keep in mind to trade only with a proper professional trading strategy. Wait for confirmations. Play with tactics. This is the only way you can be long-term profitable.
Remember, don’t trade without confirmations. Wait for them before creating a trade. Be disciplined, patient, and emotionally controlled. Only trade the highest probability setups with the greatest risk to reward ratio. This will ensure that you become a long-term profitable professional trader.
Don't be a gambler. Don't try to get rich quick. Make sure that your trading is professionally based on proper strategies and trade tactics.

Analysis no 78Welcome to King King BTC 3. Bitcoin is in a descending channel on the daily time frame. It is expected that there will be a decrease in this channel to the numbers 113500_108000_104000. If the weekly candle closes above 119500, this decline will be canceled and you should wait for higher numbers. This is just a possibility. Be profitable.

BTC – BULLISH BREAKOUT CONFIRMED!
🎯 Targets Set:
T1 : $137,368
T2 : $146,995
T3 : $155,590
📈 Next leg up looks inevitable as long as price holds above the recent higher low.

Progression along support continues. The Gann Tool has Gann Fans built into it
Support travels along them
the 1/1 is the travel choice

Bitcoin (BTC/USDT) – Bullish Scenario Towards $130KBitcoin continues to maintain its bullish momentum on the daily chart.
Price action is forming higher highs and higher lows, indicating strong market structure.
📌 Key points in this idea:
- Immediate resistance around **$120,000**
- Key support zone near **$112,000 – $113,000**
- If BTC holds above support and breaks resistance, the next target could reach **$128,000 – $130,000**
- A corrective pullback is possible before the next leg up
This is an **educational idea**, not financial advice.
Do you think BTC will reach $130K before the end of the year? Share your thoughts below 👇

#BTCUSDT 6H ChartPrice is still sitting on the S/R Flip with no major changes. MACD is neutral, RSI is bought and EMAs are bullish. Price is still expected to move up and reach the 4h breaker zone at 119.2k.
