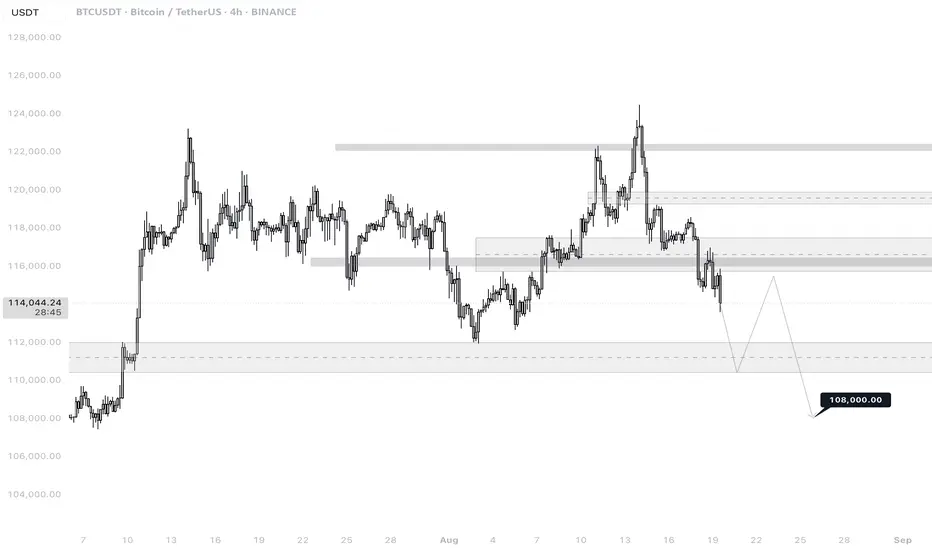
BTCUSDT 4H
🔎 Chart Context
• Pair: BTC/USDT
• Exchange: Binance
• Timeframe: 4H (240M)
• Date: 19 August 2025
This chart is mapped using liquidity zones, supply/demand levels, and structural market shifts to project BTC’s likely next move.
📊 Key Observations
1. Current Price Action
• BTC is trading around 114,050, following a sharp decline from the 124,000–125,000 resistance zone.
• The structure shifted bearish after rejection from the upper supply block.
• Current momentum is pushing toward deeper demand levels.
2. Support & Demand Zones
• 112,000–111,000: Nearest significant demand zone; previously acted as strong support after July accumulation.
• 108,000: Major liquidity target marked on the chart — a strong confluence area where large stop orders and institutional bids are likely to be placed.
3. Resistance Zones
• 118,000–119,000: Nearest overhead supply zone; likely to act as resistance on any short-term bounce.
• 124,000–125,000: Major resistance block that caused the latest rejection.
4. Liquidity Behavior
• BTC has already swept liquidity at 116,000–115,000 zone, triggering further downside.
• Liquidity magnets now sit lower, especially at 108,000, which is the projection target.
• Expect volatility as price interacts with the 111,000–112,000 demand block.
5. Projected Path
• Base case scenario (drawn on chart):
• Drop into 111,000–112,000 demand zone.
• Relief bounce toward 116,000–118,000 (supply retest).
• Continuation lower into 108,000 liquidity sweep.
📈 Bullish Case (Lower Probability, Countertrend)
• If BTC holds 112,000–111,000 demand zone strongly and invalidates supply at 118,000–119,000:
• First target: 120,000.
• Second target: 124,000–125,000 retest.
• Requires strong volume and supportive macro flows (e.g., USD weakness, strong equities).
📉 Bearish Case (Higher Probability)
• Structure favors downside continuation.
• Path:
• Retest of 116,000–118,000 supply zone (failed rally).
• Breakdown continuation to 108,000 liquidity target.
• This scenario aligns with broader DXY/EURUSD outlook where USD remains weak short-term but BTC could still flush liquidity before next bullish cycle.
⚡ Trading Plan
• Short Bias (Preferred Play):
• Entry: Relief rallies into 116,000–118,000.
• TP1: 112,000
• TP2: 108,000
• Stop: Above 120,000
• Long Setup (Risky, Countertrend):
• Entry: 111,000–112,000 demand zone.
• TP: 118,000
• Stop: Below 108,000
USTBTC trade ideas
Bitcoin on the Edge! Will $114K Hold or Break?Bitcoin ( BINANCE:BTCUSDT ) started to decline from the Potential Reversal Zone(PRZ) as I expected in the previous idea .
Bitcoin currently appears to have managed to break the Support zone($116,900-$115,730) and is currently trading near the Support zone($114,720-$113,570) , 50_EMA(Daily) , Monthly Pivot Point , and Cumulative Long Liquidation Leverage($114,300-$113,841) .
In terms of Elliott Wave theory , it appears that Bitcoin is completing microwave 4 of the main wave 3 (probably), and we should expect a re-attack on the Support zone($114,720-$113,570) in the coming hours .
I expect Bitcoin to attack the Support zone($114,720-$113,570) at least once more after completing the pullback to the Support zone($116,900-$115,730) from Cumulative Short Liquidation Leverage($116,411-$115,760) and if it breaks , we should expect a drop to the Heavy Support zone($111,980-$105,820) .
Cumulative Short Liquidation Leverage: $120,115-$118,751
Note: Stop Loss(SL): $117,320
Please respect each other's ideas and express them politely if you agree or disagree.
Bitcoin Analyze (BTCUSDT), 1-hour time frame.
Be sure to follow the updated ideas.
Do not forget to put a Stop loss for your positions (For every position you want to open).
Please follow your strategy and updates; this is just my Idea, and I will gladly see your ideas in this post.
Please do not forget the ✅' like '✅ button 🙏😊 & Share it with your friends; thanks, and Trade safe.

BTCUSDT | Long Setup | Channel Break | Aug 19, 2025📌 BTCUSDT | Long Setup | Channel Break + Liquidity Sweep Thesis | Aug 19, 2025
🔹 Thesis Summary
Bitcoin has broken below a key ascending channel support, triggering long liquidation into a high-volume node. This opens the door for a potential liquidity reversal targeting short liquidation above $130K, contingent on holding key demand near $112K.
🔹 Trade Setup
Bias: Long
Entry Zone: $111,000 – $113,000
Stop Loss: Below $108,300
Take-Profits:
TP1: $121,825
TP2: $131,774
TP3: $137,000
Max Target: $148,000
Risk/Reward: Approx. 4.5R depending on entry precision
🔹 Narrative & Context
Price has exited the lower boundary of a multi-week power channel, which previously acted as strong resistance and later support. The breakdown triggered long liquidations into a key demand zone around $112K, marked by the 200 EMA and visible volume profile support. If price stabilizes here, the move could trap aggressive shorts and fuel a squeeze higher.
This setup is also framed by prior liquidity patterns, with the recent drawdown clearing open long interest while keeping the macro structure intact unless $108K breaks. The next high-liquidity zone above sits near $131K, aligned with historical resistance and partial take-profit zones.
🔹 Macro Considerations
S&P 500 Risk: September correction is in play due to expected rate cuts and macro uncertainty. Historically, SPX pullbacks correlate with BTC drawdowns — watch for risk-off spillover.
Money Supply (M2): Flattening or decline in M2 supply globally would constrain liquidity and cap upside in crypto risk assets.
If $108K Breaks: Eyes shift to the major "Gold Fib" demand zone at $92K–$88K — a structural retest area from prior cycle value.
🔹 Forward Path
If this post gains traction (10+ likes), I’ll post a higher-timeframe breakdown and updated key levels into September volatility.
📌 Like & Follow for structured ideas, not signals. I post high-conviction setups here before broader narratives play out.
⚠️ Disclaimer: This is not financial advice. Always do your own research. Charts and visuals may include AI enhancements.

BTC 1H Analysis – Key Triggers Ahead | Day 16💀 Hey , how's it going ? Come over here — Satoshi got something for you !
⏰ We’re analyzing BTC on the 1-hour timeframe timeframe .
👀 On the 1-hour timeframe for Bitcoin, we can see that after losing the $115,000 support zone, Bitcoin is moving toward lower price levels. With increasing selling pressure, a deeper correction is likely.
⚙️ Our key RSI level is 33. If this level breaks down, short positions will gain more momentum, and the probability of entering the oversold zone will increase.
🕯 Candlestick behavior shows that bearish/red candles are larger in size and volume, initiating each corrective wave strongly. In contrast, bullish candles are smaller in size, higher in number, and have less volume, which reflects the strong dominance of sellers.
💵 USDT dominance (1-hour timeframe) has successfully broken above 4.37%. The next resistance lies at 4.50%. If this level is also broken, it will likely trigger even more selling pressure on Bitcoin.
🔔 Alarm Zone : There is no specific alarm zone right now, but by watching for pullbacks and breakouts in either direction, we can determine when to open new positions.
❤️ Disclaimer : This analysis is purely based on my personal opinion and I only trade if the stated triggers are activated .

TradeCityPro | Bitcoin Daily Analysis #157👋 Welcome to TradeCity Pro!
Let’s move on to the Bitcoin analysis. Bitcoin is still in correction mode and moving toward the 110000 zone. Let’s see how the market looks today.
⏳ 4-Hour Timeframe
Yesterday, Bitcoin made a pullback to the 116829 zone and is now ready to continue its decline.
💥 First, let’s check the RSI. This oscillator is very close to the 30 zone, and if this zone breaks, market momentum can turn bearish.
📉 The next support for this oscillator is 24.60. Based on the chart’s history, the probability of RSI being supported at this zone is high, but the distance between this zone and 30 can also trigger a sharp drop.
✔️ The price zone that Bitcoin could reach if RSI moves downward is 112233. The trigger for this bearish move was 114790, which is already being broken with this 4-hour candle. Let’s switch to the 1-Hour timeframe to see more details.
⏳ 1-Hour Timeframe
As you can see in this timeframe, after the pullback to 116829, a trigger formed at 114790, and the price is now breaking this zone.
📊 Given that RSI was rejected from the 50 zone, the price set a lower high compared to 116829, and the selling volume in the current candle increased, the probability of a move toward 112233 has increased significantly.
⭐ For a short position, we can enter with the break of this zone. As usual, I won’t open any position as long as Bitcoin is above 110000, and I recommend you don’t open shorts for now either.
📈 For a long position, the first trigger we have is the break of 116289. In case the break of 114790 turns out to be fake, we can also open a long position by confirming a V-Pattern.
❌ Disclaimer ❌
Trading futures is highly risky and dangerous. If you're not an expert, these triggers may not be suitable for you. You should first learn risk and capital management. You can also use the educational content from this channel.
Finally, these triggers reflect my personal opinions on price action, and the market may move completely against this analysis. So, do your own research before opening any position.

BTC next movementIf BTC stick to the trendline we will see movement upward in early to mid Nov 2025.

BTC/USDT 4H — Pinched Below $118K into Jackson HolePrice: ~$114.7K at write-time; day range ~$114.6–117.0K.
Trend: Lower highs; trading under MA “equilibrium” (~$117–118K).
Key Zones:
Support: $114.8K → $112K → $110–112K (reaction) → $104–102.5K → $99–101K (major).
Resistance: $118K → $121K → $124–126K (major) → $129–132K.
Plan:
Bearish: Below $114.8K, expect $112K → $110–112K; if $110K fails, then $104–102.5K → $99–101K.
Bullish: Above $118K, target $121K → $124–126K; clean break over $126K → $129–132K.
Invalidation: Shorts invalid if daily close >$118K; longs invalid if $110K breaks.
Flows & Catalysts:
Spot BTC & ETH ETFs saw fresh outflows → mild risk-off tone.
Derivatives liquidations >$200M in 24h → volatility pockets.
Macro: FOMC Minutes Aug 20, Powell at Jackson Hole Aug 22, US GDP Q2 Aug 28, Core PCE Aug 29.
Bias: Bearish/neutral below $117.5–118K; bullish only on decisive reclaim.

#BTC is in support, be wary of a rebound📊 #BTC is in support, be wary of a rebound ⚠️
🧠From a structural perspective, we're currently in an overlapping support zone on the 8-hour chart, so we need to be wary of the risk of a rebound. Short-term resistance lies around 117,000-118,500. 120,000 is extreme resistance, and I believe it will be difficult to reach directly.
➡️If the rebound fails here, we'll need to focus on the 12-hour support level, around 112,000, which was also the starting point of the rally in early August.
Let's see 👀
🤜If you like my analysis, please like 💖 and share 💬 BITGET:BTCUSDT.P

BTC/USDT Analysis. Absorption of Selling Pressure
Hello everyone! This is CryptoRobotics trader-analyst with your daily market update.
As expected, yesterday Bitcoin showed an initial reaction from buyers with a local rebound. After that, the price once again tested the ~$115,000 level, where the strongest absorption of selling had previously taken place. Despite renewed activity from limit buyers, we still do not see consistent market buying.
Only if the price consolidates above $116,000 can we expect an upward extension toward the next selling zone at $117,200–$119,000 (accumulated volumes). However, even in this case, opening long positions would be impractical due to the limited potential and elevated risks. For now, it is more reasonable to wait for a confirmed reversal or a stronger presence of market buyers.
Buy Zones:
$115,300–$114,000 (accumulated volumes)
$110,000–$105,000 (accumulated volumes)
Sell Zones:
$117,200–$119,000 (accumulated volumes)
$121,200–$122,200 (buying absorption)
This publication is not financial advice.

Long-term thoughts on Bitcoin.I'll just leave this here to check later. We are at the starting position for global growth. The mark on the take profit is becoming more and more realistic every day, after which there should be a good and fast rollback.


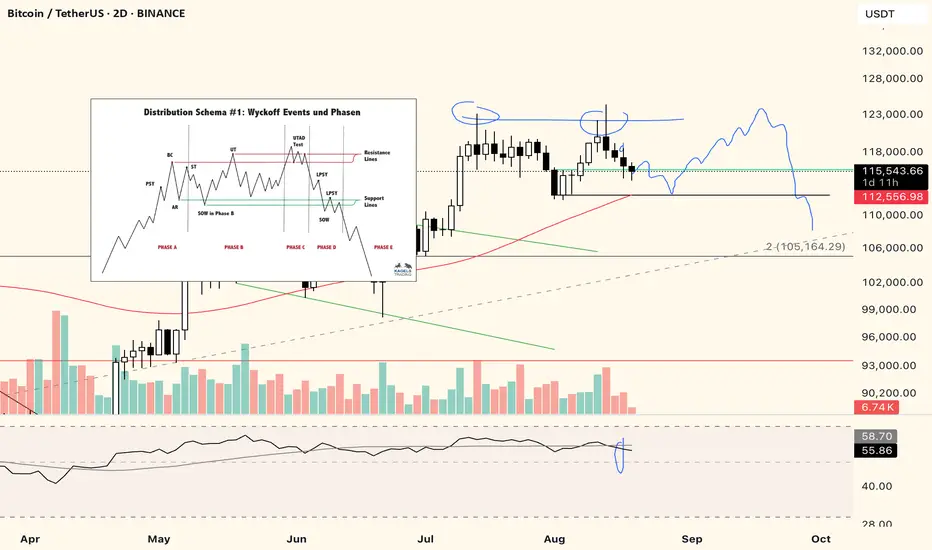
Bitcoin possible distribution schematic in playAs said in the title, looking for a distribution pattern to play out in Bitcoin. Please keep in mind that this is playing out on a relative lower timeframe. So one might see this as in-between sorcery while HTF trend continues to be up.
If it plays out like this, it means BTC will remain in a horizontal consolidation area allowing MARKETSCOM:ETHEREUM and CRYPTOCAP:TOTAL3 to continue to perform. Which in turn means we might see more bullish PA on ETH and ALTS over the next 1-2 months. When BTC indeed reaches a UTAD phase, there should follow a market-wide drop for cryptocurrencies.
This market-wide drop might be a steep one, dragging alts down -50% or such. But, if the HTF trend continues to be up, this might become a drop that is worth buying and leading towards a blow-off top phase towards 2026?
Bitcoin (BTC): Buyers Need To Reclaim $117K Support ZoneBTC is once again back below the local support zone, which has been one of our key areas since June.
However, we have previously fallen below that key zone and managed to recover well, so we are waiting for either a quick recovery, during which we will set our entry, or for a price level near $112K, where we might also see some buy-side volume if we reach that level.
Overall, we are bullish on Q4; we expect a new ATH!
Swallow Academy

BTC USDTHello fellow traders. I think Bitcoin hit an all-time high and many traders booked their profits. And the weekly resistance at 125,000 is important.

BTCUSDT LongAfter Liquidity Sweap we just broke the Structure and I will wait for the price to retest the Point of Control and Orderblock from lower timeframe

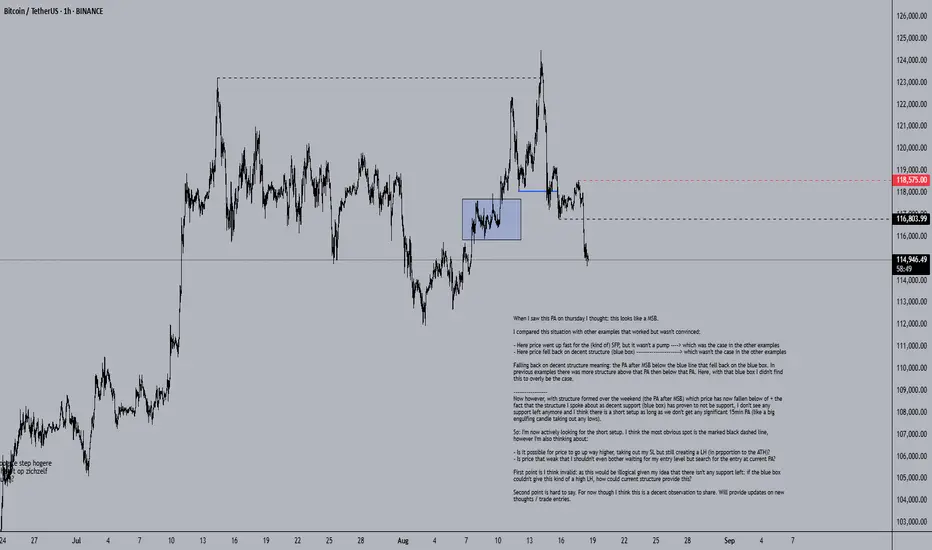
BTC Possible Trend Shift & Short SetupWhen I saw this PA on thursday I thought: this looks like a MSB.
I compared this situation with other examples that worked but wasn't convinced:
- Here price went up fast for the (kind of) SFP, but it wasn't a pump ----> which was the case in the other examples
- Here price fell back on decent structure (blue box) -----------------------> which wasn't the case in the other examples
Falling back on decent structure meaning: the PA after MSB below the blue line that fell back on the blue box. In previous examples there was more structure above that PA then below that PA. Here, with that blue box I didn't find this to overly be the case.
------------------
Now however, with structure formed over the weekend (the PA after MSB) which price has now fallen below of + the fact that the structure I spoke about as decent support (blue box) has proven to not be support, I don't see any support left anymore and I think there is a short setup as long as we don't get any significant 15min PA (like a big engulfing candle taking out any lows).
So: I'm now actively looking for the short setup. I think the most obvious spot is the marked black dashed line, however I'm also thinking about:
- Is it possible for price to go up way higher, taking out my SL but still creating a LH (in prpportion to the ATH)?
- Is price that weak that I shouldn't even bother waiting for my entry level but search for the entry at current PA?
First point is I think invalid: as this would be illogical given my idea that there isn't any support left: if the blue box couldn't give this kind of a high LH, how could current structure provide this?
Second point is hard to say. For now though I think this is a decent observation to share. Will provide updates on new thoughts / trade entries.