BTC SHORT : Failure to Close Above 112KPrice failed to close and hold above 112K. Found strong resistance at the 100 day MA. Not looking good for bulls anymore . Are we ready to see the 90K area again?
USTBTC trade ideas

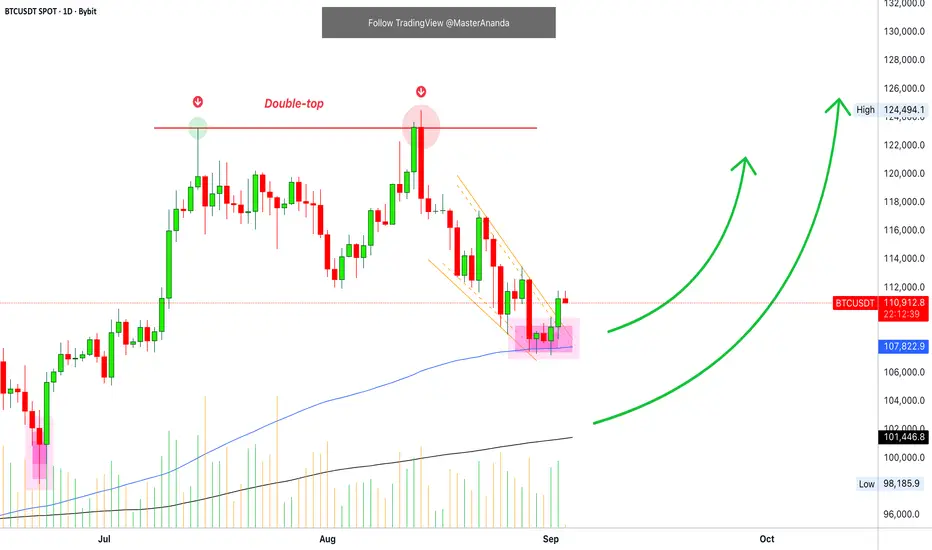
BTC starts to show signs of recovery💎 BTC PLAN UPDATE – START OF WEEK (09/03/2025 )
Mid-week BTC Analysis
Currently, BTC is reacting around the support zone ~111,000 – 110,500 (confluence of EMA200 D1 and 0.5 Fibonacci). This is an important short-term support area; if it holds, a rebound may occur in the next few sessions.
If BTC bounces from this level, it could retest short-term resistance levels at:
• 111,900 – 112,200 (EMA34 + nearest resistance)
• 114,100 – 114,500 (0.382 Fibonacci)
• 116,000 – 117,000 (0.236 Fibonacci + previous strong resistance)
If the 110,500 support is broken, price could easily drop toward:
• 108,400 – 108,000 (mid-term support)
• 104,800 – 105,000 (major support, extended Fibonacci zone)
Trend:
• Mid-term: still in a corrective downtrend.
• Short-term: possible technical rebound from current support zone, with the first target around 114,000 – 116,000.
👉 In summary: Mid-week, BTC is at a critical zone. Holding 110,500 – 111,000 favors a rebound scenario; if this area breaks, downside pressure may extend toward 108K – 105K.

Bitcoin - Important scenario of what will happend soon!Did you know this cycle is almost identical to the 2020 cycle?
When I say identical, I don’t mean the exact percentage of price moves, but rather the price behavior and market structure.
If you look closely at the Bitcoin chart, you’ll notice that the current price action is very similar to what happened back in 2020 — and not only that, it’s happening in the same months as well.
There are so many strong similarities confirming this theory.
📌 So what’s the reason behind this?
-Both cycles are happening under Trump’s presidency.
-Same policies, same decisions, which lead to the same market behavior.
-The market is literally moving the same way it did during his first term.
- for example Bitcoin Dominance, didn’t reach the 66% level since 2020, and right after that it dropped to around 40%. The same setup could be repeating now... as it's expected to move up and retest the 60% level during Sep before going to 40% level
And here’s the shocking part 👇
If you check the SPX fractal between Feb 19, 2020 and 2025, you’ll see the exact same pattern — even on the same day! This can’t just be a coincidence. It’s part of a much bigger game being played on us.
Based on this, here’s what I expect:
The S&P 500 (SPX) could correct around 10% in September, dropping towards the 5800 level.
And of course, this will have a direct impact on the crypto market, likely causing it to drop in September.
So what should we expect?
September is likely to start with high volatility and downside pressure, with some altcoins potentially dumping over 30%.
After that, starting in October, we could be entering the real bull run, lasting until mid-2026.
Best Regards :
Ceciliones🎯

TradeCityPro | Bitcoin Daily Analysis #168👋 Welcome to TradeCity Pro!
Let’s move on to the Bitcoin analysis. Yesterday Bitcoin made an upward move and has now reached an important zone. Let’s see how the market wants to react to this resistance.
⏳ 1-Hour Timeframe
Yesterday Bitcoin briefly faked a breakout of its trendline but then broke it again and also activated its trigger.
🔍 Currently, the price has reached the resistance zone and is trying to penetrate it. The volume has increased throughout this upward move, which shows the strength of the buyers.
📊 If you opened a position with the triggers we had, now is not a bad time to take some profit and secure your position. But definitely leave a portion of it open so that in case the zone breaks, you won’t be left without a position.
🔔 Even with the breakout of this zone, a new long position can be opened. This zone has a lot of sell orders, and if the price manages to push through them, it can begin a sharp upward move.
💥 The RSI oscillator is stabilizing above the 64.09 level, which is a very good sign for buyers and increases the probability of breaking the zone.
✔️ However, if this RSI level fakes out, the chance of rejection from the zone rises, and in that case, the price correction can continue down to the 110721 and 109577 levels.
❌ Disclaimer ❌
Trading futures is highly risky and dangerous. If you're not an expert, these triggers may not be suitable for you. You should first learn risk and capital management. You can also use the educational content from this channel.
Finally, these triggers reflect my personal opinions on price action, and the market may move completely against this analysis. So, do your own research before opening any position.

BITCOIN PREDICTION: IS USA MANIPULATING THE MARKET?! (big move) Yello Paradisers! We have been taking a look at what's going on with the new data release from USA. We have been taking a look at the CME futures gap. We have been taking a look at the multi-timeframe analysis on the ultra-high timeframe chart. We have been going through the moving average touch channel possible reclaim and the Elliott Wave Theory on multiple timeframes. I've shared with you where, with the highest probability, the next move will happen and what kind of confirmations we are waiting for.
Paradisers! Keep in mind to trade only with a proper professional trading strategy. Wait for confirmations. Play with tactics. This is the only way you can be long-term profitable.
Remember, don’t trade without confirmations. Wait for them before creating a trade. Be disciplined, patient, and emotionally controlled. Only trade the highest probability setups with the greatest risk to reward ratio. This will ensure that you become a long-term profitable professional trader.
Don't be a gambler. Don't try to get rich quick. Make sure that your trading is professionally based on proper strategies and trade tactics.

Lingrid | BTCUSDT Buying Opportunity From Confluence ZoneBINANCE:BTCUSDT is rebounding from support after completing an ABC pullback inside the broader upward channel. The structure shows a mix of compression phases and breakout legs, now aligning near a key support zone. As long as 106,000 holds, price could extend toward 117,000, with 125,000 as the next major resistance zone. The broader momentum remains bullish, but continuation depends on buyers defending this mid-range.
📉 Key Levels
Buy trigger: Breakout above 112,000 with volume confirmation
Buy zone: 106,000–108,000 accumulation region
Target: 117,000
Invalidation: Close below 100,000
💡 Risks
Failure to hold 106,000 support may expose BTC to deeper retracement toward 97,000.
Broader macro headwinds, such as Fed rate outlook, could limit upside momentum.
If sellers step in strongly near 117,000, rejection could trap late buyers.
If this idea resonates with you or you have your own opinion, traders, hit the comments. I’m excited to read your thoughts!

Bitcoin (BTC): Buyers Claiming Zones One by One | BullishBTC buyers are clearly showing dominance here, and everything is going according to plan.
Price is pushing higher and holding steady above local support, keeping the bullish momentum alive. The next magnet remains the CME gap at $116K, which stays as our first target before we even think about the ATH push. As long as buyers keep control, the bullish scenario is intact and unfolding just as expected.
Swallow Academy

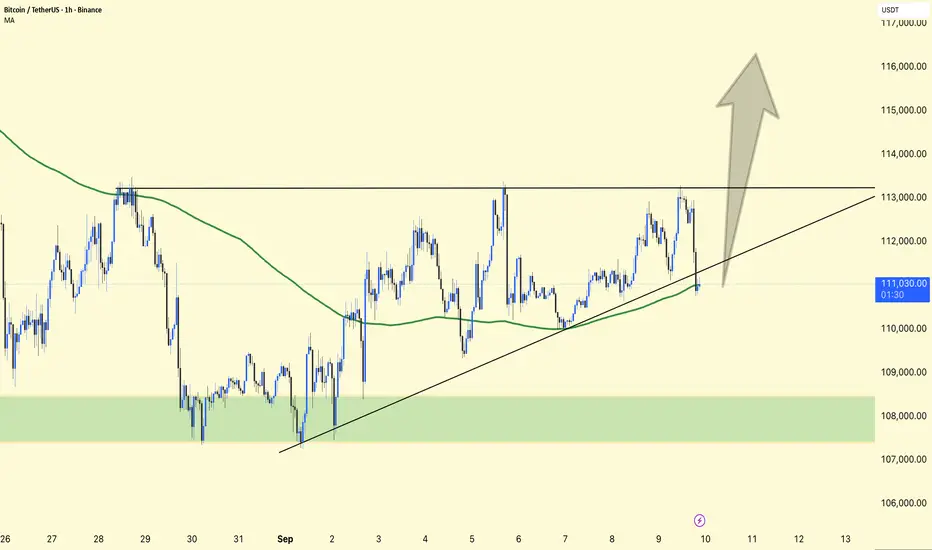
BTCUSDT 1H Chart Analysis !!BTCUSDT 1H Chart Analysis
Current Price
BTC is trading near $111,000, sitting right on top of the trendline support.
The 111K MA (Moving Average) is also aligned here, adding extra strength to this support zone.
Resistance Zone
The most important level above is $113,000.
This has acted as a ceiling multiple times; a clean breakout with volume could send BTC quickly higher.
Bullish Scenario 🚀
If BTC breaks $113K with strength, the next upside targets are:
$115,000 (psychological resistance)
$117,000 (measured move from the ascending structure).
Strong breakout here may trigger short squeezes, fueling momentum.
Bearish Scenario ⚠️
If BTC fails to hold the trendline + MA support, price could drop back into the $109K–108K demand zone (highlighted green box).
Below $108K, downside risk increases sharply.
Market Context
Structure is higher-lows, showing buyers still defending dips.
But BTC is stuck in a range between support ($111K) and resistance ($113K).
BTC is at a decision point.
✅ Break above $113K = bullish continuation toward $115–117K.
❌ Rejection and break below support = pullback into $109–108K demand zone.
BITCOIN - Blow off top ? Well history doesn't repeat itself but it definitely rhymes.
My target for this cycle is still in the higher part of this longterm ascending channel between 160K - 220K.
Share your opinions
Do you think top is in ?
Or end of the year will be final expansion?
Can FED rates cut fuel this rally?
David Perk

BTC SLOW SLOW TRADE Short BTC with SL 114k, first target 112.8k, main target 111.9k–111.5k.
TP1: 112.8k (first liquidity pocket).
TP2: 111.9k–111.5k (main draw).
114k (last rejection high).
Too slow for me. But this is after all the expansion.

Bitcoin (BTC): Getting Closer To Bullish CME | $117K We are getting closer to the Bullish CME gap, with buyers keeping the momentum and continuing to show pressure, giving us soon a potential breakout from the 200EMA, which is currently being tested.
The reaction from the liquidity zone last week gave us the needed confirmation for this bullish scenario, so the plan stays the same — as long as buyers keep control, we look for continuation to the upside.
Swallow Academy

Bitcoin (BTC): Seeing Bullish Momentum Building UpAfter a struggle near the 100 EMA, buyers seem to have taken back control over that zone, which might be opening a buying opportunity for us soon.
The ideal scenario would still be a touch into the zone of liquidity, but that’s why we placed 2 entries here in the first place. Now we wait for either one to be reached, and once we see a proper breakout, we’re aiming straight for the $140K–$150K zone.
Swallow Academy

BITCOIN SETUP ALERT ! Bitcoin Zones Where Sell
SELL NOW ACTIVE ZONE FVG : 114.00
SELL PENDING ORDER FVG + OB : 117.00
Good Luck With Your Trading 🤞

Bitcoin (BTC): Buyers Secured 200EMA | Going For $116-117KBTC finally managed to break above the 200EMA after multiple failed attempts — a key bullish signal we’ve been waiting for. Buyers have been showing strength since the reaction from the liquidity zone, and this breakout adds further confirmation to our bullish scenario.
Our next focus remains the bullish CME gap around $116K–117K. As long as buyers hold momentum above the 200EMA, continuation to the upside is the plan.
Swallow Academy

Be Caution About Opening Any Long Position🥱 Since 2017, I have never seen the crypto market this boring and stagnant. The best strategy in such conditions is simply to stay away from trading, because the risk-to-reward ratio of any trade at the moment is not attractive enough to justify entering.
👉 Anyway, let’s take a look at Bitcoin’s current situation.
📥 The $123,000 zone acted as a key resistance, and in my view, the second rejection should be considered as wave B, At the moment, we are in the cycle of wave C
📉 I believe wave C still has one more leg down toward the $104,000 area, as wave 5 of C.
👉 As long as the price is trading below the $113,000 range, entering any long positions is not recommended.

Bitcoin Daily MACD & RSI, Most Likely Scenario & How To TradeTo many people Bitcoin is mixed right now or even bearish. The $125,000 price tag is the cycle top and we are due a massive bull market.
To me, Bitcoin is bullish and more growth is definitely possible. If this is true, we should find some hints on the chart. If I am wrong, most of the signals should point lower. It would be impossible to fine dozens of bullish signals on this chart.
Let's read the chart and see what happens.
Bitcoin's daily RSI doesn't look great but we have an interesting signal, let me show it to you. And the indicator right now leans more bullish rather than bearish. We are looking at the daily timeframe.
BTCUSDT (D) RSI
There was a low 22-June followed by a bullish move. The next major low happened very recently, late August.
Notice how the late August low managed to reached below the 22-June low, a lower low. A weak one so it can also be considered a double-bottom.
BTCUSDT is quite different. 22-June we had a low $98,186. In Late August, the lowest Bitcoin did was $107,250; a higher low.
This is a classic hidden bullish divergence. This signal is not very strong but it is a start. A divergence can show up for weeks or even months before it reflects on the price.
The fact that Bitcoin continues to trade above $110,000 more than 52 days after peaking is also positive. But these are not definitive signals, it is more of a mix.
The MACD is in a different situation, trading within the bearish zone with a bullish bias. The bullish bias comes from the fact that the MACD is rising after hitting the lowest point since March—but it can still move lower before recovering.
BTCUSDT (D) MACD
In March Bitcoin was bearish and crashing as the 2025 correction low happened on the 7th of April. So it is the first time the MACD moves below zero after the April recovery.
See the MACD chart. First there is a drop and once a low is hit we get a small bounce, the bounce is followed by a new drop and then the indicator starts to rise.
While the MACD bottomed in March, Bitcoin bottomed in April, this is the classic lag, a lagging indicator.
The MACD can bottom anytime and as it hits bottom, we know what follows is a wave of growth even if it takes a while to show up on Bitcoin's price.
Bearish Signals
The double-top is a bearish signal but this one has been consumed with the recent down-move. Bitcoin can indeed move lower but this isn't a necessity, not a market compulsion. If Bitcoin continues lower, we know this is only short-term based on the other signals we are seeing.
The RSI is still below 50 even if rising. The MACD is in the bearish zone even if it is starting to turn. We need strong signals and strong indicators to confirm a major advance.
Conclusion
Bitcoin is likely to continue growing short-term, mid-term and long-term. On the very short-term, say one to two weeks, anything is possible. On this very short time horizon Bitcoin can easily crash according to the chart.
Most Likely Scenarios
More sideways, more neutral, more bearish action followed by growth.
Bitcoin is likely to continue in this kind of mixed period for sometime. If we consider the bigger picture, we are still locked within the $100,000 and $125,000 price range.
For LONG or SHORT, wait for the trend.
For spot accumulation, focus on the altcoins.
For Bitcoin, the best is to wait. The time to buy was when prices were below $100,000 or $90,000. There are better choices right now.
The next time to buy is when the signals become really strong, or when prices are trading at support. It all depends on your trading style, risk tolerance and your goals of course.
Do not be distracted by market noise. When we focus on the short-term, we tend to miss the bigger picture. The truth is that the most money is made when the market is in a trend.
Since we are in a bull market, we wait for support and go LONG. When the bull market is over, each time there is a bounce or a price advance it becomes an opportunity to go SHORT.
We trade in the same direction of the market.
Thanks a lot for your continued support.
Namaste.
TradeCityPro | Bitcoin Daily Analysis #167👋 Welcome to TradeCity Pro!
Let’s go for Bitcoin analysis, Bitcoin has finally broken out of the box it was in. Let’s see what positions it can give us today.
⏳ 1-Hour Timeframe
Yesterday Bitcoin broke the 109577 level and the trendline that it had in the higher timeframes, and now it has reached the resistance of 110721.
⭐ We have not yet received confirmation of the trendline breakout because no volume has entered the market, and the price has not made higher highs and higher lows, so it can still be said that the trendline is not yet broken.
📊 If volume starts to increase and the 110721 ceiling is broken, we get confirmation of the breakout of this trendline. If RSI also breaks the 64.09 level, we can take momentum confirmation from it.
💥 With the breakout of 110721, a long position can be opened on Bitcoin. If Bitcoin dominance continues its upward movement, this position can be very attractive, but if dominance starts to drop, altcoins will be a much better option.
🔽 For a short position, a fakeout of this upward movement and price stabilizing below the 109577 level would be a good trigger for a fakeout, and in the lower timeframes, we can open a short position with price stabilizing below 109577.
❌ Disclaimer ❌
Trading futures is highly risky and dangerous. If you're not an expert, these triggers may not be suitable for you. You should first learn risk and capital management. You can also use the educational content from this channel.
Finally, these triggers reflect my personal opinions on price action, and the market may move completely against this analysis. So, do your own research before opening any position.

#BTC/USDT Bullish Divergence on 1H, Low Risk Trade#BTC
The price is moving within a descending channel on the 1-hour frame, adhering well to it, and is heading for a strong breakout and retest.
We have a bearish trend on the RSI indicator that is about to be broken and retested, which supports the upward breakout.
There is a major support area in green at 109800, which represents a strong support point.
For inquiries, please leave a comment.
We are in a consolidation trend above the 100 Moving Average.
Entry price: 111164
First target: 111727
Second target: 112450
Third target: 113470
Don't forget a simple matter: capital management.
When you reach the first target, save some money and then change your stop-loss order to an entry order.
For inquiries, please leave a comment.
Thank you.

BTCUSDTBitcoin (BTC) Price Analysis: Bearish Outlook
Based on the daily chart for BTC/USDT, a bearish sentiment is building. The analysis is supported by a classic RSI (Relative Strength Index) divergence, a strong signal that the current uptrend is losing its momentum.
An RSI divergence happens when the price makes a higher high, but the RSI indicator fails to do the same, creating a lower high. This indicates that the buying pressure is weakening, and a price reversal is likely to occur.
Additionally, the chart shows that if the price breaks below the last key low, it would confirm a shift in the market trend from bullish to bearish. This breakdown could lead to a significant price decline.
Based on this analysis, here are the potential trade levels:
Entry Price: Look for a short entry if the price breaks and closes below the support level of $105,536.
Stop Loss (SL): To manage risk, place the stop loss just above the recent swing high at $114,237. This will protect your position if the price unexpectedly reverses and continues its upward trend.
Take Profit (TP): The first target for profit taking is the next major support level at $85,063. This level represents a key point of previous support where the price could find a floor.
Disclaimer: This is a trading idea based on technical analysis and is not financial advice. Trading cryptocurrencies carries a high risk of loss, and you should always do your own research before making any trading decisions.


My next trade! 🔎 What we do:
Identify high-probability setups
Break down price action with clarity
Focus on continuation plays, deviations, and market structure shifts
Keep learning simple, practical, and effective
⚡ Today’s Trade Idea:
Setup: Simple continuation play from demand OR a deviation play from the consolidation range.
Entry Trigger: Waiting for a market structure change ✅ for confirmation before involvement.
💡 Mission:
Helping traders build confidence, discipline, and a solid edge in the markets.

$BTC Bounce Holds Strong: Eyes on $124.5K NextCRYPTOCAP:BTC is holding steady around $114,000 after bouncing right off the $111,600 support zone.
Buyers stepped in strongly at that level, showing they’re not ready to let the price drop further.
This green zone is acting as a solid base, and if BTC can continue to close above it, momentum is likely to shift back toward the upside.
The next key target sits near $124,500, which lines up with the last major swing high.
As long as we remain above $111,600, the market structure appears healthy, and bulls still hold the upper hand.
DYOR, NFA
