BTC USD reversal BTC showing sign of reversal entry TS on a higher time frame , but and wil be a risky trade so entering on a lower quantity
USTBTC trade ideas

#BTC Potential Bearish Head and Shoulders📊#BTC Potential Bearish Head and Shoulders📉
🧠From a structural perspective, we've reached a new all-time high, but the weekly resistance level is nearby. Chasing the trend here presents a less-than-ideal profit-loss ratio and carries a higher risk. There's a chance a bearish head and shoulders pattern could form. If so, consider some short trades.
➡️If you're shorting now, be aware that you're trading against the trend, so use a small position. The advantage of this approach is a higher profit-loss ratio, but a lower win rate.
🤜If you like my analysis, please like 💖 and share 💬
BITGET:BTCUSDT.P

11/10/2025 BITCOIN On Going Ending Of Cycle 🔹 Market Outlook & Personal Warning
I’m seeing the end of a diagonal wave for this current cycle.
Don’t FOMO just because another big piece of news is coming out.
To avoid long-term risks that may be hard to handle,
I strongly suggest those who have already made a decent profit
to start scaling out gradually and reduce exposure.
In my view, the $131,000 – $144,000 range could mark the final ATH of this cycle.
After that, we might enter a major correction phase toward $40,000 —
it may sound impossible to some, but time will tell,
regardless of how positive the current fundamentals may appear.
Some may think I’m crazy or overly cautious — and that’s fine.
I’ve been through two full BTC cycles since 2017,
and I sincerely hope you won’t experience what many did back then.
This post may trigger mixed reactions,
but I have no personal gain from sharing this outlook.
I’m simply offering a friendly warning
to help others avoid potential massive losses before it’s too late.
Stay safe, stay rational —
Good luck to everyone out there.

BTC The Liquidation Before the PumpIn the past 24 hours, the crypto market has experienced a significant wave of liquidations, with estimates ranging from several hundred million to over one billion USD. Bitcoin’s share of these liquidations appears relatively modest—amounting to tens of millions—while the majority of forced exits have occurred in altcoins and leveraged positions.
After briefly dipping toward the $100K level, Bitcoin’s price action formed a substantial downside wick, suggesting an area that sellers may look to retest should further downward pressure persist.
I’m currently watching for a potential scalp short opportunity just below $120K, as overall crypto enthusiasm—particularly in altcoins—appears to be fading. That said, even if the price revisits the $100K zone, I wouldn’t turn excessively bearish. Historically, similar periods of panic have coincided with major market bottoms, such as during the COVID crash, which ultimately preceded a parabolic rally.
Additionally, I’ve identified what may be a complex Elliott Wave structure known as a Triple Combination Correction, consisting of multiple ABC (three-wave zigzag) formations. Elliott characterized these as corrective patterns that often maintain mathematical relationships to preceding waves—relationships that can be measured using a trend-based Fibonacci extension across the three initial pivots. Traders commonly refer to such projections as “measured moves.”
This price behavior also aligns with Wyckoff’s principles of distribution, in which the secondary X-wave represents the UTAD (Upthrust After Distribution) before price retraces toward the origin of the W-wave.
For additional confluence, I’m monitoring key support areas such as the previous low VWAP. For now, however, my primary focus remains on observing the likelihood of a bounce between $98K and $100K, based on the outlined technical structures.

BITCOIN !!!Hello friends
Given the good decline we had, a good opportunity was provided to buy at good prices with capital and risk management and in steps and move to the specified goals.
There was good liquidity at the bottom that was collected, now we can expect a good growth.
*Trade safely with us*

BITCOIN BTCUSDTThe bitcoin daily loss is pat of trading strategy,gain and losses is what comes with trading any instrument.
Macroeconomic Jitters Intensify Crypto Volatility as Global risk sentiment turned sharply negative after the U.S. announced new 100% tariffs on Chinese tech imports, reigniting fears of a prolonged trade conflict.
the current crypto downturn reflects a complex mix of macroeconomic headwinds, leveraged liquidations, and cooling sentiment after record-breaking highs.
key demand floor is 100,067 break and close sell into next demand structure.
#bitcoin #btc

BTC - How Manipulation Works and How to Detect It I subscribe to premium solely for the multi second time frames, time frames that you may think are useless.
What if I told you this is the ONLY true way to detect manipulation?
HOW MANIPULATION WORKS
It’s a lot more subtle than you think.
The main driver of what moves the price of Bitcoin is the adverse orders from derivatives and leveraged positions. These orders being stop loss orders and liquidation orders.
In essence, it’s traders own decisions and orders, that cause price to move in an opposite direction.
You may have heard people say “Do the Opposite” or “Contrarian Trader”. What they mean is, the market seems to move in the opposite direction as the majority sentiment. Even the fear and greed index is used to convey this principal.
However there’s a true and technical way of understanding this.
As bitcoins price moves and consolidates SLOWLY and STEADILY in one direction, this extended period of time allows traders to enter leveraged positions in that same direction that’s moving price slowly up or slowly down.
Consequently, these trades are leaving opposite direction orders of a larger magnitude, such as stop loss orders for the “entire leveraged position size”. For example, Trader Bob uses $100 to inject liquidity into a long position, and opts to use 80x because of his confidence in Bitcoin moving up. Trader Bob then sets a stop loss order which “sells” his position and closes 100% of his leveraged position size. Trader Bob sets BELOW the current price a sell order for $8,000 - 80x his original $100 injected.
MANIPULATION comes in two distinct parts.
1) Price is held stable, to ACCUMULATE and ATTRACT more of the orders (long or short) - which the market makers and exchanges know is ACTUALLY creating more propellant and energy that will move price in the opposite way.
As an example, if Bitcoin is at 100,000 and the market makers and exchanges know there’s a mass amount of liquidity to reclaim at 80,000 - they will do a series of manipulations to get price to that level.
A) They will hold price steady while looking like Bitcoin is about to keep moving up. This attracts more longs with different leverage and stop loss orders creeping closer to 80,000
B) They will drop price slowly, and rise back quickly. The slow drop allows time for traders to work down the price scale those stop losses and liquidations, and the fast rise ensures they are left in tact and price won’t move low enough to trigger off the chain reaction.
SUMMARY OF 1)
Price is manipulation by being KEPT or STABLE from setting off the chain reaction of stop loss orders, which offering time to get traders to place more of these orders.
NOTE THAT Market Makers don’t place their own trades. They accommodate leveraging traders. That said, they do want their money back - so they want traders to place trades in the losing direction, while simultaneously having their own stop loss orders set a chain reaction that takes price to the level they want.
2) Price is PUSHED or FORCED into the chain reaction of stop loss orders and liquidation orders.
This is the manipulation that forces price, however we can understand the mechanics fully and understand the intentions.
Manipulators (hidden providers of liquidity) will place icebergs or many small orders, which generate large volume in small time intervals, and force bitcoin into the series of orders.
It is then the traders own adverse orders that automatically fulfill the price movement.
SUMMARY OF 2)
Price manipulation is initially forcing price into a series of stop loss orders and liquidation orders, and it’s possible to detect this.
USING THE 5 SECOND TIMEFRAME TO DETECT MANIPULATION
1) Add the basic VOLUME indicator to your chart
NOTE - Suggest using Binance BTC chart
2) Note the Volume moving average - which is shown as a Bitcoin Amount transacted each 5 second interval. This is commonly 0-2 BTC transacted per 5 second.
3) Observe each candle volume coming in. The time frame is small enough that you can see if it’s a buy or sell, very seldomly mixed buys / sells. This also serves as an alternative Order Book.
4) Watch for abnormally large volume transactions on the 5 second candles. It’s not out of the ordinary to spot a 5 second candle that contains 500 BTC bought or sold.
THIS is CERTAINLY the price manipulation that forces price into a sequence of stop loss orders.
5) Use that buy or sell manipulation volume candle as a que to understand the intention of where price is going to be forced.
THE WRAP UP
I hope to assist you all with understanding that the Bitcoin chart is very much INTENTIONAL and can be treated as a STRATEGIC BUSINESS due to the market cap being dominated by leveraging liquidity and few players who control it.
Love and luck to all,
- DD
Positive Market - BTC Continues to Find New ATHBTCUSD Analysis
Bitcoin is currently testing the upper boundary of a long-term ascending channel, where price has previously faced rejection several times (as shown by the red arrows).
The market recently completed a strong rally toward 124K, aligning with the 1.618 Fibonacci extension (123,609) — a significant resistance zone that triggered selling pressure.
Key observations:
• Resistance area: Around 124K–125K, aligning with the upper channel line — potential for short-term correction.
• Support zones: The first support lies near 118,100, followed by 115,000–115,500, both acting as Fibonacci retracement zones.
• Possible scenarios:
1. Price may retrace toward 118K–115K to gather liquidity before another push upward.
2. If the market holds above 123K, a breakout toward 132K–133K could be confirmed.
Overall, momentum remains bullish, but the current zone requires caution — a short-term pullback is likely before the next major move.

#BTC Update | 12.10.2025🚨 #BTC Update | 12.10.2025 🚨
Bitcoin had a massive drop, making a deep wick near the 100K zone — a true disaster day for many traders with huge liquidations across the market 😬💥
As I mentioned in my previous analysis, once BTC lost the support at Arrow #1 and #2, the bullish momentum weakened, opening the door for a deeper retracement on the weekly timeframe.
📉 The weekly retracement zone was marked around 104,669, and guess what? — on Friday’s wick, price tapped it perfectly. 🎯
Now, the focus shifts to Arrow #3 and #4 — once the price breaks above these levels, we can look to re-enter buy positions confidently. ✅
Remember, on the bigger timeframes, the overall structure remains bullish, so this pullback could just be a healthy correction before the next leg up. 🚀
I expect a strong recovery move after Monday, which could confirm the breakout.
Next up 👉 I’ll post the #BTC.D and #ETH analysis, so stay connected, stay patient, and trade smart! 💪🔥
#Bitcoin #Crypto #Trading #BTCAnalysis #SwingTrade

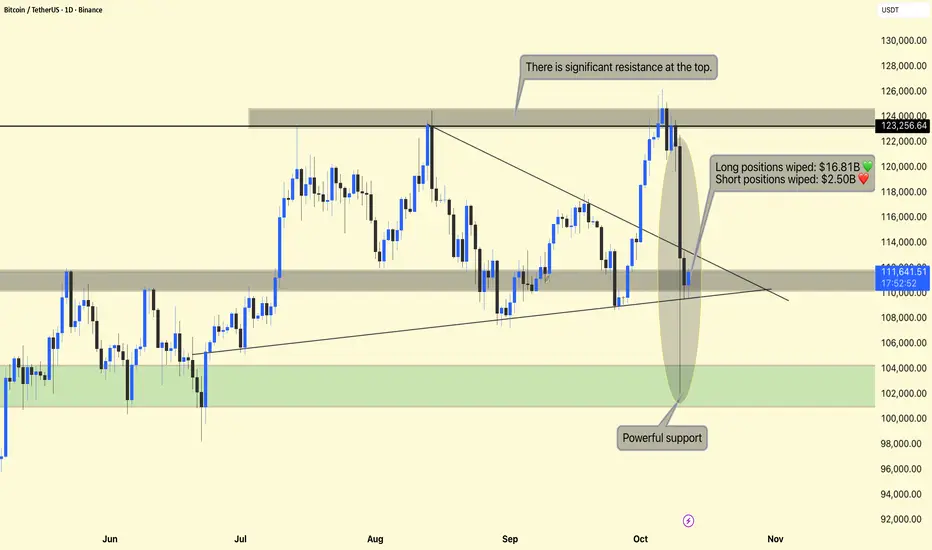
Bitcoin (BTC/USDT) – Daily Chart Analysis !!Bitcoin (BTC/USDT)
The chart shows a sharp correction from the $124,000 resistance zone, followed by a major liquidation event that wiped out:
Long positions: $16.81B
Short positions: $2.50B
This represents one of the most volatile 24-hour periods in recent months — aligning with the Fear & Greed Index drop to Extreme Fear (24).
$123,000 – $124,000 Major Resistance Strong supply area — multiple rejections in past rallies.
$111,000 – $110,000 Current Support Zone Price is currently consolidating here after the crash.
$102,000 – $104,000 Powerful Support Historical accumulation zone — where buyers previously stepped in aggressively.
Resistance Rejection
At the top of the range ($123,000–$124,000), BTC encountered heavy resistance, triggering large-scale profit-taking and the liquidation of overleveraged long positions.
This area has acted as a strong rejection zone several times since August, indicating sellers are defending it aggressively.
Breakdown and Liquidations
After the breakdown of the descending triangle, cascading liquidations forced a steep drop.
This led to a high-volume candle (highlighted area) where:
Liquidity was cleared both above and below key support levels.
Market sentiment flipped rapidly from Greed → Extreme Fear.
This kind of liquidation sweep often signals a short-term capitulation — a flush before possible recovery.
Support & Market Structure
Price bounced from near $110,000, a previous structure support level.
If BTC maintains above $110,000, it may attempt to stabilize and retest mid-range resistance around $115,000–$116,000.
However, if price breaks below $110,000, we could see a retest of the $102,000–$104,000 demand zone, which is marked as “Powerful Support” — a key area where long-term buyers might re-enter.
DYOR | NFA
#BITCOIN ANALYSIS I have been warning you for the last 45 days #BITCOIN ANALYSIS
I have been warning you for the last 45 days that a big dump was coming and now it’s playing out exactly. Bitcoin has already dumped around $20K and is now trading near 112K, right at the major resistance zone that has triggered every big correction since 2018.
A small bounce to 115K–116K is possible, but after that I expect another leg down toward 100K, and potentially lower to 90K.
I’m still holding my 50% short position. If anything changes or I close my position, I’ll update you. Remember I mentioned earlier that if BTC went back to 125K–128K, I would add more shorts and that plan hasn’t changed.
Till Monday, I expect some volatility, but Monday’s price action will give a clearer direction.
🔸 Weekly:
BTC touched the long-term trendline again → clear rejection happened.
👉 Until we get a weekly close above 125K, the risk of a major pullback stays high.
BITSTAMP:BTCUSD
🔸 Daily:
Price is inside the 110K–125K supply zone. Structure is weak.
If price breaks and resists below 110K, then 100K is the next target.
📊 My Trade:
✅ First target 105K hit
Holding 50% shorts, expecting a bounce to 115K, then lower.
📌 Downside Targets: 105K ✅ → 100K → 95K → 90K

What if...?A rising wedge pattern in the final stages makes sense to me. We've been trading up only since 2023 and past cycles always end before everyone keep waiting for the "last leg up" to sell. Why this time should be any different?

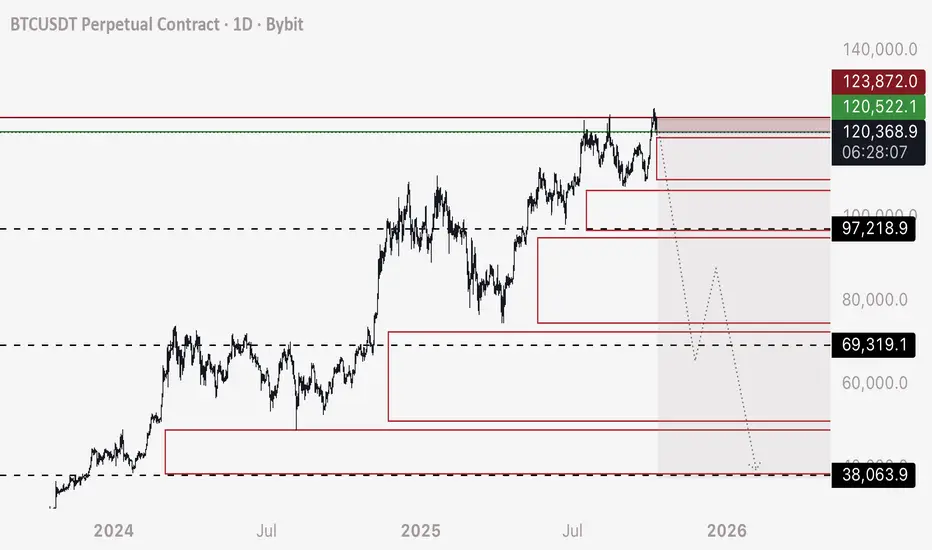
BTC - Short a Stop Hunt and Stay on the Right SideI’m breaking my larger idea down into multiple trades, now that others are opening up to the reality that it’s possible.
These order blocks shown are filled with long position stop losses, leveraged sell orders that only fill when price crosses over - and will set off like a chain reaction.
This will create a very fast drop IE Stop Hunt - and we can take advantage of it.
TRADE 1 - SHORT
Entry - 120,200 to 120,500
Stop Loss - 123,800 (although I don’t see Bitcoin rising back above 121,000 before this trade completes)
Target 1 - 97,250 (Close 25% of trade)
Target 2 - 69,400 (Close 50% of trade)
Target 3 - 38,100 (Close 40-90% of trade as it’s possible we continue to drop and don’t retrace from here to 90,000 appx)
I’ll be logging this trade.
All the best and buckle in.
- DD
BTC/USDT Analysis. Will longs resume?
Hello everyone! This is CryptoRobotics trader-analyst, and here’s the daily market overview.
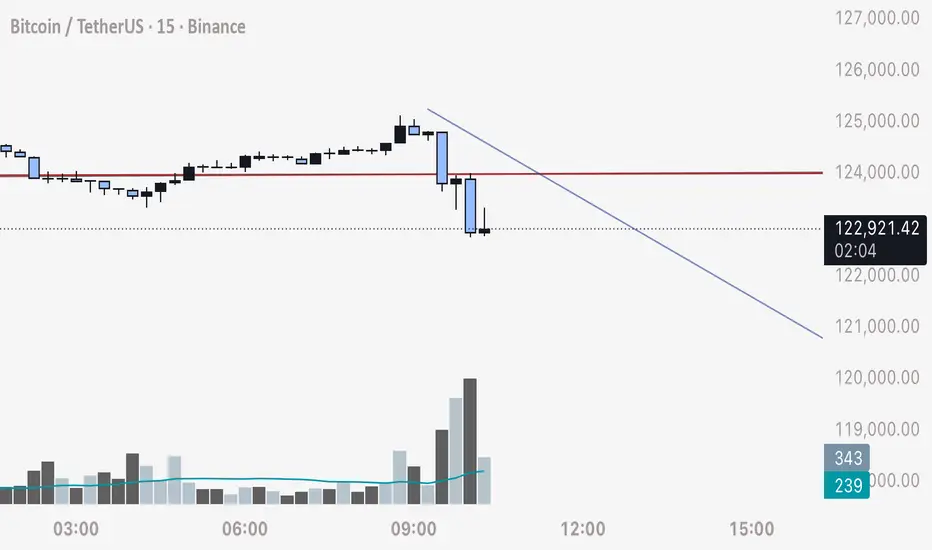
Yesterday, after we highlighted the absorption pattern on Bitcoin, the price slightly recovered and entered sideways consolidation, holding within the range for nearly a full day. The initial target at $124,000 was reached earlier than expected, but it formed the upper boundary of the current range.
At the moment, Bitcoin continues rotating within this range. The main expectation is a test of the local low and the buying zone at $120,400–$119,400 (selling absorption). If strong buying protection appears there, the potential will be aimed toward the all-time high.
If the reaction is weak or absent, we may see a decline toward ~$116,000.
Buy zones:
$120,400–$119,400 (selling absorption)
$116,700–$115,000 (pushing volumes, strong graphical imbalance)
$112,500–$111,500 (mirror zone, volume anomalies)
$110,000–$108,800 (strong selling absorption)
This publication is not financial advice.

BTC - Bullish BiasThe price aggressively consolidated around this zone, where the bulls are trying their best not to lose control. With Gold making an (ATH), it would be risky to short BTC here, as there is likely some more room for a move up remaining. When you see this type of accumulation wick in an uptrending market, you should know that institutions are accumulating. Although the current market sentiment is very bearish, I like to bet the opposite way. I might be wrong, but we will see. That is why we call trading a game of probability."
Another sure indication is that we are dumping liquidity just before the New York (NY) open, plus the UK session accumulated liquidity. This suggests a kind of lower time-frame bullish scenario for the duration of the NY open.

Bitcoin Cup and Handle Pattern!BTCUSDT technical analysis update
BTC is forming a cup and handle pattern on the weekly chart. The price is currently forming the handle, which could take 1-2 months to complete. Once the price breaks the neckline, we can expect a significant bullish move in BTC.
Regards
Hexa

Forecast for BTCUSDT 9th October 2026 (Updated)Forecast for BTC for the next 4 weeks. Quick decline to $120k followed by a bounce to ~$127k followed by continuation down to ~$104k for a bottoming before new all-time-high towards ~$150k-$170k.

BTC/USDTENTRY:122927_125700
SL:126505
TP:109700
Hunter pressing the trap button
**Please observe capital management
There is no responsibility for your profits or losses.**

Bitcoin btc 4h
The main target of the analysis is a decline to the $98,000 zone.
If price takes the opposite path and closes above $126,500 on the 4-hour chart, the bearish analysis is invalidated and price is expected to rise toward the $141,700–$142,000 zone.

BITCOIN Is Still Bearish (1D)All these upward moves look like a pullback to the supply zone that had not yet been tested. It is expected that after some ranging around this area, the price will drop, breaking the liquidity pool forming beneath the candles and moving toward TP 1.
This outlook remains valid as long as no daily candle closes above the invalidation level.
For risk management, please don't forget stop loss and capital management
When we reach the first target, save some profit and then change the stop to entry
Comment if you have any questions
Thank You

BITCOIN BTCUSDT The bitcoin daily loss is part of trading strategy, gains and losses is what comes with trading any instrument.
Macroeconomic Jitters Intensify Crypto Volatility as Global risk sentiment turned sharply negative after the U.S. announced new 100% tariffs on Chinese tech imports, reigniting fears of a prolonged trade conflict.
the current crypto downturn reflects a complex mix of macroeconomic headwinds, leveraged liquidations, and cooling sentiment after record-breaking highs.
key demand floors 107,829-107,500
key demand floor is 100,067 break and close sell into next demand structure.
key demand floor 98,849-98,733
key demand floor 94400-93760
#bitcoin #btc

BTC is in Showing a Weakness COINBASE:BTCUSD CRYPTO:BTCUSD BINANCE:BTCUSD OKX:BTCUSD KRAKEN:BTCUSD CRYPTO:BTCUSD BINANCEUS:BTCUSD BINANCE:BTCUSDT BINANCE:BTCUSDT.P BYBIT:BTCUSDT.P BYBIT:BTCUSD.P OKX:BTCUSDT.P MEXC:BTCUSDT.P BITGET:BTCUSDT.P BINANCE:BTCUSD.P DELTAIN:BTCUSD.P BINGX:BTCUSDT.P BITMEX:BTCUSD.P BITMEX:BTCUSD.P DERIBIT:BTCUSD.P KRAKEN:BTCUSD.P BYBIT:BTCUSDC.P WEEX:BTCUSDT.P KRAKEN:BTCUSD.PM BINGX:BTCUSDC.P BINANCE:BCHUSDT.P
🧭 Overall Context
Time Frame-Daily
Price recently failed to sustain above the $120K zone and dropped sharply, indicating exhaustion at higher levels. The current structure suggests BTC is at a critical inflection point — either to find support and resume the uptrend, or to confirm a deeper correction.
🟩 Key Levels Identified
Zone Type Level Comment
Last Attempt (Supply Zone) $119,789 – $118,362 Strong rejection area — where the last bullish attempt failed. This is now a confirmed supply/resistance zone.
Major Resistance $116,710 Secondary ceiling — breakdown confirmation level if retested and rejected.
Current Support Zone $114,624 – $110,129 Immediate support area. Price is hovering here — holding this zone = potential short-term bounce.
Critical Break Level $107,328 If broken, bearish continuation likely. Marks the boundary between range and potential deeper correction.
New Low Target Zone $87,513 – $82,743 Key demand area if correction deepens. Historically high liquidity and prior structure base.
Major Low $74,485 Extreme bearish target — long-term accumulation area if BTC enters deep retracement mode.
📉 Bearish Case (Downside Scenario)
If BTC breaks and closes below $107,328, it signals:
Breakdown of the medium-term structure.
Momentum likely shifts toward $87,500 → $82,700 region.
Below that, the final macro support lies at $74,500, aligning with the previous cycle’s higher low.
Indicators confirming bearish bias:
Strong rejection wicks near $120K zone.
Sequential lower highs forming since the top.
Trading Implication:
➡️ Short-term bias: Sell rallies below $116K.
➡️ Medium-term bias: Bearish continuation under $107K.
➡️ Target zones: $87K – $82K – $74K.
📈 Bullish Case (Recovery Scenario)
For bulls to regain control:
BTC must defend $110K zone and push above $116K – $118K.
A daily close above $119,800 reopens path to $126K and beyond.
Signs of bullish continuation:
Bullish engulfing candles forming around $110K zone.
Volume confirmation and reclaim of $116K resistance.
Possible retest of $126K “high liquidity” zone.
Trading Implication:
➡️ Short-term bias: Buy dips near $110K with tight stop below $107K.
➡️ Target zones: $118K → $126K.
➡️ Invalidation: Breakdown below $107K.
🧩 Structural Interpretation
Current structure = Range between $110K and $119K.
The breakdown candle shows institutional rejection — likely distribution near the highs.
Price may consolidate before the next impulsive leg.
If support holds → sideways-to-up; if breaks → sharp continuation down.
🕯️ Market Psychology
Above $120K: Euphoria / final push of the upcycle.
Current ($110K): Hope and uncertainty — participants deciding if this is a dip or start of decline.
Below $107K: Fear and capitulation → could trigger larger retracement.
📊 Summary Table
Bias Key Confirmation Target Notes
Bullish Reclaim $118K $126K Needs strength & volume
Neutral/Range Between $110K–$118K — Wait for breakout
Bearish Break below $107K $87K → $82K → $74K Momentum continuation
🎯 Final Take
BTC is at a pivot zone ($110K area) — the next few daily candles will confirm whether this becomes:
a re-accumulation (for another push to $126K+), or
a distribution top (leading to deeper retracement).
📌 Plan of Action:
Watch $107K closely → if broken, prepare for a move to $87K.
Reclaim $118K → signals bulls back in control.
Use $114K – $110K as immediate reaction zone for short-term scalps or entries.

BTCToday, BINANCE:BTCUSDT.P dropped by around 17%. It may fall further, or it may not — but one thing I know for sure: market panic has always been my most profitable time. When fear dominates and the entire market is crashing, that’s when the best opportunities appear.
If you panic — you’re far from professionalism. If you enter, take your profit, and calmly move on — that’s a sign of skill. In trading, professionalism isn’t optional; without it, you won’t survive — and sometimes that’s quite literal.
So, in times like these — when some made quick profits, others took heavy losses, and only a few truly gained — I’ll share a thought that changed my mindset years ago. After losing a significant amount, I realized that was the true cost of the trading education I once wanted to buy.
Trade with minimal risk and invest the rest in your learning — it’s always the right investment.
And just to be clear — I don’t sell courses, and this message isn’t for profit.
It’s genuine advice. Have a great day.
