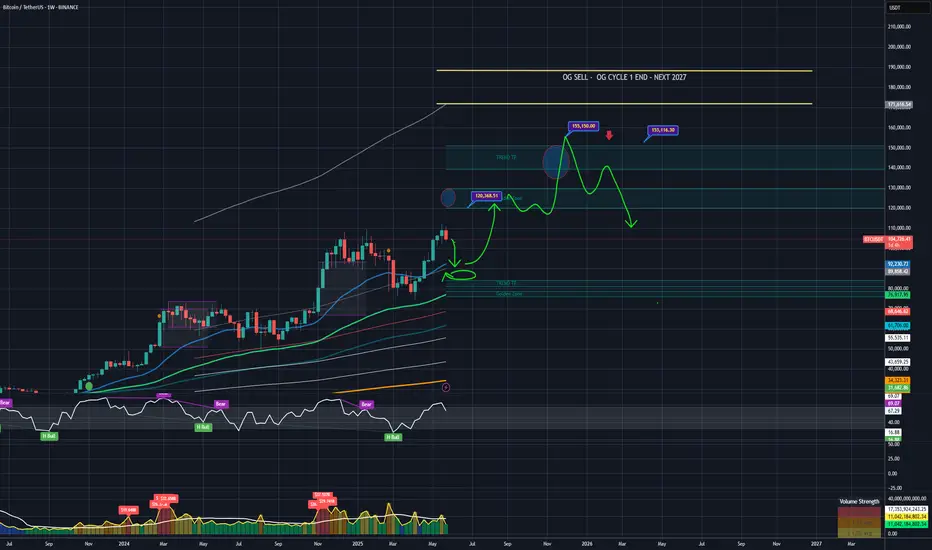
OG CYCLES - NOV 2025 - 2026 FEBOG CYCLE 1 - 132 300 - 155 200 / 2025 NOV - 2026 FEB
OG CYCLE 2 - 250 000 - 302 300 / 2027 Last cycle / Focus BTC only
USTBTC trade ideas
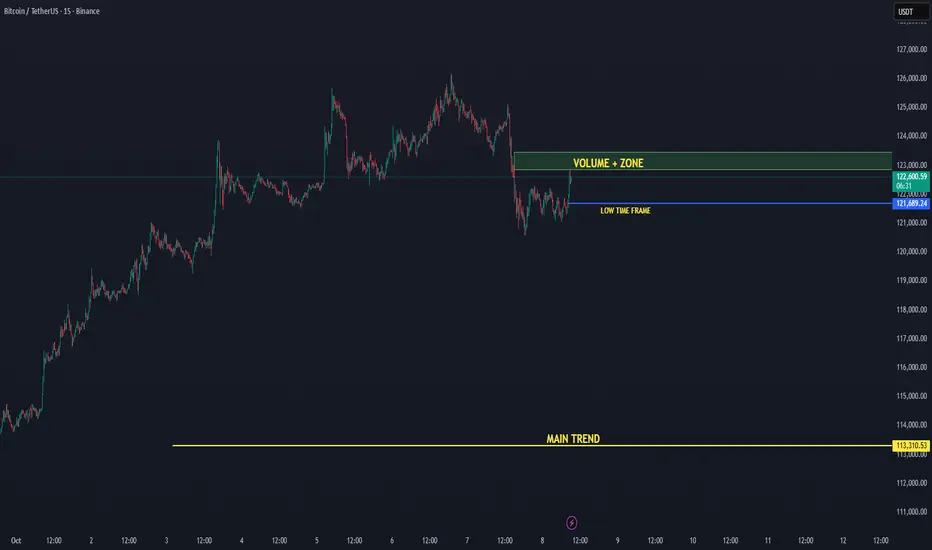
BTC/USDT — Low Time Frame Recovered, Eyes on Volume 08-10-2025Bitcoin has reclaimed its low time frame level near $121.6K, signaling renewed short-term strength. Price is now pushing upward toward the +Volume Zone, an area where increased buying activity could trigger a breakout continuation.
📈 Low Time Frame Reclaimed: BTC has stabilized above the local structure, confirming short-term bullish momentum.
🔊 Volume Zone Target: The next resistance sits around $123K, where increased trading activity could accelerate a move higher.
🟢 Main Trend Active: The primary uptrend remains strong as long as BTC holds above the $113K main trend support.
Technical Levels:
🟢 Main Trend Support: $113K
🟡 Low Time Frame Support: $121.6K
🔊 Volume Zone Resistance: $123K
🎯 Next Target: $125–$126K
Outlook:
Bitcoin is showing healthy recovery momentum, reclaiming short-term structure and heading into the Volume Zone. If it sustains above $121.6K and breaks $123K with volume confirmation, a continuation toward $125K+ becomes likely.
📊 Bias: Bullish continuation
📈 Focus: Volume reaction at $123K
BTC - Short - 3 Wave Correction Bitcoin Short signal with a lower entry for those that didn’t catch the last top.
3 simple targets.
Entry - 111,900-112,000
Stop Loss - 116,400
Target 1 - 85,000
Target 2 - 36,000
Target 3 - 10,000
Buckle in.
- DD

BITCOINTHE ROOF connecting the two most current highs on 3hr close provided a perfect point of entry and the best rejection for the daily candle.the zone of 124,478-125k was rejected.
i dont know if its possible to return to 116-117k zone ,however should price comes to this zone we have a buy floor ,based on the break and retest rule.
break and close 124,478-125k will expose 135k-145k zone depending on the volatility +liquidity in the market.
dont forget that take profit is on the way for earlier investors, dont let them dump this coin on you.
GOODLUCK
#BTC #BITCOIN

BTC Game Plan - DTB ModelBTC Game Plan – DTB Model
📊 Market Sentiment
After the sharp 10/10 crash triggered by Trump’s announcement of up to 100% tariffs on Chinese imports, risk assets — especially altcoins — faced massive liquidation, with some dropping over 80%.
As of 12/10, headlines indicate that Trump may reach out to President Xi, with Vice President Vance clarifying the statement. The market reacted bullishly, showing a strong rebound.
However, sentiment remains neutral, as volatility persists and geopolitical uncertainty continues to influence short-term direction.
📈 Technical Analysis
BTC retraced into the HTF Demand Zone, running the daily swing liquidity inside it.
Additionally, price retested the bearish trendline, confirming it as a key technical pivot.
Currently, BTC is attempting to recover toward the equilibrium (0.5 Fibonacci) of the recent decline.
📘 Model to be used – Demand to Trendline Break (DTB Model)
1-Identify HTF trend and valid demand zones.
2-Wait for liquidity sweep inside demand for energy confirmation.
3-Watch for price recovery toward equilibrium (0.5 fib).
4-Confirm with a strong close above bearish trendline and equilibrium for entry signal.
📌 Game Plan
I’ll be waiting for BTC to break and close above the 0.5 Fibonacci (equilibrium) and the orange bearish trendline. That will be the first confirmation that the bearish phase may end, and momentum may shift to the upside.
🎯 Setup Trigger
Daily strong close above the orange bearish trendline and 0.5 Fibonacci equilibrium level.
📋 Trade Management
Stoploss: Below $107,500 (protecting capital is more important than chasing profits)
Target: $126,300 (near previous all-time highs)
💬 Like, follow, and comment if this breakdown supports your trading! More setups and market insights coming soon — stay connected!
⚠️ Disclaimer: This content is for informational and educational purposes only and does not constitute financial, investment, or trading advice. Always DYOR before making any financial decisions.

MY LATEST BTC LONG SETUP We just witnessed another Super Liquidity Grab as (arguably) expected. Nonetheless the massive liquidation that just took place, has open new opportunities for Long and possibly new ATH in the making.

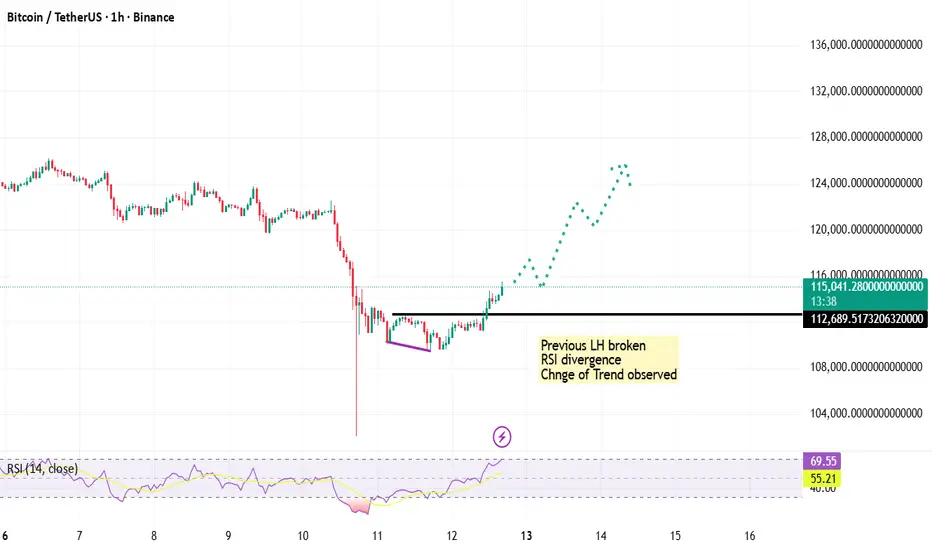
BTCUSDT – Shift in Structure Signals Bullish MomentumBTCUSDT is displaying a clear shift in market structure after a prolonged corrective phase. The recent formation of a Higher Low (HL) followed by a break to the upside indicates that sellers are losing control and buyers are gradually stepping back in. According to Dow Theory, the emergence of consecutive Higher Highs (HH) and Higher Lows confirms a trend reversal—and BTC is currently aligning with that structure.
The RSI has recovered strongly from oversold levels without showing any bearish divergence, which further validates bullish strength rather than signaling exhaustion. With price reclaiming previous resistance levels and converting them into support, momentum appears to be building for a potential continuation move. As long as price sustains above the recent Higher Low, BTCUSDT is poised to print new HHs, supporting a bullish outlook for the sessions ahead.
BTC is still bullishOn Friday, amid euphoric bullish sentiment on BTC that even I was part of to an extent, President Donald J. Trump, of the United States Announced 100% Tarriffs on China... Not to go into too much detail, but there was a flash crash on all assets; Bitcoin one of them.
Here, I highlight my bullish bias for two simple reasons
1. The flash crash could not break below 100k and quickly rebounded... That signals profit taking at a specific level, I anticipate repricing below the flash crash low for smart money to accumulate new longs, we are still inside of the orderblock/innefficiency so there is a high chance we fail to actually trade much below it and rebound once more from that level.
Reason 2: It's bitcoin c'mon, we are bullish.
Real Reason 2: Check out the monthly chart here, people fail to zoom out, that is why they succumb to fear almost immediately something unexpected happens, but in reality, it was supposed to happen a long time ago, it just put it off long enough to fool exit liquidity
There is a monthly inefficiency just below the low put in in June, so yes, I'm bullish.
See you later.

BTCUSDTHi
CRYPTOCAP:BTC is correction from ATH but if couldn't keep level (110.000$) we see more downtrend and I think deep bear-trend to 80.000$.

BTC in the next 2-3 weeksEvery time a big crash created a large wick with a small body, it occurred at the 0.232 fib level.

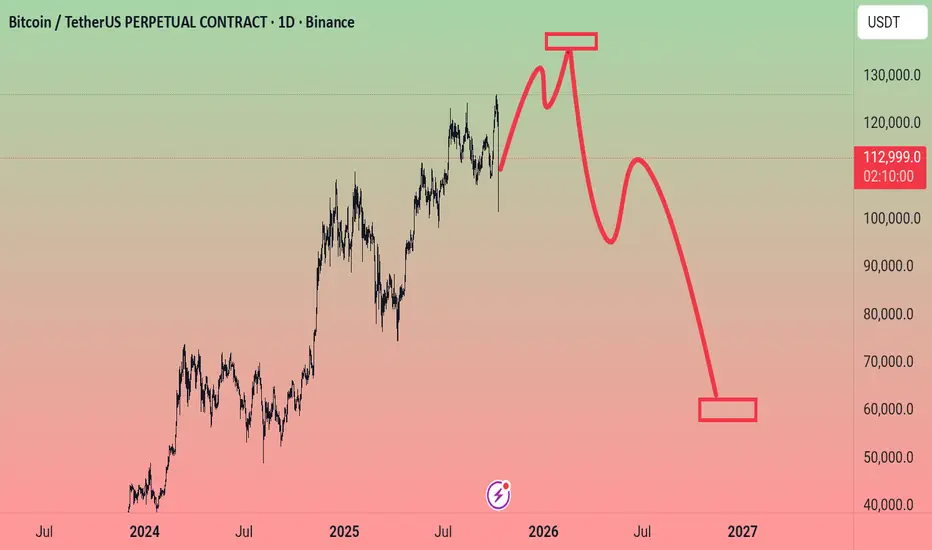
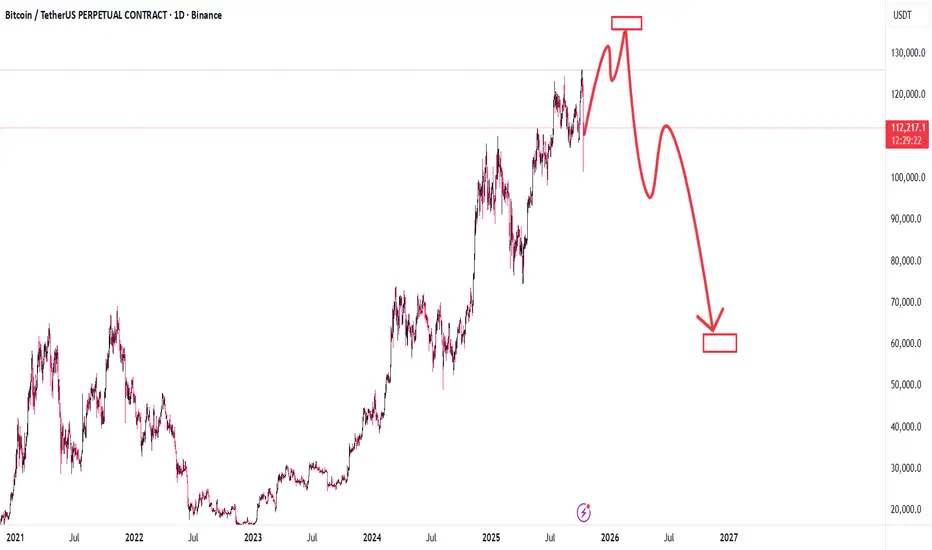
Bear market cycle scenarioPump into end of october, 120-140k target. Dump into march 2026, sentiment low, alts bleeding. Sideways till 10/2027, sentiment dead, alts dead, last cycle new coins as layer2 OP, ARB, and so on bled hard. Optimal buying oportunity.

BTC; A Recession Before The Next Rise..?Hi Everyone..
Lets take a view at BTCUSDT, the crypto market witnessed a strong liquidation on Friday and it happens to be the highest ever in the history to occurred at a single day.
On the report side, the dip effect was principally from U.S and China trade pressure on the announcement of %100 tariff on Chinese goods been imported. however the U.S dollar currency strengthen more amid the government shutdown. at the moment the "Uptober" psychology is at pause.
In regard to this structure, we can observe clearly how the price broke the lower circle with a sharp retracement creating a chance of downward movement, with a target toward 92k$ and $76k as the next partial support.
Like and follow up
Thanks for reading

Is the #BTC bull market still here?📊Is the #BTC bull market still here?💬
🧠From a structural perspective, the weekly and monthly charts remain bullish, the bullish trend remains intact, and the bullish target range (132k-175k) is still within reach, so don't be too pessimistic.
➡️This type of high-leverage liquidation event isn't the first time. Similar structures occurred on December 5th, 2024, and January 3rd, 2024. If you look back at the market, you'll see that we always hit new highs after liquidating most of the high leverage.
➡️Interestingly, history is similar; the only difference is the price and volatility!
⚠️Note: We shouldn't blindly pursue similar events. We should always maintain a respectful attitude and strictly manage risks. Survival is more important than anything else!
🤜If you like my analysis, please like 💖 and share 💬
BITGET:BTCUSDT.P

As a trader , I expect for 130000 fk dollor I can reminde previous wave that happened in the pervous cycle . Thats seems me the last movment dosent happen yet 😃
Trades for today Tuesday 10/7 BTC shortTrades for today Tuesday 10/7 BTC short....Using PAR, Pd highs and lows and divergences.

BTC HOLDS LEVELS FOR MORE..BTC/USDT — Main Trend Holds Strong at $112K, Confirmation Near
Bitcoin is currently trading just below the low time frame zone around $124.5K, showing slight resistance before a potential confirmation breakout. Despite this minor pullback, the main trend remains firmly intact around $112K, which continues to act as the key structural support.
⚙️ Main trend updated to $112K: This level defines Bitcoin’s long-term bullish structure — as long as BTC stays above it, momentum remains positive.
📉 Below low time frame: BTC is temporarily consolidating under local resistance, but proximity to this level suggests a potential re-test and confirmation soon.
🚀 Upside target: Once the low time frame confirms, Bitcoin could aim for the next resistance zone near $132K.
Technical Outlook:
🟢 Main Trend (Support): $112K
🟡 Low Time Frame Resistance: $124.5K
🎯 Next Target: $132K (upon confirmation)
Summary:
BTC remains structurally bullish above the $112K main trend. While still slightly below the short-term confirmation zone, it’s positioned well for a potential continuation — provided support holds and price regains momentum above $124.5K.
📊 Bias: Cautiously Bullish
📈 Key Levels: Support $112K | Resistance $124.5K | Target $132K

BTCUSDT – ABC Correction Hey traders 👋
Bitcoin might be setting up for a strong move downwards after completing what appears to be a 5-wave impulse structure on the higher timeframe.
There’s also a clear RSI bearish divergence, suggesting that bullish momentum is fading and a correction could be near.
I’m currently expecting a medium-term ABC corrective phase, though it’s still uncertain whether it will develop as a classic zig-zag or a flat/flag-type correction.
🎯 Trade Plan (Short Setup)
- Entry Zone: 112,000 – 118,000 USDT
- Stop Loss: above 125,000 USDT
- Take Profit 1: 75,000 USDT
- Take Profit 2: 52,000 USDT
- Final Target (Wave C): around 43,000 USDT
⚡ Notes:
If BTC breaks below the previous wave 4 area with strong momentum, that would add more confirmation to the corrective scenario. However, if the market maintains higher lows, we could still see an extended B-wave or even a continuation of the uptrend.
📘 Reminder:
This is not financial advice — always DYOR and manage your risk properly.

BTCUSDT-Point to Strong Bullish Setup at $112K SupportLooking at this weekly BTC chart, you can see Bitcoin has been consistently holding above the 50 EMA, acting as solid support each time it retraces back to it. The key point to note here is how the price has tested this zone multiple times, forming a strong area of confluence. Each time, Bitcoin has successfully bounced, showing a solid structure to keep the uptrend intact.
At this moment, Bitcoin is facing resistance around $126,000, but the market looks strong, especially with the EMA holding as support. If the price breaks this resistance, we could be in for another leg up towards higher targets. The price action here indicates that bulls are in control, and the current setup suggests there's a good chance we might see more upside soon, especially if the zone around $112,000 holds as support.
Keep an eye on the key levels: if BTC holds above the 50 EMA and the confluence zone, the next push could be significant.

Don't worry.I can reminde previous wave that happened in the pervous cycle . Thats seems me the last movment dosent happen yet
Bitcoin (BTC), End of Cycle Season Based on Cycle DurationBINANCE:BTCUSDT
Bitcoin appears to have already formed its peak within the current bullish cycle and may now be preparing for a correction.
Alternatively, if BTC makes another attempt to reach a new all-time high within October, that period could mark the final peak of this cycle.
Looking at historical data, Bitcoin has shown a repeating pattern —
an uptrend lasting approximately 3 years and 11 months (1,065 days) from the bottom,
followed by a downtrend of about 1 year (365 days) from the peak.
During down cycles, the cycle low has typically formed between the EMA 50 and EMA 100.
Backtesting monthly charts shows that Bitcoin often breaks below the EMA 50, finds support above the EMA 100, and then breaks through the Ichimoku Cloud, signaling the start of a new bullish cycle.
Become an early follower and be part of the journey.🚀
I am Korean and I used Google Translate.

Descriptions about the market! Read the caption!Given Mr. Trump's remarks and the unprecedented crash in cryptocurrencies, I must say this individual significantly harms markets, especially investors. Imposing a 100% tariff on Chinese goods essentially means "we want no trade with you," which is fundamentally unfeasible. The United States and China will undoubtedly negotiate. However, our main focus here is the financial market collapse. This decline isn’t merely about falling prices—it goes beyond that. The core issue is the loss of market trust and credibility. Once confidence is broken, it is difficult to restore and may take a long time.
In any case, I felt it was my duty to bring this up and remind you to stay composed. Never forget to use stop-losses in your trades and practice proper capital management.
If needed, you can always message me on this platform for advice.
NOTE: This post is This post is educational.
$BINANCE:BTCUSDT BINANCE:BTCUSDT
30min hollows
After a spectacular price drop of 16% - 17% over 8 hours on 30 minutes timeframe chart...
We can say that a downward parallel channel has been formed, from which since the price came out of the channel, this signaled the beginning of the consolidation phase, that is the stabilization of the price.
The stabilization rate ranges between 4%.
So using the Fibonacci retracement sequence, we can see the Support and Resistance areas forming.
So there is this condition:
If the price is within the support point and breaks it downwards, this means that the market trend will be downward.
Respectively, if the price enters the resistance point and then breaks it, we can say that we have an upward market trend.
and then the resistance point will become the support point.
Good Luck
#CryptoHellas team

126K is like a wall!With Bitcoin clinging to the upper end of its daily range, the chart offers a mix of bullish afterglow and bearish skepticism. Traders are watching key support and resistance levels as the market teeters on the brink of a breakout or breakdown.
Bitcoin remains in a post-uptrend pause following its recent breakout above $126,000. While the macro trend is bullish, price action is cooling, with two consecutive indecisive candlesticks suggesting momentum may be fading.
A pullback to the $122,000–$121,000 range could offer an attractive long-term setup—assuming bulls emerge with volume. Resistance still lurks around $126,000–$127,000, and without a strong catalyst, upside is likely to be limited in the short term. For now, this looks like a market taking a breather.
If you're following the trend, bulls still have the upper hand. Every major moving average, from the 10-day to the 200-day, is firmly in buy mode, and price action is consolidating above key support levels—not breaking down below them. A rebound from the $124,000 area could trigger another push towards $126,000 or higher, especially if volume picks up again. For now, this pullback is a breather, not a breakdown. I still believe $120,000 is a key level!!! A decisive break below $120,000 could open a trap door to $110,000—or even lower.
