BTCUSDT - 1
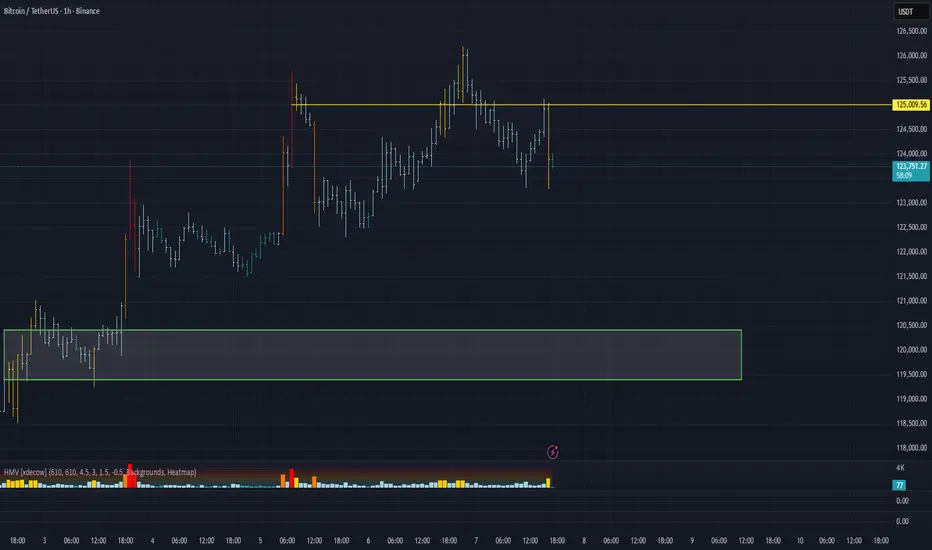
This chart reflects BTCUSDT price action on a short-term timeframe. The current price sits at 122,394.39, and based on candlestick structure, support/resistance zones, and trendlines, here are the key insights:
🔻 Overall Trend
- Price is moving within a descending channel, marked by a downward trendline from top left to mid-right.
- Selling pressure is evident in the red candles, though bullish reactions near support zones suggest buyer interest.
🟩 Support Zones
- A strong support area is identified between 118,925.65 and 119,624.23.
- Increased trading volume in this zone may indicate accumulation and potential reversal.
🟥 Resistance Zones
- First resistance lies between 123,800 and 124,500.
- A breakout above this level could pave the way toward 125,200.
📈 Possible Scenarios
1. Bullish Case: If price stabilizes above the descending trendline and breaks through 124,000, a rally toward 125,200 is likely.
2. Bearish Case: If support at 119,600 fails, price may drop further toward 118,800.
📌 Summary
USDT is currently at a critical juncture. Its reaction to the lower support zone and behavior around the descending trendline will determine the next move. Traders are advised to monitor volume and price action closely, and apply proper risk management.
USTBTC trade ideas

DXY, EUR/USD, GBP/USD, and Bitcoin Daily Analysis for 09/10/2025Today episode i have simplify the next day bias and what to look out for in price. well explained and with high accuracy

[SeoVereign] BITCOIN BEARISH Outlook – October 13, 2025As of October 13th, I would like to share my bearish outlook on Bitcoin.
The first basis is the Shark pattern within the 1.13–1.414 range.
The Shark pattern, established by Scott Carney, is a modified harmonic pattern that defines its PRZ (Potential Reversal Zone) within the 1.13–1.414 XA extension range.
This zone represents a region where the buying momentum tends to be exhausted after excessive price expansion,
and it is typically interpreted as an area where strong reversal pressure tends to emerge.
Currently, Bitcoin has entered this 1.13–1.414 range and is repeatedly testing the upper resistance zone.
Therefore, I believe the probability of a short-term bearish reversal is gradually increasing.
The second basis is that Wave 5 forms a 0.382 length ratio relative to Waves 0–3.
This is a Fibonacci-based structural relationship often observed in Elliott Wave Theory.
When Wave 5 fails to extend excessively and remains around 0.382 of Waves 0–3,
it typically indicates a phase of exhaustion, followed by a corrective or retracement phase.
Accordingly, I set the average target price around 111,350 USDT.
Depending on the future development of the chart,
I will provide updates on position management and any changes to this idea.
Thank you for reading.

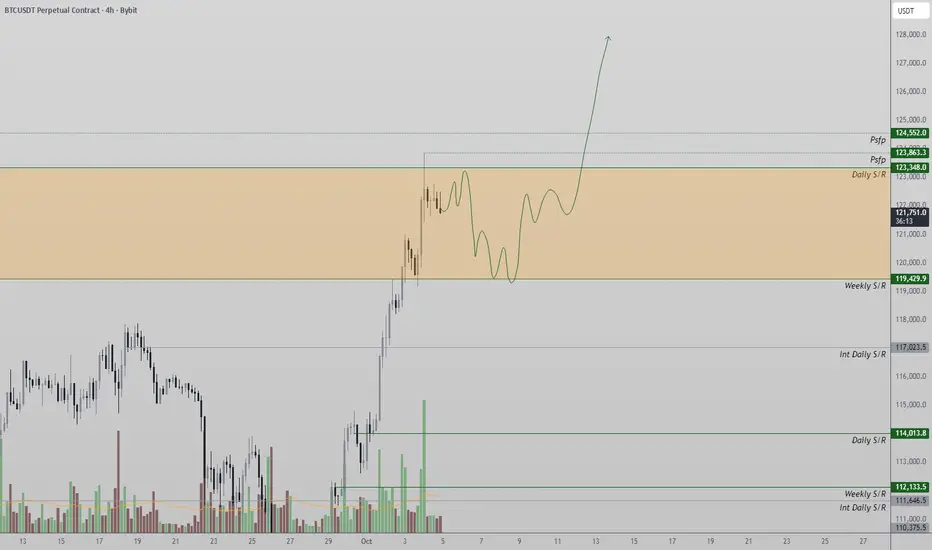
Bitcoin Targets $133,000 as Bulls Defend Channel SupportBitcoin continues to hold firm within its bullish trading channel, defending key support levels around $119,429. With structure intact, a push toward $123,348 and beyond to $133,000 remains on the table.
Bitcoin’s price action has been consolidating within a defined upward channel, maintaining a sequence of higher highs and higher lows that confirm the long-term bullish bias. After multiple successful retests of the channel support, the market has rebounded toward the midline, suggesting renewed bullish intent. Traders are now watching how price behaves between the current $119,429 support and $123,348 resistance to determine the next breakout direction.
Key Technical Points:
- Channel structure remains intact with higher highs and higher lows.
- Support: $119,429 | Resistance: $123,348 short-term, $133,000 channel high.
- A reclaim of $123,348 could trigger a rally into new all-time highs.
Main Analysis:
Bitcoin’s chart remains structurally sound, showing consistent respect for its trend channel. The most recent defense of support around $119,429 reflects renewed demand, with buyers stepping in each time price tests the lower boundaries of the range. This pattern has kept the uptrend intact and positioned BTC for another attempt to break through resistance.
The current focus is on the $123,348 resistance zone. A decisive reclaim above this level would likely lead to a strong impulsive move toward $133,000 — the next key resistance and potential new all-time high. The move would mark a continuation of the bullish market structure that has been developing since the last significant correction.
From a market sentiment perspective, open interest continues to climb, indicating that traders are adding positions alongside price increases. This alignment between rising open interest and bullish price structure signals that the rally is supported by real demand rather than short-term speculation.
However, traders should remain cautious of potential volatility near resistance zones, especially as Bitcoin approaches historical highs. Consolidation within this region would not be unusual, allowing the market to absorb liquidity before expansion.
What to Expect in the Coming Price Action:
Bitcoin remains bullish while trading within its channel. If $123,348 is reclaimed with volume, the next target lies at $133,000 — the channel high and potential new all-time high. If support at $119,429 fails, short-term retracement toward lower channel boundaries may occur before another attempt higher.
BTC – Bearish Setup Developing on 4H#Bitcoin is showing good volume, but on the 4H timeframe, price action is forming a harmonic pattern along with a clear bearish divergence on the indicators.
These are early signals of potential downside. However, for a strong bearish confirmation, I will wait for a break of the key support level.
On the retest of that broken support, I’ll be looking for a short entry with proper risk management.
Reminder: Always trade with discipline and use proper SL/TP to manage risk.
What do you think?
Will #BTC respect this harmonic pattern or surprise us with another bullish push?
Share your thoughts in the comments & don’t forget to follow for more real-time setups and trade ideas.
#BTC #Bitcoin #Crypto #CryptoTrading #CryptoAnalysis #BTCUSD #HarmonicPattern #BearishDivergence #PriceAction #TradingSetup #CryptoCommunity


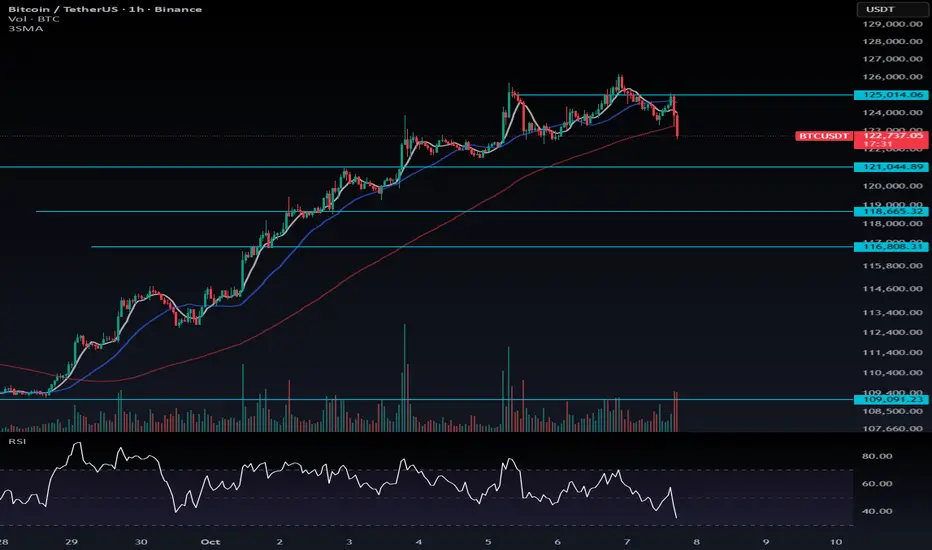
Bitcoin Correction Outlook: Healthy Pullbacks and Key LevelsDon’t fear a Bitcoin correction — embrace it. As I’ve mentioned before, a healthy trend requires both upward moves and corrections. The longer the correction takes to occur, the more powerful and volatile it can be, often accompanied by large candles.
🔹 Key Levels to Watch:
121,000: Maintaining above this level is bullish. Even if BTC dips below and fakes a breakdown, it can still be a positive sign.
Next supports: 118,665 and 116,808.
📈 Trading Note:
Above 125,000, consider long positions.
If BTC Dominance drops during a breakout, shift your focus to altcoins.
For now, observe the market carefully and wait for the right setup — patience is key.
#BTC/USDT Bullish Momentum: Will It Break Through Resistance?
#BTC
The price is moving in a descending channel on the 1-hour frame and is expected to break and continue upward.
We have a trend to stabilize above the 100 moving average once again.
We have a downtrend on the RSI indicator that supports the upward move with a breakout.
We have a major support area in green that pushed the price higher at 109860.
Entry price: 112045.
First target: 113534.
Second target: 115471.
Third target: 117400.
To manage risk, don't forget stop loss and capital management.
When you reach the first target, save some profits and then change your stop order to an entry order.
For inquiries, please comment.
Thank you.

BTCUSDT — Possible Rejection from Channel ResistanceBitcoin is currently testing the upper boundary of the linear regression channel near the $114,500–$115,000 resistance zone.
The Stochastic Oscillator is showing overbought conditions, suggesting a potential short-term pullback.
A rejection from this level could send BTC back toward the midline or lower channel support near $113,000–$112,300.
However, a confirmed breakout above $115,700 would invalidate the bearish bias and open room for continuation higher.
🔹 Timeframe: 15m
🔹 Indicator: Linear Regression Channel, Stochastic (10,3,3)
🔹 Exchange: Binance
#BTCUSDT #Bitcoin #TechnicalAnalysis #Scalping #PriceAction #CryptoTrading

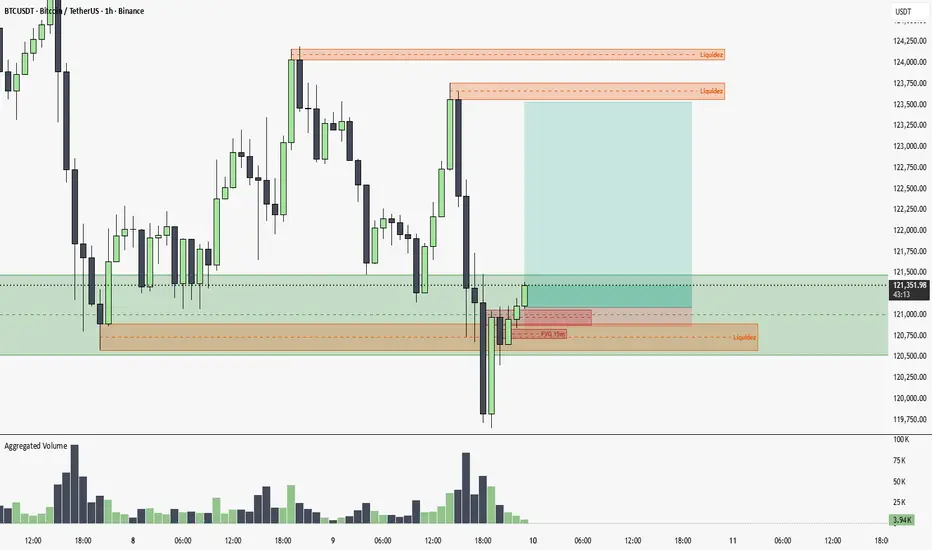
Up until the next liquidity levelThe price has broken through a liquidity level, hunted stops, and bounced back, creating a manipulation. As a target, we have the next liquidity level, and if it breaks that, the PO3 level.
Hello everyoneI came back! :3
I will make new analysis and will generate new analysis for you.
but don't forget the warnings!
BTC/USDT Analysis. Correction Likely
Hello everyone! This is CryptoRobotics trader-analyst with the daily market analysis.
Yesterday, Bitcoin followed our scenario, but with a slight deviation: we tested $125,000 (cluster anomalies) and retested the ATH, after which a correction followed.
At the moment, we have retested this level and received a fairly strong reaction. We expect a correction with targets at $120,000 and $116,000, or, if selling pressure is insufficient, the development of a prolonged sideways movement to accumulate liquidity for the next upward move.
Buy Zones:
$120,400–$119,400 (sales absorption)
$116,700–$115,000 (pushing volumes, strong graphical imbalance)
$112,500–$111,500 (mirror zone, volume anomalies)
$110,000–$108,800 (strong sales absorption)
This publication is not financial advice.
Bitcoin BTC Bullish Setup📈 CRYPTO:BTCUSD reached the equal legs area $118588 - $117260 and it's expected to rally from there looking for new highs next week or bounce in 3 waves at least.
#Elliottwave #Trading

BTC Lower highs - nose diving soonWe've seen this movie too many times. Lower highs, then crossing 50SMA / 200SMA down. We are an inch away from this happening. Never get sensitive about any of this! Follow the trend, technicals, and understand the f&ckery that is taking place. Every single time it drops, esp. when many of the people in crypto are just profit takers. Again, diminishing YoY returns, doesn't solve any real problems, high transaction cost, and still can't buy a banana with it. CBOE:MSTZ CBOE:UVIX are nice hedges and prob the only thing going up in a down market.
Best of luck and always do your DD!

Recovering…Considering the counting of waves and examining the micro-waves in the fractal system, we conclude that the price will retrace itself to the green box.
This is just my personal opinion, please do not use it as a criterion for your trading.

RSI Bullish Divergence on Bitcoin, Upward Move Likely to ComeAfter a strong retracement on HTF, Bitcoin has shown Bullish Divergence on RSI on 1H timeframe.
This is a buy opportunity. Let's try to take a 1:1 Buy-Stop trade here. Just don't take leverage. This is a low-risk trade. Let's see how it goes.

[SeoVereign] BITCOIN BEARISH Outlook – October 05, 2025Hello everyone.
I hope you are all having a peaceful day.
Today, I am writing to share my Bitcoin short position view as of October 5th.
The first basis is the 1.902 CRAB pattern. In a traditional Crab pattern, the 1.618 extension of the XA leg is regarded as the main PRZ (Potential Reversal Zone), but in practice, it is often observed that additional extension values such as 1.902XA are formed. This zone is an area where the price, after an excessive extension, tends to reverse sharply, and it is one of the regions within harmonic patterns where strong volatility and reversal signals frequently appear. Currently, Bitcoin is encountering resistance around this 1.902XA level, which increases the probability of a short-term bearish reversal.
The second basis is that wave N and wave M are forming a 1:1 length ratio. In other words, both waves are proceeding with equal length, which resembles the AB=CD structure—a fundamental form of harmonic patterns. Such wave symmetry indicates that the market is moving in a consistent rhythm, and when two waves complete with the same length, that point often acts as a reversal signal.
Accordingly, the average target price is set around 119,168 USDT.
As the chart continues to develop, I will provide updates to this idea to inform you about my position management.
Thank you for reading.

BTC - DAILY UPDATE#BITCOIN - Daily update 🟠 (Oct 8, 2025)
Spotted a clean bear div yesterday → pullback into 121k–120k; 118.5k possible.
Daily/weekly still constructive; no clear reversal. 📈
H1: neutral, triangle in play.
🎯Levels
Resistances:
122,800 • 123,300 • 125,000 • 125,900 💥
Supports:
121,000–120,000 • 118,500 • 115,800 🛡
Scenarios:
🟩 H1 break and close above 122,800 → room toward prior ATH.
🟨 Triangle break down or rejection near 123,000 → retest ~119,000 - 199,500 before any attempt higher.
#Alts market : will likely stay green while holds above ~115,500.

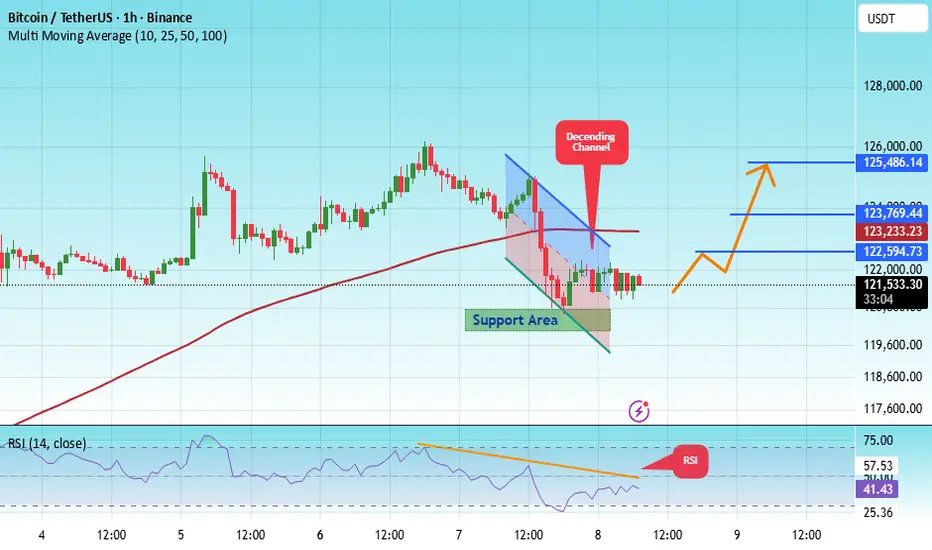
#BTC/USDT bounce from Support, Bullish Momentum Intact#BTC
The price is moving within a descending channel on the 1-hour frame, adhering well to it, and is heading for a strong breakout and retest.
We have a bearish trend on the RSI indicator that is about to be broken and retested, which supports the upward breakout.
There is a major support area in green at 120,500, which represents a strong support point.
We are heading for consolidation above the 100 moving average.
Entry price: 121,666.
First target: 122,600.
Second target: 123,770.
Third target: 125,480.
Don't forget a simple matter: capital management.
When you reach the first target, save some money and then change your stop-loss order to an entry order.
For inquiries, please leave a comment.
Thank you.
Bitcoin (BTC/USD) - Bullish Breakout Alert : Targeting $130k ?🚀 Bitcoin (BTC/USD) - Bullish Breakout Alert: Targeting $130K+ in October 2025! 🚀
Hello Traders! In today's chart, I’ve analyzed Bitcoin’s recent movements. As of October 8, 2025, BTC is trading above $123,500, showing an 8.6% surge last week. Following September’s 5.35% gain, the market is in a bullish mood, aligning with the historical "Pumptober" trend.
What to Watch on the Chart:
Double Bottom Pattern: Two troughs formed near $113,000, signaling a bullish reversal. The neckline resistance at $117,300 has been broken, with the next target at $122,000-$125,000.
Symmetrical Triangle Breakout: A breakout from a two-month descending channel has occurred, indicating a sharp upside move, potentially up to $138,000.
Moving Averages: Both the 50-day MA ($118K) and 200-day MA ($115K) are rising, providing strong support. RSI at 65 is in the bullish zone but not overbought.
Volume Trend: ETF inflows ($175M+ last month) and increasing institutional buying volume suggest sustainability, potentially pushing BTC to $130K-$135K.
Prediction: If $124K holds, the target by the end of October is $131,500 (6-8% upside). Worst case, support at $118K-$120K may be tested. Long-term: $150K+ is possible in 2025 due to ETF and halving effects.
Risk: A US government shutdown or macro volatility could lead to a 5-10% dip. Always DYOR and use stop-loss!
Share your thoughts in the comments – bullish or cautious? Like & share if helpful! 📈 #Bitcoin #BTC #CryptoAnalysis #TradingView

BTC 4 days up...4 hours downBTC volatility is off the rails. Took a bit of nudging to get up to these levels, and few short hours to be at the same spot! Take a closer look at the technicals, seems the drop was very purposeful and aggressive. IMHO there's a lot more TO GIVE here. Meaning, do not be surprised if this crosses 120k, then 110k and even 100k. Everything is super inflated and profit takers will shred BTC to pieces. Ultra signals helped here....
Best of luck

Wait for the correction on BitcoinHi traders,
This time my outlook on Bitcoin last week was great. After it made a new ATH, price went down impulsive (= bearish), made a small correction up and dropped to the previous swing lows. Last week I already said that the move up came out of nowhere.
Now it could go up again. But let's wait for the correction up (bearish) or down (bullish) to take a trade.
Let's see what the market does and react.
Trade idea: Let price make a correction to take a trade bullish or bearish.
If you want to learn more about trading FVG's with wave analysis, please make sure to follow me.
This shared post is only my point of view on what could be the next move in this pair based on my analysis.
Don't be emotional, just trade your plan!
Eduwave

BTC market snapshot$17 billion in long positions were liquidated on BTC within 24 hours. Altcoins have crashed up to 70%, but Bitcoin is holding strong. We’re currently testing support, with a wedge pattern (a reversal formation) and a monthly MACD divergence starting to play out.
If price consolidates below $108K, the next level is in the $78K–80K zone.
In a bearish scenario, the next zone is around $60K.
A close below $105K would significantly increase the probability of a trend reversal.
I’m not taking any long positions.
