USUALUSDT Forming Falling WedgeUSUALUSDT is currently displaying a falling wedge pattern, one of the most reliable bullish reversal signals in technical analysis. The narrowing price action indicates that selling pressure is fading, while buyers are gradually gaining strength. With trading volume remaining healthy, the setup poin
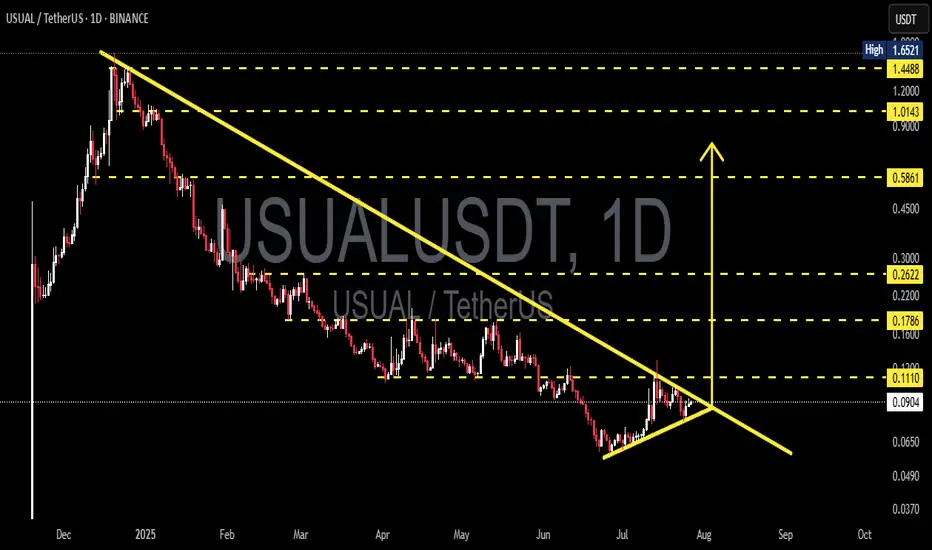
USUAL/USDT — End of Pressure? Breakout or Breakdown Ahead📊 Full Analysis (Daily Chart):
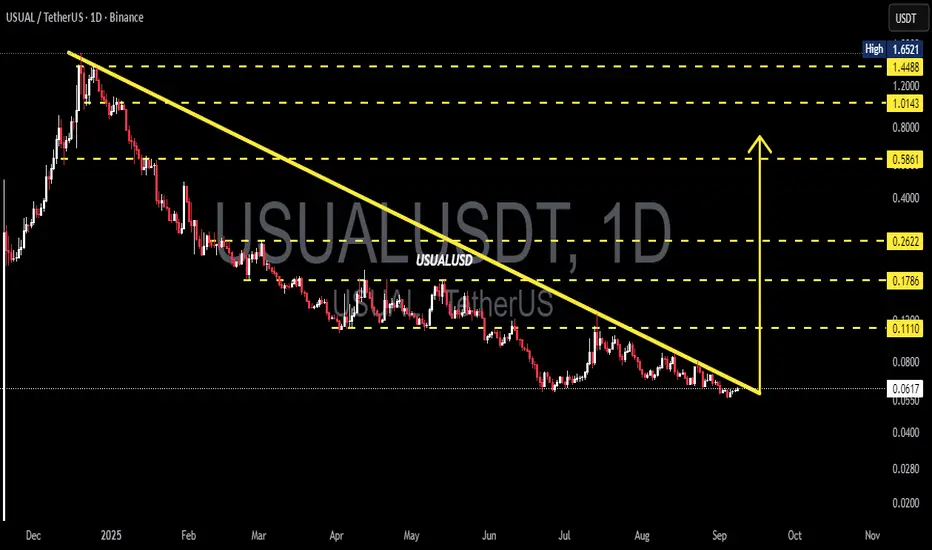
Since peaking around $1.65, USUAL/USDT has remained under heavy selling pressure, forming a clear long-term downtrend with a descending trendline acting as a major resistance. Price is now trading near $0.0614, exactly at the critical $0.05–0.07 support zone.
The stru
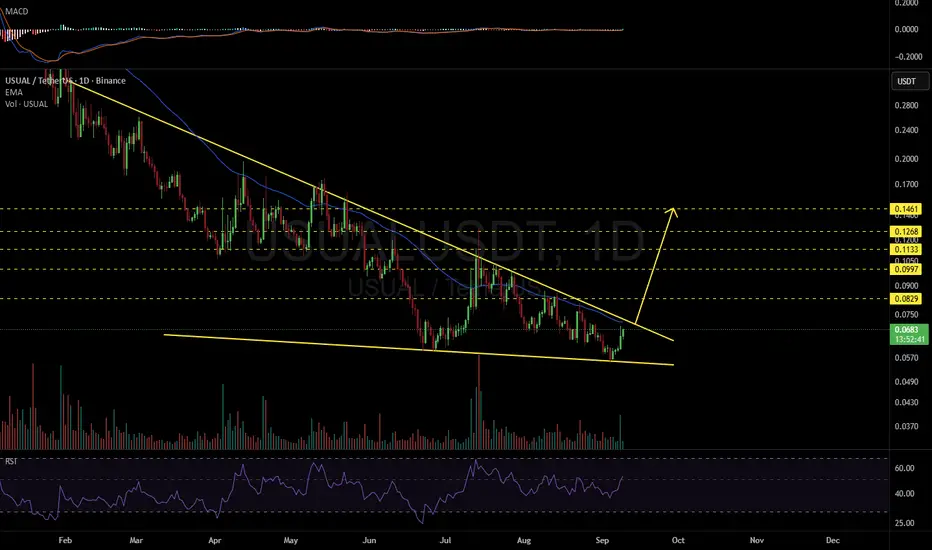
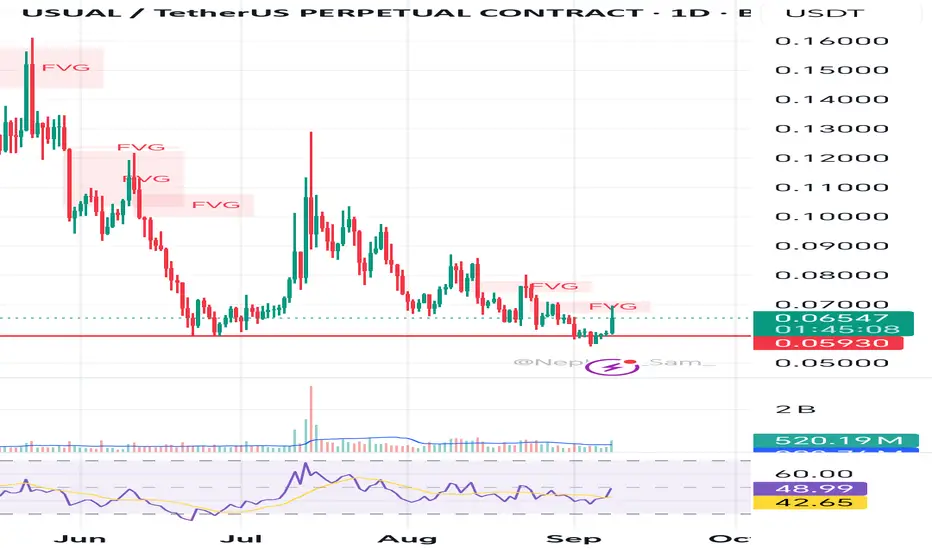
USUALUSDT 1D#USUAL is moving within a falling wedge pattern on the daily chart. If it breaks out above the pattern resistance and the daily EMA50, the potential targets are:
🎯 $0.0829
🎯 $0.0997
🎯 $0.1133
🎯 $0.1268
🎯 $0.1461
⚠️ Always remember to use a tight stop-loss and follow proper risk management.
USUAL · Futures Trading Trade-NumbersAre you going to focus on the short-term or the long-term?
Are you a day-trader or an investor?
How are you approaching this market?
Look at USUALUSDT: In our reality, this is a great opportunity. In our world, this is an awesome chart.
USUAL is trading at bottom prices but with a bullish bias. US
As usual Another counter is readyJust completed liquidity sweep.
If u missed xny, myx, pengu on last month for wave 1 in elliot wave theory.
U should not miss this counter too.
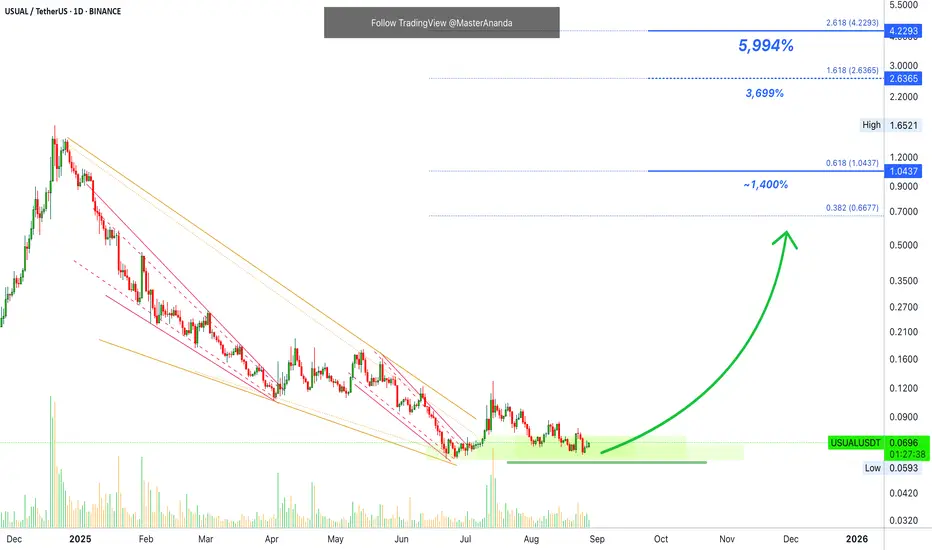
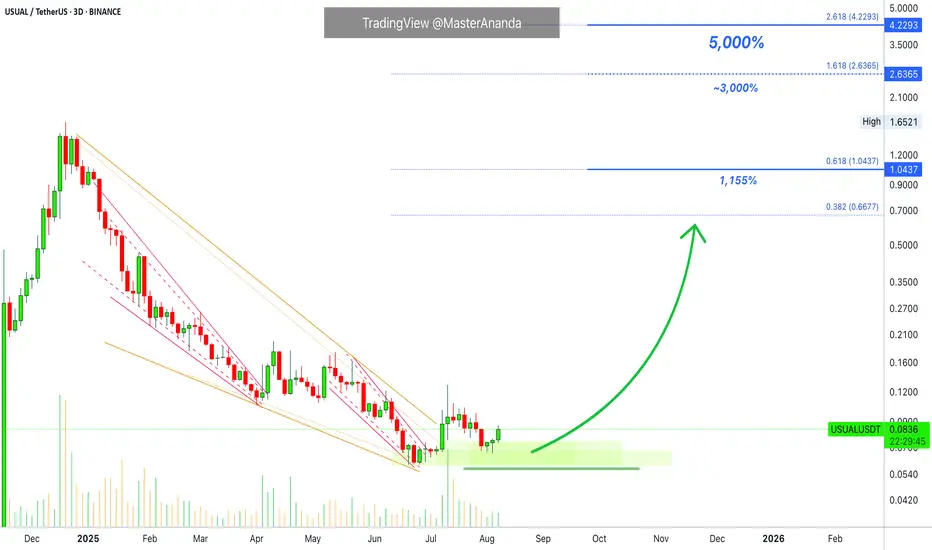
Usual Protocol 5000% Bullish Potential ExposedThe highest volume since December 2024 happened last month, July. This is a high volume bar that signals the bulls are back in the game.
As USUALUSDT was moving lower volume was also dropping. After the bottom was hit, volume did rise but on the buying side. The bearish wave lost its momentum and r
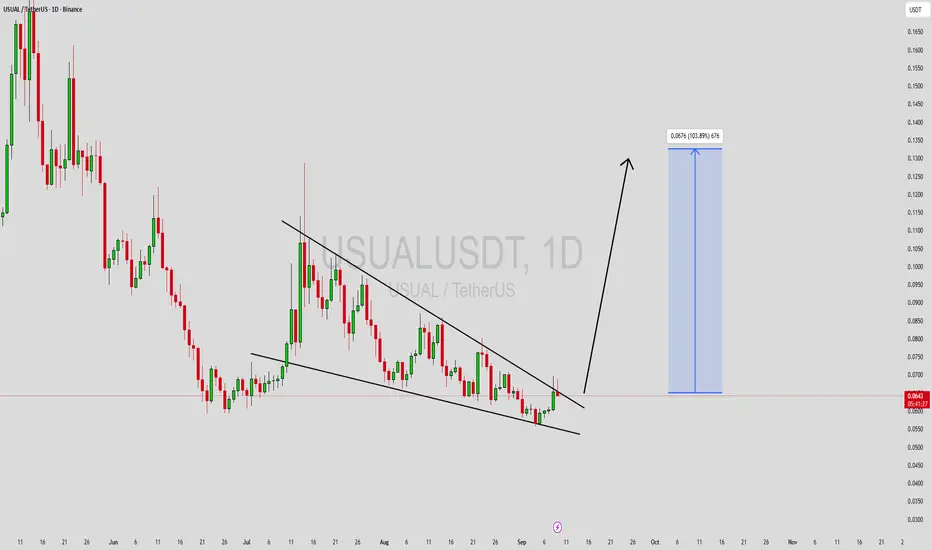
USUALUSDT Ready to Explode? Major Breakout From Downtrend?USUALUSDT is currently displaying a very compelling technical structure on the daily timeframe. After a long downtrend since early 2025, the price is now forming an accumulation pattern with increasing buying pressure.
---
📊 Pattern & Chart Structure Overview:
🔹 Descending Triangle Formation:
The
USUALUSDT-26072025Below writing is a dummy text. Ignore that and see the video only.
===============================
Lorem Ipsum is simply dummy text of the printing and typesetting industry. Lorem Ipsum has been the industry's standard dummy text ever since the 1500s, when an unknown printer took a galley of type a

USUALUSDT 8H#USUAL has formed a Cup and Handle pattern on the 8H timeframe. It is currently facing the Handle resistance and the SMA200. In case of a breakout above these levels, the short-term targets are:
🎯 $0.1031
🎯 $0.1167
If the price then breaks above the Neckline, which serves as the main resistance zo

Usual 1,122% Target Mapped · Can Go Higher Late 2025Usual grew 700% in one month, between November and December 2024. Then the market went on to produce a major lower low bottom and now everything is changing. I am sharing this one again because I believe it will produce a massive bullish wave.
Good evening my fellow Cryptocurrency trader, how are y

See all ideas
Summarizing what the indicators are suggesting.
Oscillators
Neutral
SellBuy
Strong sellStrong buy
Strong sellSellNeutralBuyStrong buy
Oscillators
Neutral
SellBuy
Strong sellStrong buy
Strong sellSellNeutralBuyStrong buy
Summary
Neutral
SellBuy
Strong sellStrong buy
Strong sellSellNeutralBuyStrong buy
Summary
Neutral
SellBuy
Strong sellStrong buy
Strong sellSellNeutralBuyStrong buy
Summary
Neutral
SellBuy
Strong sellStrong buy
Strong sellSellNeutralBuyStrong buy
Moving Averages
Neutral
SellBuy
Strong sellStrong buy
Strong sellSellNeutralBuyStrong buy
Moving Averages
Neutral
SellBuy
Strong sellStrong buy
Strong sellSellNeutralBuyStrong buy
Displays a symbol's price movements over previous years to identify recurring trends.