Gold Holding Support Before FOMC, Moving HigherComex Gold Futures and GDX, corresponding gold ETF, both took a dive on Tuesday morning. Crude Oil plunged another 14% in early trading creating a need for cash to cover losses. With FOMC rate and economic policy decisions due on Wednesday and ECB on Thursday, volatility is on the rise for the rest of the week. Gold is holding support at $1705 with potential to move higher.
Trade ideas

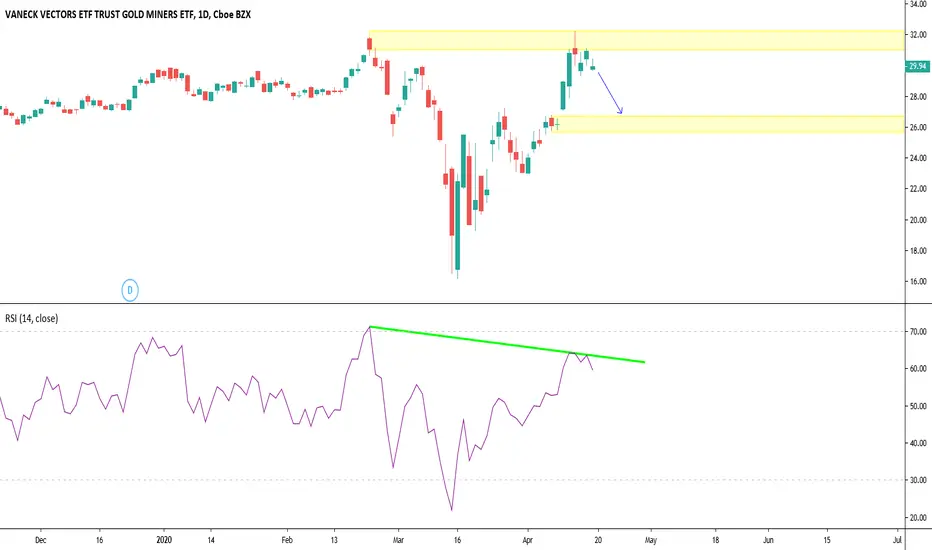
Expect to see sell signal soonGdx overbought in short term. With that being said it can stay overbought for a while longer but it’s likely to hit along with metals in next wave of deflation. As I stated in last idea long term these are going way higher. Keep in mind don’t consider opening a short against this because you don’t know how long it will stay overbought you must wait for sell signal.

I like gold and silver miners long termWith qe infinity, stimulus infinity, money printing, mass debt expansion nothing could be more bullish for Gold and Silver. Which companies benefit for this the miners. Oil is way down which lowers the cost to produce, at the same time we have Gold at making higher with a strong uptrend so these businesses are growing revenue at the same time shrinking business which = bigger net income (bottom line). Demand for Gold and Silver is skyrocketing based on these events which could not be more bullish for miners. The government is never going to be able to stop printing which Gold and Silver will be bullish to infinity. During March the deflationary environment is temporary bearish for miners dropped 50% in a month followed by over 100% gain next month. These miners will get hit pretty hard again but it will be a great buying opportunity for long term. I bought last dip and I’m up over 30% if it goes down again buy more. Overbought on short term charts so I’m bearish in the short term but over next 2-3 years I think the gdx will be over $100

GDX/GOLD Ratio Uptrend Still in TactWhen the GDX/Gold ratio rises, the Gold Miners rise more relative to Gold. Seeing this ratio rise is good to confirm a gold bull market. Gold miners should do well in the coming years.

Highest close in 7 yearsDecent chance to continue higher, the question is when. If next week doesn't fail the breakout, will go higher


$GDX may find some resistance short term$GDX testing UTL resistance along with a few other miners. Confirmation with break of LTL.

GDX is a no brainerThis is just an obvious buy to be on this big breakout this week. I have been holding $NEM and $GOLD for a few weeks and they have already gone up 25% in price, while GDX has just really broken out on the whole. As the FED pumps the stock market the fundamentals of these mining companies are hard to beat.

GDX rocket to propel as long 31.65 is heldGDX rocket to propel as long 31.65 is held and looking for a target 45 within few months.. But GDX may test 31.65 line if it turn bearish due to any ... if u get that buy around 31.75 to 32.5 with strict stop loss of 2% since this is highly volatile and ride it till 45 with patience.
If u are already long keep stop loss at 2% below 31.65 around 31 and ride till 45..


GDX Breaks out from a 7 Year ResistanceGDX breaks out from a 7 year Resistance and looks to head higher to 55 in the next year. Fueled by rising gold prices and low oil prices.

GDX - breakout!Finally, miners confirming next move up in gold. 7 year highs. NEM broke out two weeks ago and now the index. This should be fun!

GOLD Miners BreakoutGold miners is coming out a long long long consolidation and finally broke out of it. With all the money being pumped into the economy, investors are starting to look for scarce assests.

Elliott Wave View: GDX Extends Higher to 7 Year HighElliott Wave view in Gold Miners ETF (GDX) suggests the rally from March 16, 2020 low is unfolding as a 5 waves impulsive structure. Up from March 16 low, wave (1) ended at 27.21 and pullback in wave (2) ended at 23. The ETF then extends higher in wave (3) towards 32.27 and wave (4) pullback ended at 29.37. The 45 minutes chart below shows the internal of wave (3) which unfolded as another impulse of lesser degree.
Wave (4) correction ended as a triangle. Wave A ended at 29.37, wave B at 31.12, wave C at 29.45, wave D at 31.13, and wave E of (4) ended at 29.45. The instrument then extends higher again in wave (5) with potential to end at 32.61 – 33.87 (blue box). This move will also complete wave ((1)) and thus ends cycle from March 16, 2020 low. Afterwards, the instrument can see larger pullback within wave ((2)) to correct cycle from March 16, 2020 low in 3, 7, or 11 swing before turning higher again.
We don’t like selling the instrument and GDX can always extend higher as the structure is in 5 waves. Furthermore, the sequence from January 2016 low appears incomplete with 100% – 123.6% Fibonacci target towards 36 – 40.6.

Gold miners ETF 30min chartconsolidating nicely, breaking out of one wedge, and now holding strong. a break of 31 should give way for a quick move to 32 retesting the multiyear resistance above. $GDX $NUGT $GLD


Gold Miner ETF at Long-Term Resistance as Optimism SpreadsGold and gold miners have been some of the go-to names in these days of coronavirus and cratering GDP growth.
The Market Vectors Gold Miner ETF has rallied sharply in the last month as investors look for firehoses of liquidity to boost precious metals. But that’s placed it at risk of conditions improving. What if the crisis starts to lift? What happens to gold if investors rotate back to cyclical parts of the market like banks and industrials?
The price chart may be reflecting those possibilities because GDX has been unable to close above $31. (This has been a key resistance area since running back to April 2013.) This week had another failure at that level – despite physical gold inching to a new high.
The resistance around $31 is now a potential risk-management level. GDX also has liquid options, creating the potential for income traders to sell credit spreads.
Overall, a lot of bullish news is priced into GDX at this level. But that also creates downside risk in price if conditions improve on Main Street.


GDX wave 4 is in progress need to be retrace 30.8 and then fall GDX wave 4 is in progress need to be retrace 30.8 to 31.5 and then fall towards 27.7
The B wave of Wave 4 is in progress and expected to retrace 50% or 61.8 or 75% (Between 29.88 to 32.22)
If 27.7 does not hold please close your long as we can expect more sharper large drop
