DAX CRUSHING IT BUY NOWthis is my humble set up for Dax INDEX for the next week ; the overall sentimebt is bullish , so keep your positions tight ; it's time to make some extra money this week
Trade ideas

DAX CALL FOR BUYGermany is showing a strong resistence with a solid economy and industry , making this year a year of resistence and potetil loss , but the comeback is hard ; take you position once the price get out of the zone where buyer are waiting

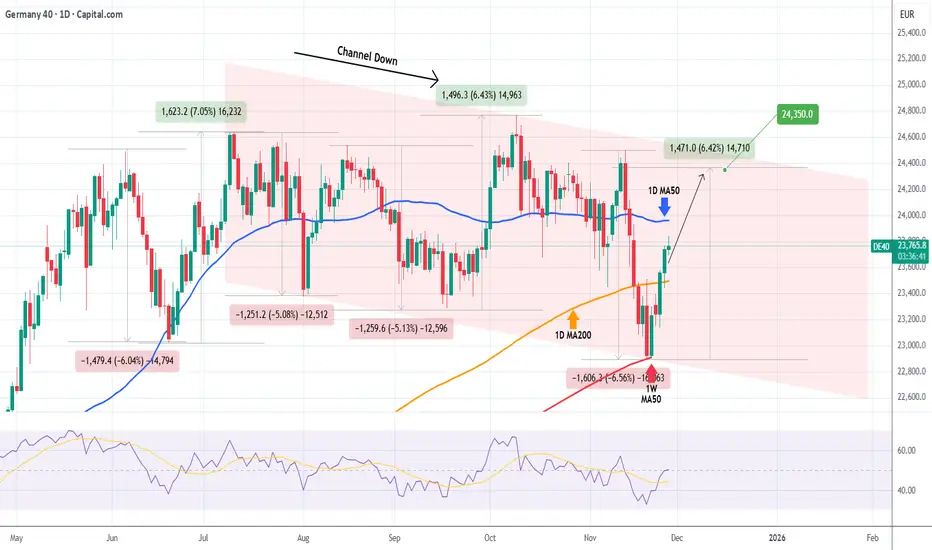
DAX This rally isn't over yet.DAX (DE40) has started a strong rebound following the 1W MA50 (red trend-line) test, as we showed last week. This week the price broke again above its 1D MA200 (orange trend-line) and is about to recover its 1D MA50 (blue trend-line) as well.
The latter has never posed as a Resistance in 2025, so we expect the price to break and continue above it without problems. However, given that the prevailing pattern right now is a Channel Down, the uptrend is limited to its top (Lower Highs trend-line).
With the previous Bullish Leg making a +6.43% rise, we expect a symmetric rise this time around to, thus targeting 24350 short-term.
---
** Please LIKE 👍, FOLLOW ✅, SHARE 🙌 and COMMENT ✍ if you enjoy this idea! Also share your ideas and charts in the comments section below! This is best way to keep it relevant, support us, keep the content here free and allow the idea to reach as many people as possible. **
---
💸💸💸💸💸💸
👇 👇 👇 👇 👇 👇
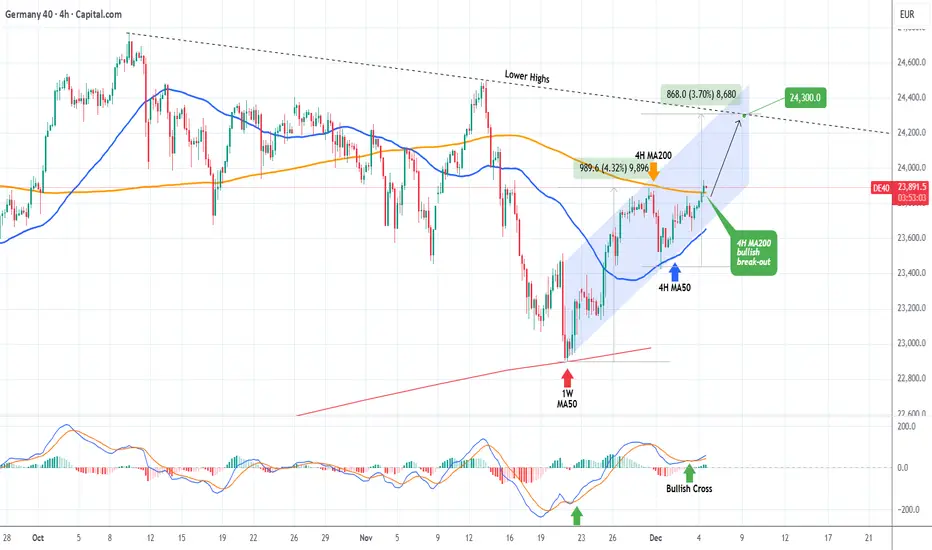
DAX Strong 4H break-out targeting 24300.DAX (DE40) has been trading within a Channel Up since the November 20 bottom on the 1W MA50 (red trend-line) and today it made a massive step upwards as it broke above its 4H MA200 (orange trend-line) for the first time in 3 weeks.
With the 4H MA50 (blue trend-line) established as the Support on the previous Higher Low, we expect this Bullish Leg to hit at least the 2-month Lower Highs trend-line at 24300.
---
** Please LIKE 👍, FOLLOW ✅, SHARE 🙌 and COMMENT ✍ if you enjoy this idea! Also share your ideas and charts in the comments section below! This is best way to keep it relevant, support us, keep the content here free and allow the idea to reach as many people as possible. **
---
💸💸💸💸💸💸
👇 👇 👇 👇 👇 👇
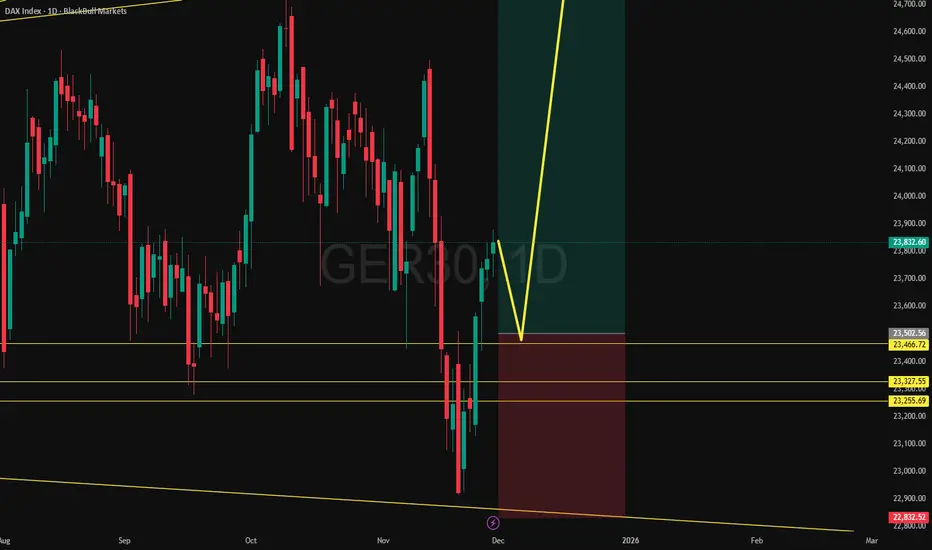
DAX Expanding Wedge Long Setup — Bottom Retest + False BreakDAX is trading inside a broadening/expanding wedge within a larger uptrend. Price has recently swept the lower boundary and faked below a short-term trendline, showing signs of a downside trap.
GER40 Trade Idea: The Perfect Pullback Before Liftoff!I enjoy trading GER40, especially during the London session, where we consistently see a phase of manipulation followed by a clean move toward the target. At the moment, the structure is showing a similar pattern.
Although the HTF suggests a broader correction toward the 22,000 area, I’m looking for a short-term setup for next week.
My scenarios:
1) Primary scenario:
A move lower into the first Daily FVG, which is also visible on the 4H and 1H timeframes—confirming its validity. After a test of this zone and a liquidity grab around the 23,700 area, I expect price to move upward toward the 0.70–0.79 Fibonacci retracement, where I will look to take profit.
2) Alternative scenario (less likely):
A deeper correction into the second Daily FVG, which is only visible on the Daily timeframe. Due to its limited confluence, this scenario has lower probability.
Execution plan:
I’ll wait for price to trade into one of these FVGs, then look for LTF reversal signals to execute a long position targeting the 0.70–0.79 Fibonacci zone.
If you enjoy this type of analysis, make sure to follow and like this idea.

DAX breakout supported at 23446The DAX remains in a bullish trend, with recent price action showing signs of a breakout within the broader uptrend.
Support Zone: 23446 – a key level from previous consolidation. Price is currently testing or approaching this level.
A bullish rebound from 23446 would confirm ongoing upside momentum, with potential targets at:
23950 – initial resistance
24140 – psychological and structural level
24380 – extended resistance on the longer-term chart
Bearish Scenario:
A confirmed break and daily close below 23446 would weaken the bullish outlook and suggest deeper downside risk toward:
23350 – minor support
23200 – stronger support and potential demand zone
Outlook:
Bullish bias remains intact while the DAX holds above 23446. A sustained break below this level could shift momentum to the downside in the short term.
This communication is for informational purposes only and should not be viewed as any form of recommendation as to a particular course of action or as investment advice. It is not intended as an offer or solicitation for the purchase or sale of any financial instrument or as an official confirmation of any transaction. Opinions, estimates and assumptions expressed herein are made as of the date of this communication and are subject to change without notice. This communication has been prepared based upon information, including market prices, data and other information, believed to be reliable; however, Trade Nation does not warrant its completeness or accuracy. All market prices and market data contained in or attached to this communication are indicative and subject to change without notice.

$DAX Move HigherDAX broke below the trendline on a false breakdown, before a close above the trendline, a re-test and hold. Looking for a move back to the above trendline at 24280 or so.

GER SELLLow probability high risk sells. Risk reasonably. Price is coming from an Imbalance after sweeping liq so sells is low probability for now.

Bullish bounce off?DAX40 has bounced off the pivot, which is a pullback support, and could rise to the 1st resistance, which acts as a pullback resistance.
Pivot: 23,488.29
1st Support: 23,293.56
1st Resistance: 23,956.58
Disclaimer:
The opinions given above constitute general market commentary and do not constitute the opinion or advice of IC Markets or any form of personal or investment advice.
Any opinions, news, research, analyses, prices, other information, or links to third-party sites contained on this website are provided on an "as-is" basis, are intended to be informative only, and are not advice, a recommendation, research, a record of our trading prices, an offer of, or solicitation for, a transaction in any financial instrument and thus should not be treated as such. The information provided does not involve any specific investment objectives, financial situation, or needs of any specific person who may receive it. Please be aware that past performance is not a reliable indicator of future performance and/or results. Past performance or forward-looking scenarios based upon the reasonable beliefs of the third-party provider are not a guarantee of future performance. Actual results may differ materially from those anticipated in forward-looking or past performance statements. IC Markets makes no representation or warranty and assumes no liability as to the accuracy or completeness of the information provided, nor any loss arising from any investment based on a recommendation, forecast, or any information supplied by any third party.

DAX SELL 4HChart Analysis (DAX Index – 4H)
1. General Trend Context
The chart shows the DAX in a broad corrective structure, moving under a large descending curve (red dashed arc) indicating a medium-term bearish bias.
Price has recently rebounded from the lower support area, but it is still trading below major resistance zones.
2. Key Technical Zones
🔴 Resistance Areas
24,150 – 24,500
Strong resistance cluster made of Fibonacci levels and historical supply.
Also includes the stop zone for the planned short position.
24,825 region
Major swing high and top of the corrective arc.
Bears are expected to dominate here.
🟢 Support Areas
23,400 – 23,000
Important horizontal support (0.5 Fibonacci retracement).
First potential target for bearish movement.
22,300 – 22,000
Strong support zone aligned with deeper Fibonacci levels and historical demand.
21,250 – 21,150
Major long-term support zone.
The projected final bearish target (green target box).
3. Projected Price Path
🟠 Bearish Scenario (Main)
This is the main scenario illustrated by the orange/red movement:
Price rises slightly to the 24,300–24,450 area →
A short entry is triggered with stop at 24,790 →
A strong downward leg begins, targeting:
23,400
22,800
Final target around 21,250 (≈ -11.7%)
This aligns with the long-term descending curve and Fibonacci projections.
4. Alternative Scenario (Bullish Reversal)
🔵 Bullish Path
If the market reaches the 21,250 major support zone, a strong rebound is expected.
This is drawn as the blue arrow.
The bullish move could develop into a trend reversal, potentially pushing back toward:
22,800
23,800
and even higher if momentum strengthens.
5. Trade Setup Displayed
Short Position
Entry: ~24,150
Stop: 24,790
Take-Profit: 21,250
Risk/Reward ≈ 8.27 (very favorable)
This setup is based on hitting a strong resistance zone followed by a long corrective decline.
6. Momentum Indicators
The histogram at the bottom (Awesome Oscillator) shows recent weakening, supporting the bearish continuation scenario.

Dax don't take this trade the previous level was respected as assumed ; so this is the real set up i'm taking , the overall sentiment is bullish .... BUY nOW

Bullish rise?GER30 is falling towards the support level, which is a pullback support that aligns with the 23.6% Fibonacci retracement and could bounce from this level to our take profit.
Entry: 23,644.94
Why we like it:
There is pullback support at the 23.6% Fibonacci retracement.
Stop loss: 23,351
Why we like it:
There is a pullback support that aligns with the 50% Fibonacci retracement.
Take profit: 24,369.29
Why we like it:
There is a pullback resistance level.
Enjoying your TradingView experience? Review us!
Please be advised that the information presented on TradingView is provided to Vantage (‘Vantage Global Limited’, ‘we’) by a third-party provider (‘Everest Fortune Group’). Please be reminded that you are solely responsible for the trading decisions on your account. There is a very high degree of risk involved in trading. Any information and/or content is intended entirely for research, educational and informational purposes only and does not constitute investment or consultation advice or investment strategy. The information is not tailored to the investment needs of any specific person and therefore does not involve a consideration of any of the investment objectives, financial situation or needs of any viewer that may receive it. Kindly also note that past performance is not a reliable indicator of future results. Actual results may differ materially from those anticipated in forward-looking or past performance statements. We assume no liability as to the accuracy or completeness of any of the information and/or content provided herein and the Company cannot be held responsible for any omission, mistake nor for any loss or damage including without limitation to any loss of profit which may arise from reliance on any information supplied by Everest Fortune Group.

Ger30We can see that price has restest the previous demand zone to be strong level of support, and more bullish momentumm still expected till the supply formed.

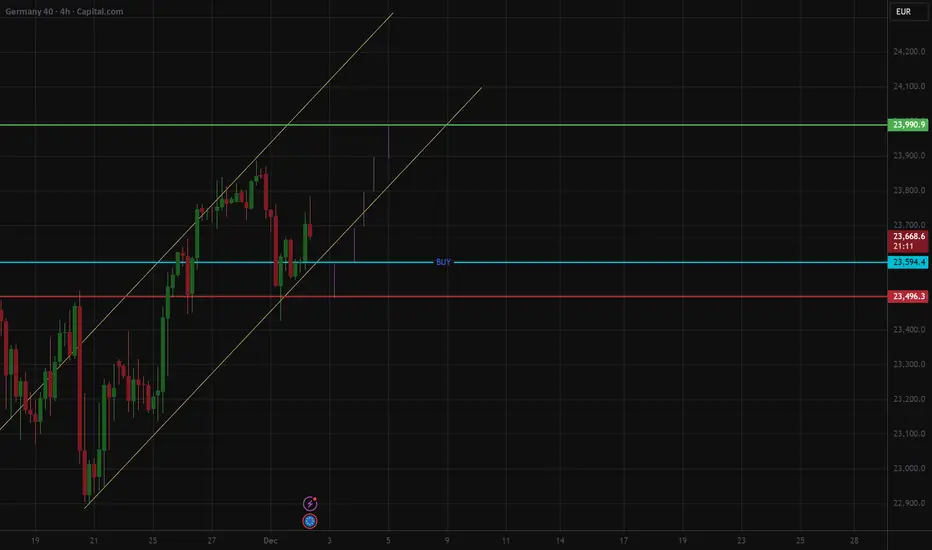
Long order DAX on pullback RR1:4 DAX in a bull channel on the 4 H chart. The order is at the "BUY" line, and the risk is 100 points in the dax, with a target of 400 points. As always with the larger swing trades, be prepared to buy MORE if the trade is working in your favor and let it hit your stop loss if it doesn't.
GER30 H4 | Bullish Bounce Off key SupportMomentum: Bearish
Price is currently falling toward the buy entry, which acts as an overlap support level.
Buy Entry: 89,034.03
Overlap support
Stop Loss: 81,966.16
Pullback support
Take Profit: 104,866.08
Overlap resistance
Slightly above the 61.8% Fibonacci retracement
High Risk Investment Warning
Stratos Markets Limited (tradu.com ), Stratos Europe Ltd (tradu.com ):
CFDs are complex instruments and come with a high risk of losing money rapidly due to leverage. 70% of retail investor accounts lose money when trading CFDs with this provider. You should consider whether you understand how CFDs work and whether you can afford to take the high risk of losing your money.
Stratos Global LLC (tradu.com ): Losses can exceed deposits.
Please be advised that the information presented on TradingView is provided to Tradu (‘Company’, ‘we’) by a third-party provider (‘TFA Global Pte Ltd’). Please be reminded that you are solely responsible for the trading decisions on your account. Any information and/or content is intended entirely for research, educational and informational purposes only and does not constitute investment or consultation advice or investment strategy. The information is not tailored to the investment needs of any specific person and therefore does not involve a consideration of any of the investment objectives, financial situation or needs of any viewer that may receive it. Past performance is not a reliable indicator of future results. Actual results may differ materially from those anticipated in forward-looking or past performance statements. We assume no liability as to the accuracy or completeness of any of the information and/or content provided herein and the Company cannot be held responsible for any omission, mistake nor for any loss or damage including without limitation to any loss of profit which may arise from reliance on any information supplied by TFA Global Pte Ltd.

GER30 H4 | Potential Bullish RiseMomentum: Bullish
Price has bounced from the buy entry, which is acting as pullback support, and is currently trading above the 50% Fibonacci retracement level.
Buy Entry: 23,688.33
Pullback support
Stop Loss: 23,457.40
Strong overlap support
Take Profit: 24,112.40
Pullback resistance
145% Fibonacci extension
High Risk Investment Warning
Stratos Markets Limited (tradu.com ), Stratos Europe Ltd (tradu.com ):
CFDs are complex instruments and come with a high risk of losing money rapidly due to leverage. 70% of retail investor accounts lose money when trading CFDs with this provider. You should consider whether you understand how CFDs work and whether you can afford to take the high risk of losing your money.
Stratos Global LLC (tradu.com ): Losses can exceed deposits.
Please be advised that the information presented on TradingView is provided to Tradu (‘Company’, ‘we’) by a third-party provider (‘TFA Global Pte Ltd’). Please be reminded that you are solely responsible for the trading decisions on your account. Any information and/or content is intended entirely for research, educational and informational purposes only and does not constitute investment or consultation advice or investment strategy. The information is not tailored to the investment needs of any specific person and therefore does not involve a consideration of any of the investment objectives, financial situation or needs of any viewer that may receive it. Past performance is not a reliable indicator of future results. Actual results may differ materially from those anticipated in forward-looking or past performance statements. We assume no liability as to the accuracy or completeness of any of the information and/or content provided herein and the Company cannot be held responsible for any omission, mistake nor for any loss or damage including without limitation to any loss of profit which may arise from reliance on any information supplied by TFA Global Pte Ltd.

DAX40 support at 23445The DAX remains in a bullish trend, with recent price action showing signs of a breakout within the broader uptrend.
Support Zone: 23446 – a key level from previous consolidation. Price is currently testing or approaching this level.
A bullish rebound from 23446 would confirm ongoing upside momentum, with potential targets at:
23950 – initial resistance
24140 – psychological and structural level
24380 – extended resistance on the longer-term chart
Bearish Scenario:
A confirmed break and daily close below 23446 would weaken the bullish outlook and suggest deeper downside risk toward:
23350 – minor support
23200 – stronger support and potential demand zone
Outlook:
Bullish bias remains intact while the DAX holds above 23446. A sustained break below this level could shift momentum to the downside in the short term.
This communication is for informational purposes only and should not be viewed as any form of recommendation as to a particular course of action or as investment advice. It is not intended as an offer or solicitation for the purchase or sale of any financial instrument or as an official confirmation of any transaction. Opinions, estimates and assumptions expressed herein are made as of the date of this communication and are subject to change without notice. This communication has been prepared based upon information, including market prices, data and other information, believed to be reliable; however, Trade Nation does not warrant its completeness or accuracy. All market prices and market data contained in or attached to this communication are indicative and subject to change without notice.

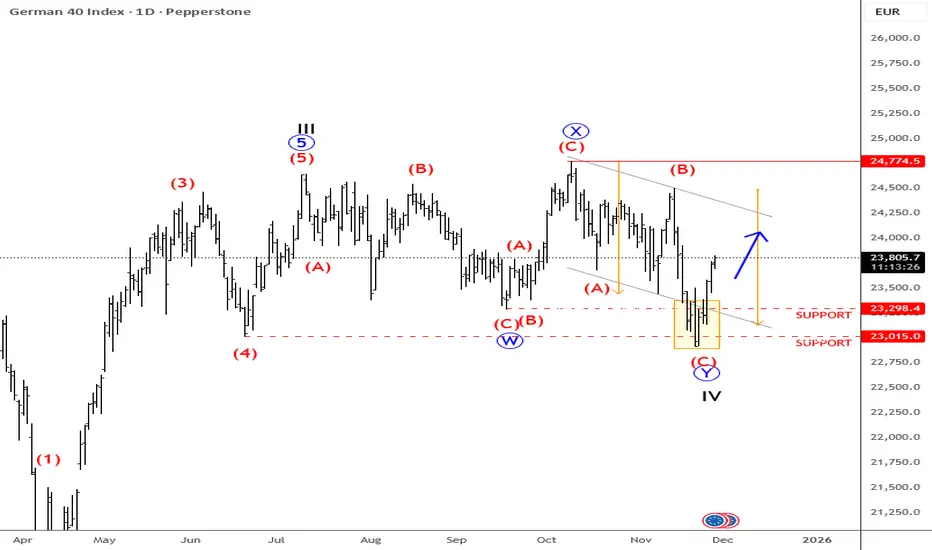
DAX: When Chopy Price Action Calls Next Clear Move German DAX was very non-directional, basically since June of 2025 and what I see is some very nasty moves on both sides of the market, but what got my attention recently is that the price has stopped at key support levels around 23k to 23300 area, from where we can see a very interesting and strong rebound.
What is most important is that this rebound is coming after only three waves down from all-time highs, so it can be part of a WXY complex correction here in a fourth wave. Of course there can be some other labelings as well, but with any approach you will probably come out with the same idea that this whole price action in this five to six month range is corrective, and whenever we see a correction we know that sooner or later it should be fully retraced, meaning the price could already be headed back toward the highs from current levels.
So I think that as long as we hold 23k, there can be some potential opportunities on intraday retracements on smaller time frames.
GH
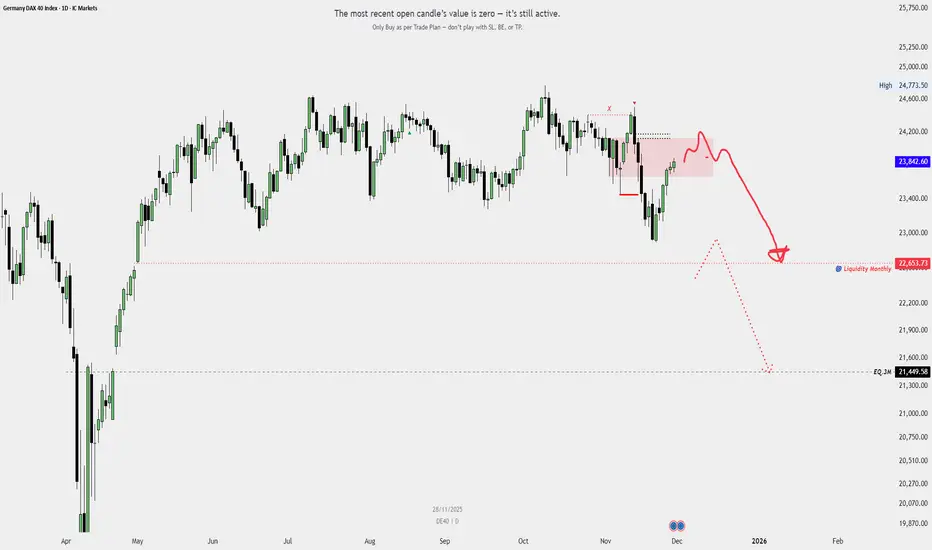
Germany 40 index Dax Swept High,s Running Low,sGermany 40 index Dax Swept High,s Running Low,s
Market structure shifted completely bearish.
once in lower time frame Mss happend i will open short position till Monyjly liqudity,
potential Much Lower.
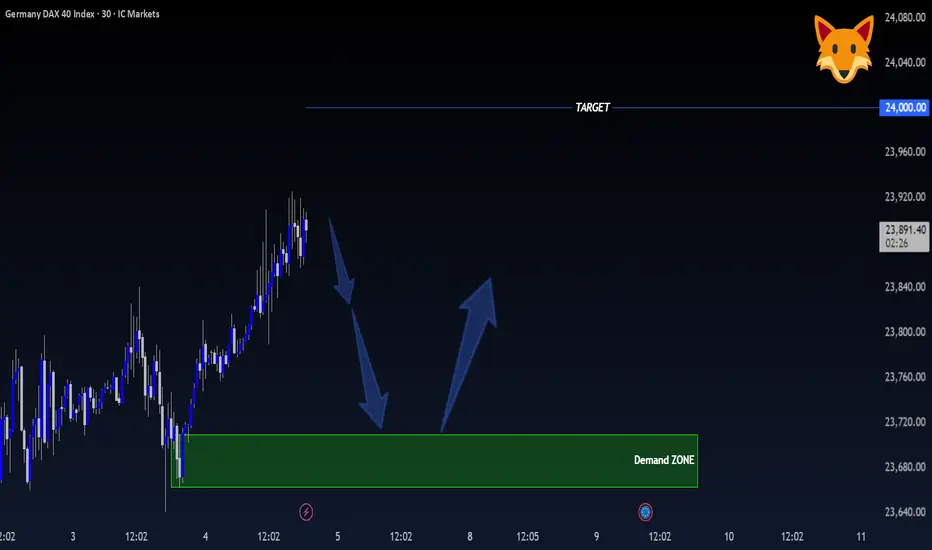
GER40 – 30-Minute Timeframe Tradertilki AnalysisGuys,
I have prepared a GER40 analysis for you.
On the 30-minute timeframe, if GER40 makes a pullback, I will open a buy position between 23,709 - 23,668.
My target will be the 24,000 level.
My friends, I share these analyses thanks to each like I receive from you.
Your likes increase my motivation and encourage me to support you in this way.🙏✨
Thank you to all my friends who support me with their likes.❤️
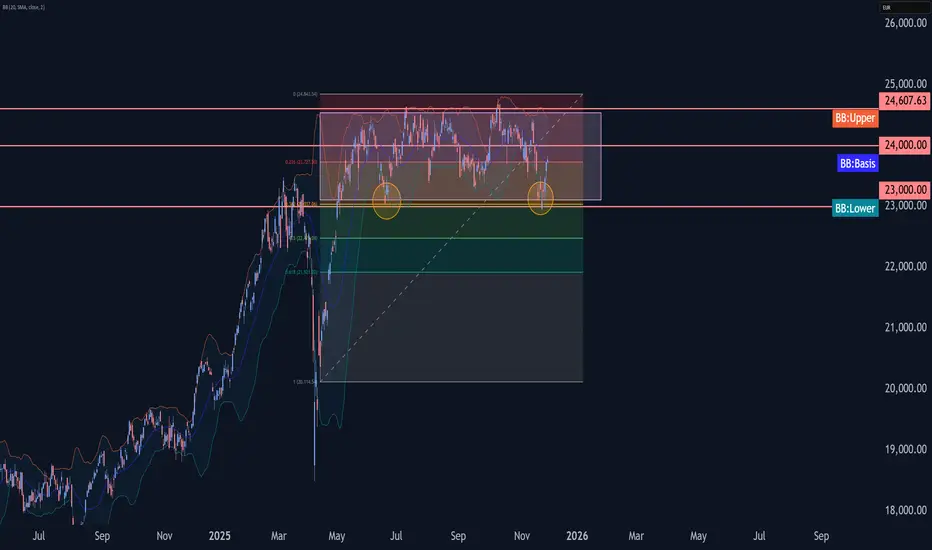
DAX Wave Analysis – 27 November 2025- DAX reversed from support area
- Likely to rise to resistance level 24000.00
DAX index recently reversed from support area between the support level 23000.00 (lower border of the sideways price range inside which the price has been moving from June) and the lower daily Bollinger Band.
The upward reversal from this support area stopped the previous minor impulse wave C of the intermediate ABC correction (4) from July.
Given the clear daily uptrend, DAX index can be expected to rise to the next resistance level 24000.00.
DAX40 key support at 23466The DAX remains in a bullish trend, with recent price action showing signs of a breakout within the broader uptrend.
Support Zone: 23446 – a key level from previous consolidation. Price is currently testing or approaching this level.
A bullish rebound from 23446 would confirm ongoing upside momentum, with potential targets at:
23950 – initial resistance
24140 – psychological and structural level
24380 – extended resistance on the longer-term chart
Bearish Scenario:
A confirmed break and daily close below 23446 would weaken the bullish outlook and suggest deeper downside risk toward:
23350 – minor support
23200 – stronger support and potential demand zone
Outlook:
Bullish bias remains intact while the DAX holds above 23446. A sustained break below this level could shift momentum to the downside in the short term.
This communication is for informational purposes only and should not be viewed as any form of recommendation as to a particular course of action or as investment advice. It is not intended as an offer or solicitation for the purchase or sale of any financial instrument or as an official confirmation of any transaction. Opinions, estimates and assumptions expressed herein are made as of the date of this communication and are subject to change without notice. This communication has been prepared based upon information, including market prices, data and other information, believed to be reliable; however, Trade Nation does not warrant its completeness or accuracy. All market prices and market data contained in or attached to this communication are indicative and subject to change without notice.
