NASDAQ Signal : US 100 H1 / H4 : long !!!Hello Traders! 👋
What are your thoughts on NASDAQ ?
This correction could offer a buy-the-dip opportunity, with potential for a move back toward the recent highs.
NASDAQ ( US100 ) :
Market price : 24400
Buy limit 1 : 24200
buy limit 2 : 24000
Tp1 : 24600
Tp2 : 25000
Tp 3: 25700
Tp 4 : 26300
SL : 23700
Traders, Don’t forget to like and share your thoughts in the comments! ❤️
Remember this is a position that was found by me and it is a personal idea not a financial advice, you are responsible for your loss and gain.
Trade ideas

NASDAQDO YOU KNOW WHATS BEHIND THIS OR OTHER IDEAS?? in bio..
Preferably suitable for scalping and accurate as long as you watch carefully the price action with the drawn areas.
With your likes and comments, you give me enough energy to provide the best analysis on an ongoing basis.
And if you needed any analysis that was not on the page, you can ask me with a comment or a personal message.
Enjoy Trading ;)

Nasdaq NAS100 Analysis: The Conditions I Need Before Going ShortI'm keeping a close eye on NAS100 (Nasdaq) right now. 📉✨ On the 4H timeframe, price remains in a clean, sustained bearish trend, and I'm anticipating a potential continuation lower.
If price rejects the current level and fails to retrace through the 1H imbalance, and we see a rotation followed by a bearish break of structure, I'll be preparing for a short opportunity. 📊🔻
Not financial advice.

NAS100 LONG SETUP These pair previously banged our sl with a temporary breakout of the uptrend channel. Now the price is back on the uptrend, safe entries above 25.217

Next NAS100 TPVolume remains steady, which confirms the reliability of the ongoing trend.
These combined technical factors typically precede price appreciation in the Nasdaq 100 , suggesting the index will likely continue to declineshortly based on trend-following and momentum-based trading strategies with limited immediate overbought risk.

NAS100 H4 | Bearish Reversal Off Key ResistanceMomentum: Bearish
Price is showing rejection from the sell zone, which aligns with the 78.6% Fibonacci retracement level. The market remains below the descending trendline, supporting a bearish continuation bias.
Sell Entry: 24,926.07
Overlap resistance
78.6% Fibonacci confluence
Stop Loss: 25,314.56
Positioned above pullback resistance
Take Profit: 24,447.49
Pullback support zone
High Risk Investment Warning
Stratos Markets Limited (tradu.com ), Stratos Europe Ltd (tradu.com ):
CFDs are complex instruments and come with a high risk of losing money rapidly due to leverage. 70% of retail investor accounts lose money when trading CFDs with this provider. You should consider whether you understand how CFDs work and whether you can afford to take the high risk of losing your money.
Stratos Global LLC (tradu.com ): Losses can exceed deposits.
Please be advised that the information presented on TradingView is provided to Tradu (‘Company’, ‘we’) by a third-party provider (‘TFA Global Pte Ltd’). Please be reminded that you are solely responsible for the trading decisions on your account. Any information and/or content is intended entirely for research, educational and informational purposes only and does not constitute investment or consultation advice or investment strategy. The information is not tailored to the investment needs of any specific person and therefore does not involve a consideration of any of the investment objectives, financial situation or needs of any viewer that may receive it. Past performance is not a reliable indicator of future results. Actual results may differ materially from those anticipated in forward-looking or past performance statements. We assume no liability as to the accuracy or completeness of any of the information and/or content provided herein and the Company cannot be held responsible for any omission, mistake nor for any loss or damage including without limitation to any loss of profit which may arise from reliance on any information supplied by TFA Global Pte Ltd.

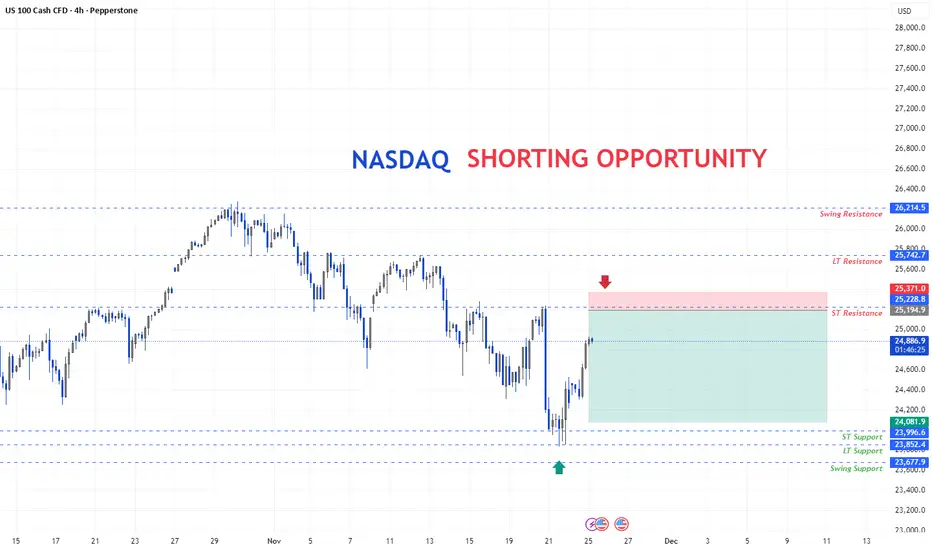
Nasdaq wait for the level for the short entry after market structure broken at the nasdaq, it give a sharp pullback, wait for the entry on the short side at the ST resistance.
Nasdaq 100 Ahead of the HolidaysNasdaq 100 Ahead of the Holidays
As the chart shows, the Nasdaq 100 has rebounded from its roughly 2.5-month low recorded on 21 November. At that point, bearish sentiment was driven by fears of an “AI bubble”, expectations of higher interest rates, and other news-related pressures.
The recovery from that level was strong — in less than a week the index gained around 5.3%, signalling robust demand. This not only offsets last week’s concerns but also injects optimism into the near-term outlook.
Technical Analysis of the Nasdaq 100 Chart
Examining recent price action in the Nasdaq 100, we can outline an ascending channel in which:
→ the median line acted as support until mid-November;
→ support at the lower boundary helped form the 21 November low.
From the perspective of buying pressure:
→ The November dip appears to be an intermediate correction within a broader emerging uptrend.
→ The brief move below the psychological 24k level (where the notable September and October lows lie) resembles a Liquidity Grab pattern, suggesting so-called Smart Money may have used sellers’ liquidity to build long positions — a sign of bullish intent.
From the perspective of selling pressure:
→ the market remains within a corrective structure (highlighted in red);
→ today, the Nasdaq 100 is trading near 25,265, a level that acted as resistance on 17–20 November.
It is possible that trading near the channel’s median line will encourage a balance between buying and selling forces — just as market participants head off to celebrate Thanksgiving.
This article represents the opinion of the Companies operating under the FXOpen brand only. It is not to be construed as an offer, solicitation, or recommendation with respect to products and services provided by the Companies operating under the FXOpen brand, nor is it to be considered financial advice.

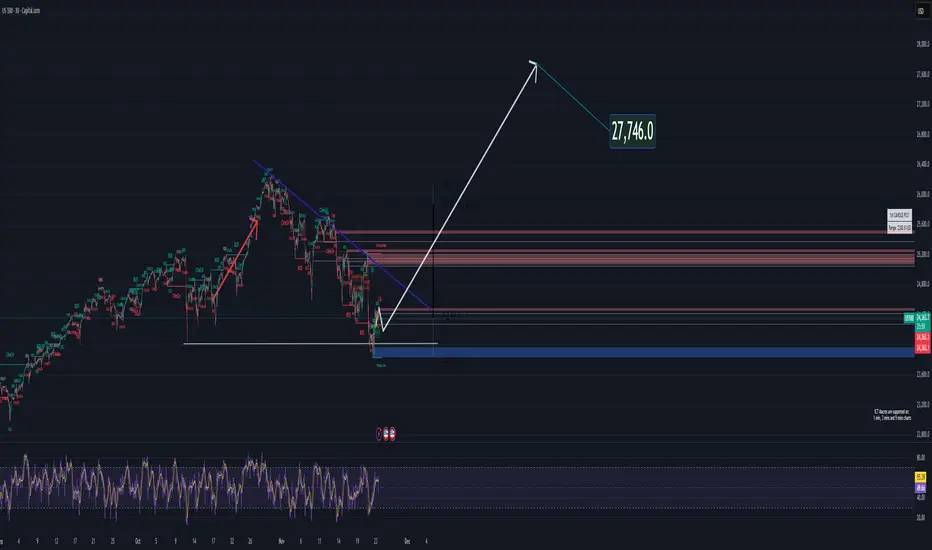
NASDAQ – Bullish Triangle Breakout LoadingI’m currently seeing a bullish ascending triangle forming on the Nasdaq indicating a strong accumulation phase before a potential breakout to the upside price has already started to bounce upward from this compression zone suggesting that buyers are taking control and preparing for a clean bullish continuation
If the breakout confirms, my target is around 27750$ aligns with
The projected target of the ascending triangle
A strong technical resistance zone
A logical extension given the current bullish structure
As long as price stays above the triangle support the bullish scenario remains the primary expectation
NASDAQDO YOU KNOW WHATS BEHIND THIS OR OTHER IDEAS?? in bio.
Preferably suitable for scalping and accurate as long as you watch carefully the price action with the drawn areas.
With your likes and comments, you give me enough energy to provide the best analysis on an ongoing basis.
And if you needed any analysis that was not on the page, you can ask me with a comment or a personal message.
Enjoy Trading ;)

USNAS100: Key Breakdown Levels Ahead — 24150 Next?USNAS100 | Technical Overview
The Nasdaq index continues to show weakness below 24460, keeping bearish pressure dominant in the short and medium term.
Technical Outlook
As long as the price remains below the pivot line at 24460, the bearish momentum is expected to continue toward 24150.
A break below 24150 opens the door for a deeper move toward 23930.
If the market closes a 4H candle below 23930, this will confirm a stronger bearish trend targeting 23700.
On the other hand, bullish momentum will only be activated if the price closes a 1H or 4H candle above 24760, which would signal a reversal toward higher levels.
Key Levels
Pivot Line: 24460
Support: 24150 · 23930 · 23700
Resistance: 24580 · 24760 · 25200

NAS100 Trade Set Up Nov 25 2025Price remains bullish making HH/HL on the 1h so i will be looking to take buys above PDH to target higher BSL levels but first i will wait for more internal structure on the 5m

NASDAQ Week 32 OutlookOn the US Nas 100 1-hour chart, a bearish breakout from a symmetrical triangle suggests downward momentum. The Fair Value Gap at 23,500.0 is a pivotal level—watch for a breakout and retest here to confirm sell entries. Aim for the target at 22681.1, with a stop-loss at 23,740.4 to protect against adverse moves.

NAS100 (Buy)All trades and analyses presented here are based on the **Smart Money Concept (SMC)**.
These analyses reflect only my personal perspective on market structure and price behavior, with charts clearly illustrating the details. The main purpose of sharing this content is strictly for **educational purposes** and to exchange personal experiences in trading.
⚠️ **Disclaimer:**
This content does not constitute financial advice, investment signals, or any guarantee of profitability. Financial markets inherently involve risk, and losses are possible. Each individual is fully responsible for their own trading decisions and outcomes. It is strongly recommended to consult with licensed financial advisors before making any investment decisions.

$NDX - Grab my strong handSame thing as SP:SPX
Buyers looking to close >24,700
Sellers looking to contain below <24,700
OUTLOOK = Mixed, buy dips // sell rips
**** Weekly view below

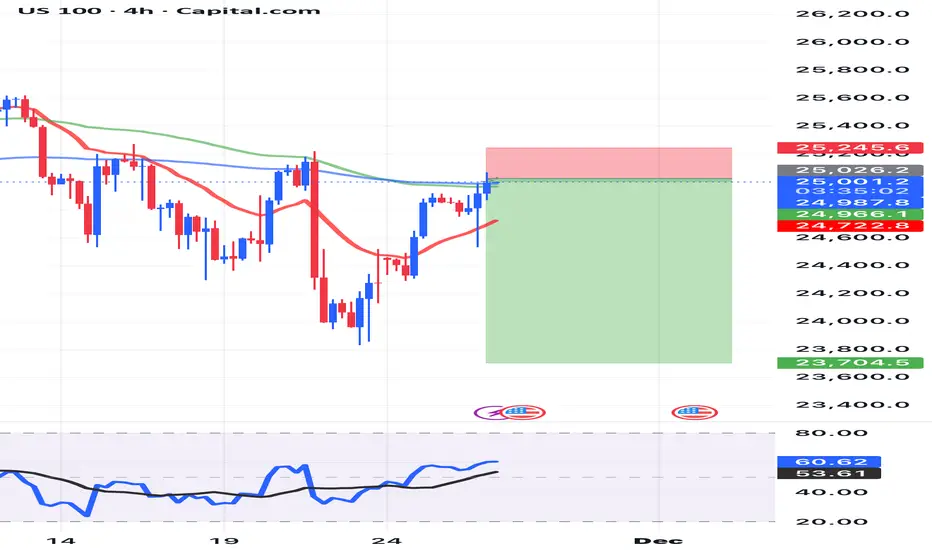
NAS100 Trade Opportunity: Will Buyers Defend the Pullback?📊 NAS100 (NASDAQ-100) Swing Trade Opportunity 🚀
Bullish Pullback Setup | Super Trend ATR + TMA Confirmation
🎯 TRADE SETUP OVERVIEW
Instrument: NAS100 (NASDAQ-100 Index)
Timeframe: Swing Trade (4H-Daily)
Bias: BULLISH ✅
Setup Type: Super Trend ATR Line Pullback + Triangular Moving Average (TMA) Confirmation
🎬 ENTRY STRATEGY - "LAYERING METHOD" 📍
This strategy employs multiple limit order placement (Layer Entry Technique) to optimize entry points during the pullback phase.
Recommended Layer Entry Points:
🔵 Layer 1: 24,500
🔵 Layer 2: 24,600
🔵 Layer 3: 24,700
🔵 Layer 4: 24,800
⚡ Pro Tip: Scale layers based on your account size and risk tolerance. Each layer reduces average entry price.
🛑 STOP LOSS (SL)
Primary SL Level: 24,300
Strategy: Placed below the latest swing low + Super Trend confirmation
⚠️ DISCLAIMER: This SL is a guideline only. You must adjust based on your personal risk management strategy and account equity. Risk is YOUR responsibility.
🎁 PROFIT TARGETS (TP)
PRIMARY TARGET (TP1): 25,700 🎯
First resistance zone
Ideal for taking partial profits
Recommended exit: 30-50% position
SECONDARY TARGET (TP2): 26,200 🔥
Strong resistance + Historical overbought zone
⚠️ TRAP ALERT: Expect potential reversal or consolidation
Recommended exit: Remaining 50-70% position
Use trailing stop for final portion
📈 TECHNICAL CONFIRMATION
✅ Super Trend ATR: Aligned bullish
✅ TMA (Triangular MA): Pullback to key level confirmed
✅ Higher Lows Pattern: Intact
✅ Volume Analysis: Supporting move
🔗 RELATED PAIRS TO WATCH 💡
Positive Correlation (Move Together):
🔴 SPY (S&P 500 ETF) - $380-395 Range
Correlation: +0.92 | Often leads NAS100 lower-cap stocks
Key Point: If SPY breaks $390, expect NAS100 momentum confirmation
Watch for divergence signals
🔴 QQQ (Invesco QQQ Trust - Nasdaq 100 ETF) - $450-470 Range
Correlation: +0.99 | DIRECT tracking of NAS100
Key Point: Primary barometer for Nasdaq sentiment
Use for volume + volatility confirmation
🔴 TECH Sector ETF (XLK) - $205-215 Range
Correlation: +0.88 | Tech-heavy holdings overlap
Key Point: Tech rotation affects Nasdaq flow
Monitor for sector strength/weakness
Inverse Correlation (Move Opposite):
🔵 DXY (US Dollar Index) - $103-106 Range
Correlation: -0.65 | Stronger dollar = Risk-off mood
Key Point: If DXY spikes, expect NAS100 pullback extension
Monitor Fed rate expectations
🔵 TLT (20+ Year Treasury ETF) - $75-80 Range
Correlation: -0.58 | Rising yields hurt growth stocks
Key Point: Check 10Y yield trend for rate pressure
Watch Fed policy announcements
Key Monitoring Points:
📌 Earnings Season Impact: Tech earnings can create ±2% moves
📌 Fed Minutes/Announcements: Watch for rate guidance changes
📌 Market Breadth: Compare Advance/Decline lines for confirmation
📌 Volatility Index (VIX): Levels above 20 = Caution; Below 15 = Risk-on
📋 BEFORE YOU TRADE - CHECKLIST ✅
Is price currently at/near Layer 1 entry (24,500)?
Does current 4H chart show TMA pullback + Super Trend confluence?
Is volume confirming the setup?
Have you set your SL below 24,300?
Do you understand you're risking X to make Y?
Is this aligned with your trading plan?
🎓 FINAL NOTES
This is a mechanical swing trade setup designed for traders who use limit orders and layering technique. The confluence of Super Trend ATR + TMA creates higher probability entries during bullish pullbacks.
Remember: Trading involves substantial risk of loss. This idea is shared for educational analysis. Your trading decisions are YOUR responsibility alone.
Happy Trading! 🚀💎

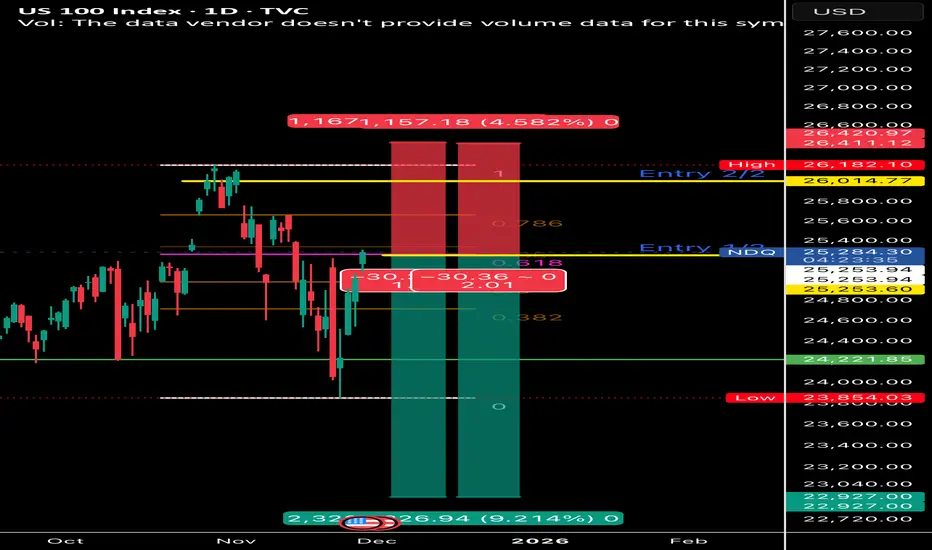
Short **Hedge** Predicting the double top on NDQ.Predicting the double top on NDQ.
I have longed a couple of assets i have been eying for a while during the correction at a good price, so this short is part of a hedging strategy I am taking.
2 entries, first (1/2) at fib 0.618 (reversed) the second (2/2) aiming for a double top.
My thought logic is like that:
If I fail to predict the double top on NDQ than my longs will most likely be much more profitable than my short.
NAS100How to become successful in forex and stock trading: 1.Master fundamentals and technical analysis. 2,Build and follow a solid trading plan. 3.Apply strict risk management (1–2% rule). 4.Stay disciplined—control fear and greed. 5.Record and analyze every trade. 6.Focus on high-quality setups only. 7.Diversify across assets and markets. 8.Keep evolving—study, adapt, and grow daily.
Has the Nasdaq’s Downtrend Ended?Recently, U.S. indices witnessed declines exceeding 5%, driven by reduced expectations of an interest rate cut in the Federal Reserve’s December meeting, the key catalyst influencing market sentiment and the movement of U.S. indices.
However, the Nasdaq rebounded this week, breaking above the 25,221 level and forming a higher high, indicating a shift in trend from bearish to bullish.
The latest gains are supported by renewed expectations of a December rate cut with an 80% probability, in addition to investors buying the dip as part of their long-term investment strategies in the artificial intelligence sector.
On the technical side, if the price pulls back for a correction, it may rebound again from the 24,148 level to target 24,962 as a first medium-term target.
However, a decline below 23,830, along with forming a lower low on the 4-hour timeframe, would invalidate the bullish scenario and signal a return to a downward trend for the Nasdaq.

NAS100 – Strong Order Block Explained | High-Volume Breakout & CA Strong Bearish Order Block formed on NAS100 after a powerful bearish Marubozu breakout candle, showing clear displacement and confirming aggressive institutional selling pressure.
1. Large Breakout Candle (Marubozu)
A strong bearish candle broke through previous structure with real displacement.
This is the first sign of a valid Order Block — a move driven by actual institutional flow, not just a liquidity sweep.
2. Clean Imbalance (IMB) Created
Right after the breakout, price left behind a clean Imbalance.
This IMB highlights urgency and confirms that big players were actively pushing the market.
3. Price Returned to the Strong Order Block
After the breakout, price slowly retraced back to the origin of the move — the Strong Order Block.
Once price tapped the OB, it reacted sharply and immediately moved lower, showing that institutional sellers were defending this level.
4. Volume Confirmation
Volume during the breakout was significantly higher than average.
This reinforces that the move was driven by institutional order flow, not retail traders.
🔑 Key Takeaways
This setup is a textbook Strong Bearish Order Block, meeting all core criteria:
Clear displacement
Clean Imbalance formation
Strong volume confirmation
Price returning to the OB and reacting decisively
A high-probability bearish setup built on structure, volume, and institutional footprints.

NASDAQ Analysis – Accumulating at Resistance With Bullish CorrelThe Nasdaq is currently accumulating right beneath a key resistance zone, showing strength despite last week’s volatility. A positive factor heading into today’s session is Bitcoin’s strong weekend recovery — a move that often correlates with green momentum in equity markets, especially tech.
If the Nasdaq manages to break this resistance with conviction, price could push toward the 25,000 trendline during the week, as we are still roughly 2.5% below that level.
The ideal scenario would be:
A strong breakout,
A clean retest of the broken resistance acting as new support, and
A controlled long-position continuation toward 25,000.
As long as accumulation holds and risk sentiment stays positive, the bias remains bullish — waiting for confirmation and a structured entry.


NASDAQ (US Tech 100) Price swept liquidity below a weak low, tapped into demand, and printed a bullish CHoCH, suggesting buyers are stepping in.
🟢 BUY Bias
Price is reacting from a discount zone + demand after a liquidity sweep. As long as we stay above the demand area, bullish targets remain valid.
🎯 Targets
TP1: 25,300
TP2: 25,600
TP3: 25,700+ (Liquidity at Strong High)
🔐 Stop-Loss: below 24,080 (beneath demand & sweep)
