NSDQ100 oversold rally reaching resistance at 25285Equities:
Risk appetite improved again, with the S&P 500 +0.91% marking a third straight gain, and futures pointing higher this morning (+0.31%). The move was reinforced by a drop in yields, with the 10yr Treasury down to 4.00%, a four-week low.
Drivers of the Rally:
Dovish Fed momentum: Markets leaned further into December rate-cut expectations after softer US data. Bloomberg headlines that Kevin Hassett is now the frontrunner for Fed Chair added to the dovish tilt.
Geopolitics: European equities tracked higher (STOXX 600 +0.91%), supported by reports of progress in Ukraine peace talks.
US Data – All Dovish:
Consumer Confidence (Nov): 88.7, below every estimate and the lowest since April’s turmoil.
ADP private payroll proxy: Averaged –13.5k over the latest four weeks, signalling labour softness.
September revisions:
Retail Sales +0.2% (vs +0.4% expected).
PPI +0.3% (in line), but still consistent with cooling demand.
Stocks in Focus:
Nvidia –2.59% underperformed as Google’s Gemini 3 launch signalled intensifying AI competition.
Geopolitics:
Bloomberg reported the US sent negotiators to meet Putin in Moscow next week to discuss a Ukraine peace proposal, adding to the constructive tone in Europe.
Trading Takeaway
Rates: Further downside bias in yields if today’s data stays soft; the 4.00% level on the 10yr is key support.
Equities: Momentum remains positive, but tech leadership is wobbling—watch for rotation into cyclicals, financials, and Europe.
FX: Dovish Fed expectations should pressure USD on the margins.
Geopolitics: Peace-talk headlines may continue to support European assets and risk sentiment.
Key Support and Resistance Levels
Resistance Level 1: 25285
Resistance Level 2: 25466
Resistance Level 3: 25390
Support Level 1: 24750
Support Level 2: 24600
Support Level 3: 24450
This communication is for informational purposes only and should not be viewed as any form of recommendation as to a particular course of action or as investment advice. It is not intended as an offer or solicitation for the purchase or sale of any financial instrument or as an official confirmation of any transaction. Opinions, estimates and assumptions expressed herein are made as of the date of this communication and are subject to change without notice. This communication has been prepared based upon information, including market prices, data and other information, believed to be reliable; however, Trade Nation does not warrant its completeness or accuracy. All market prices and market data contained in or attached to this communication are indicative and subject to change without notice.
Trade ideas

NAS100 Future | The Bullish Liquidity RuTrading isn't about chasing green candles; it's about anticipating where the "smart money" needs to go to fill their orders. On this NAS100 1H chart, we are stalking a potential Bullish Model #1 setup by waiting for price to revisit the discount zone.
Here is the CRT (Candle Range Theory) breakdown of the projected path:
1. The Trap: Turtle Soup at CRTL 🐢
The chart projects a drop below the CRTL (Candle Range Theory Low) at 24,664. This is the classic "Turtle Soup" mechanic.
The Logic: As the book states, "Turtle Soup is when the market tricks traders by briefly breaking through a level, then reversing".
The Goal: Smart money needs to "run stops... below old lows" to accumulate a long position. We want to see price stab this low to trap late sellers.
2. The Confluence: Fair Value Gap (FVG) 🧲
Notice that the sweep of the lows aligns perfectly with a Bullish FVG (the grey box).
Why it matters: "When Model #1 appears with an FVG... it becomes even more powerful". This gap acts as a magnet to pull price down before the real expansion begins.
3. The Objective: CRTH 🎯
If the trap is set and price reclaims the level (confirming the reversal), the draw on liquidity becomes the CRTH (Candle Range Theory High) at 25,307.
The Cycle: Market moves from range to manipulation (Turtle Soup) to trend. The target is simply the opposing side of the range.
🧠 Trader's Mindset: "Patience is your greatest trading asset". Right now, the chart suggests we are in the waiting phase. Do not try to catch the falling knife. Wait for the sweep of the CRTL, look for the strong reaction (Model #1 confirmation), and then execute.
Disclaimer: This analysis is based on Candle Range Theory concepts for educational purposes. Past performance is not indicative of future results.
Next Step: Set an alert at 24,720. Are you watching for the sweep or buying the dip early? Let me know your plan below! 👇

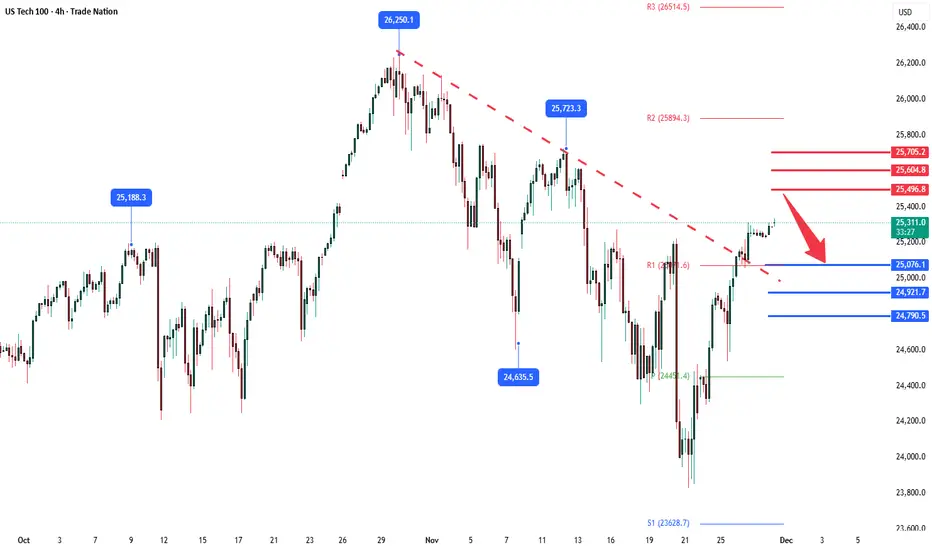
NSDQ100 head into Thanksgiving on a strong noteUS markets head into Thanksgiving on a strong note, with the S&P 500 rising for a fourth straight session (+0.69%) and now sitting just over 1% below its record high. The index has delivered its biggest four-day rally (+4.19%) since the US-China trade truce in May, driven by growing expectations of another Fed rate cut in two weeks and supported by resilient US data.
Trading was disrupted after a technical failure caused a major outage at the Chicago Mercantile Exchange, halting futures and options activity—including Treasuries and S&P 500 futures—and affecting other platforms such as EBS in FX.
Elsewhere, oil is on track for its worst monthly performance since 2023, and equity momentum faded into month-end as markets contended with volatility and concerns around Fed policy and a potential AI-driven bubble.
On the political front, President Trump escalated rhetoric on immigration following the fatal shooting of a National Guard member, proposing drastic restrictions including a pause on admissions from “third world” countries and revoking some naturalized citizenships. He also increased tensions with South Africa, saying he would bar the country from next year’s G20 summit in Miami—a move that breaks established protocol.
With limited news expected on Friday, markets head into the final stretch of November after a turbulent month for global equities.
Key Support and Resistance Levels
Resistance Level 1: 25496
Resistance Level 2: 25600
Resistance Level 3: 25700
Support Level 1: 25076
Support Level 2: 25920
Support Level 3: 25790
This communication is for informational purposes only and should not be viewed as any form of recommendation as to a particular course of action or as investment advice. It is not intended as an offer or solicitation for the purchase or sale of any financial instrument or as an official confirmation of any transaction. Opinions, estimates and assumptions expressed herein are made as of the date of this communication and are subject to change without notice. This communication has been prepared based upon information, including market prices, data and other information, believed to be reliable; however, Trade Nation does not warrant its completeness or accuracy. All market prices and market data contained in or attached to this communication are indicative and subject to change without notice.
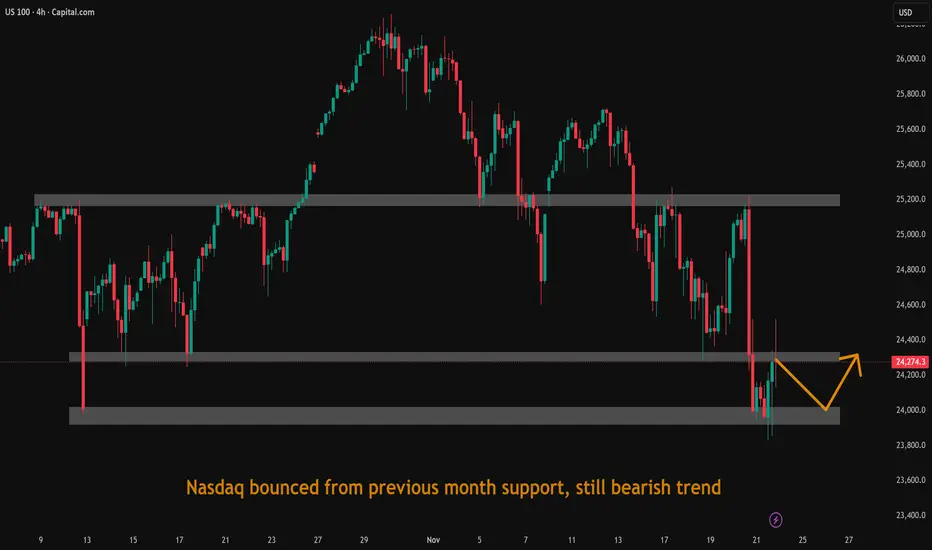
Nasdaq bounced from previous month support, still bearish trendNasdaq bounced from previous month support, still bearish trend.
US100 Technical Outlook: Bearish Pullback Inside a Key LiquidityHey traders 👋
The US100 (NASDAQ 100) is currently sitting in a very interesting technical position on the 4-hour chart.
Let’s break it down 👇
🧭 Structure Overview
After a strong bullish leg that peaked near 25,800, the index entered a descending corrective channel.
We’ve now hit an important support cluster around 24,975 – 25,000, which previously acted as a pivot zone.
I’ve mapped two main liquidity boxes (blue & yellow) that show where buyers and sellers built positions during the last phases of consolidation.
Notice how price rejected from the upper boundary of the yellow box twice — confirming short-term supply pressure.
📊 Volume Analysis
Volume has been elevated on each red candle, confirming that this down-move isn’t just a retracement without conviction.
However, the most recent bar shows a strong bullish reaction on higher volume, indicating potential absorption — smart money may be defending the 25K handle.
If we see declining volume on the next two green candles → likely dead cat bounce.
If volume expands again above 25,200 → we might get a break and retest of the red trendline for a short-term continuation toward 25,600–25,750.
🧱 Key Levels
Zone Bias Comment
25 210 – 25 220 Resistance Prior liquidity flip zone, possible rejection area
24 975 – 25 000 Current support Reaction zone, watch for confirmation candle
24 600 Target 1 Measured-move projection
24 250 – 24 300 Target 2 Major daily demand zone / possible higher-low base
🔻 Bearish Scenario (Primary Plan)
Short bias remains valid below 25 210.
Expect a short-term bounce into 25 100–25 200, then rejection.
Targets: 24 600 → 24 250.
Invalidation: close above 25 220 on strong volume (would flip the structure bullish).
🟢 Bullish Alternative
If bulls can close a 4H candle above 25 210 – 25 220 with confirmed volume > previous red bar,
the down-channel breaks, and we may see a fast rally back to 25 600 – 25 750.
⚙️ Strategy Note
This chart is for educational & analytical purposes — not financial advice.
I’ll update if we get confirmation on the next 4-hour candle.
👉 Follow for updates and let me know your view — will the 25K zone hold or break next week?
📅 Summary
Trend: Medium-term uptrend, short-term correction
Bias: Bearish below 25 210
Setup: Channel rejection → continuation toward 24 600 / 24 250
Risk: Volume-based breakout above 25 220
Hit 👍 and follow if you found this breakdown helpful — I post detailed NAS100 / SPX / DAX updates every week with volume-based setups.
Let’s grow the community together 🚀
Would you like me to format it with hashtags and keyword tags (so it ranks better in TradingView search, like #US100 #NASDAQ #TechnicalAnalysis #PriceAction #VolumeProfile)? I can add that next.
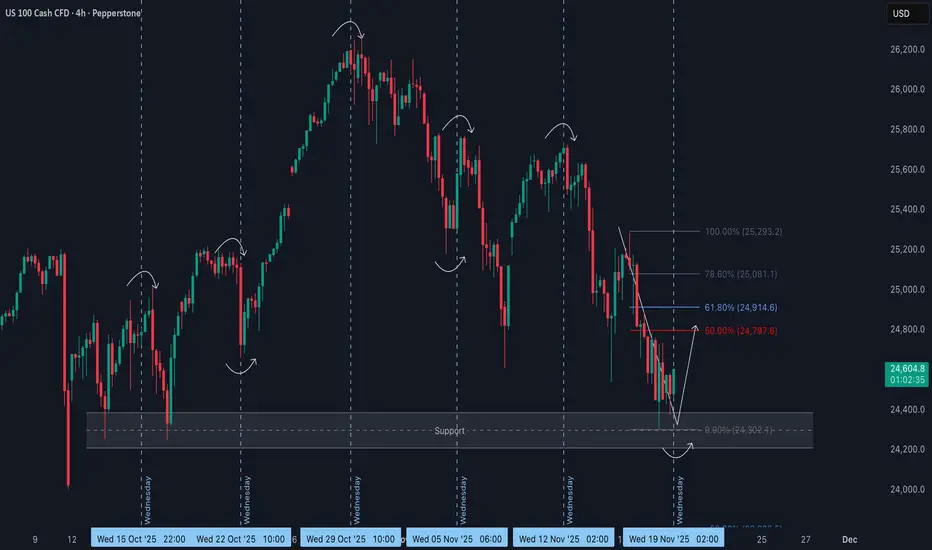
NAS100 Wednesday Reversal Potential from Key SupportOver the past several weeks, the NAS100 has shown a clear tendency for aggressive mid-week reversals, with Wednesdays repeatedly triggering sharp shifts in direction 🔄. This pattern suggests a strong time-based element in the algorithmic delivery of price, rather than random fluctuation.
🗓️ Each Wednesday has produced a notable reaction, whether through a liquidity grab, a stop run, or a full intraday reversal. With today being Wednesday once again, the timing aligns perfectly with the type of behaviour the market has been delivering consistently.
📉 The current decline has brought price directly into a well-defined high-timeframe support region. This area has a history of accumulation and typically holds a large amount of resting liquidity underneath it. The repeated wicks into this zone resemble classic Wyckoff spring behaviour 📦 — a sweep of sell-side liquidity followed by a potential response from larger players.
📐 The most recent bearish leg is noticeably overextended and has not offered a proper retracement since breaking lower. This leaves inefficiencies behind and increases the likelihood of a move back toward equilibrium.
🔄 Given the confluence of mid-week timing, the tap into higher-timeframe support, the liquidity sweep, and the extended nature of the current downswing, the expectation is for at least a corrective move back into equilibrium 📈.
A bullish break of short-term structure on the lower timeframes would strengthen this bias and open the door for a retracement into the premium levels listed above.
⚠️ Not financial advice. This is simply a technical outlook and my opinion.
NAS100 at Crossroads: Bulls Eye 25K Breakout or Pullback Trap?Spot Price: 24,875 | Session: London-NY Overlap | 09:43 UTC+4
━━━━━━━━━━━━━━━━━━━━━━━━━━━━━━
🔎 Market Structure Overview
Price action on NAS100 reveals a consolidation phase following last week's bullish momentum. The index is currently hovering near a critical demand zone, with buyers defending the 24,800 handle aggressively. On the higher timeframes, the trend remains intact, but shorter intervals suggest a potential retracement before continuation.
📈 Multi-Timeframe Breakdown
5M & 15M: Minor bearish divergence forming on RSI as price prints higher highs while momentum weakens. Watch for a pullback toward 24,820 for scalp entries.
30M: Price respecting the ascending trendline from Friday's lows. A breach below 24,790 invalidates this structure.
1H: Ichimoku Cloud providing solid support – Tenkan crossing above Kijun signals short-term bullish bias.
4H: Bollinger Bands tightening, hinting at an imminent volatility expansion. VWAP anchored at 24,850 acting as intraday pivot.
🧠 Technical Confluence Zones
Key Resistance: 24,950 – 25,020 (psychological barrier + prior swing high)
Key Support: 24,780 – 24,720 (demand cluster + 50 SMA on 1H)
⚡ Pattern Recognition
A potential ascending triangle is developing on the 30M chart, with horizontal resistance near 24,920 and rising lows. A decisive breakout above this ceiling could trigger acceleration toward 25,050. Conversely, failure at resistance may initiate a corrective wave toward the 24,700 region.
📐 Wyckoff & Elliott Perspective
Current price action resembles Phase C of accumulation under Wyckoff methodology – a spring or shakeout below 24,800 would confirm smart money absorption before markup. From an Elliott standpoint, we appear to be completing wave (iv) of a larger impulse sequence, with wave (v) extension targeting 25,100+.
━━━━━━━━━━━━━━━━━━━━━━━━━━━━━━
🎯 Trade Setup – Intraday Long
Entry Zone: 24,820 – 24,850 (on pullback to demand)
Stop Loss: 24,740 (below structure invalidation)
Take Profit 1: 24,950 (initial resistance)
Take Profit 2: 25,020 (extended target)
Risk-Reward: Approximately 1:2.5
🎯 Alternative Setup – Short Scalp (Counter-Trend)
Entry: 24,940 – 24,960 (rejection at resistance)
Stop Loss: 25,010
Take Profit: 24,850
━━━━━━━━━━━━━━━━━━━━━━━━━━━━━━
⚠️ Risk Note: Monitor US economic calendar for potential catalysts. Thin pre-holiday liquidity could amplify volatility – adjust position sizing accordingly.
Trade wisely. Protect capital first. 💼

NAS100 | Bullish Bounce Off Pullback SupportMomentum: Bullish
Price is currently above the ichimoku cloud.
Buy entry: 25,308.70
- Pullback support
- 23.6% Fib retracement
Stop Loss: 25,092.80
- Multi-swing low support
Take Profit: 25,553.90
- Swing high resistance
- 127.2% Fib extension
High Risk Investment Warning
Stratos Markets Limited (tradu.com/uk ), Stratos Europe Ltd (tradu.com/eu ):
CFDs are complex instruments and come with a high risk of losing money rapidly due to leverage. 70% of retail investor accounts lose money when trading CFDs with this provider. You should consider whether you understand how CFDs work and whether you can afford to take the high risk of losing your money.
Stratos Global LLC (tradu.com/en ): Losses can exceed deposits.
Please be advised that the information presented on TradingView is provided to Tradu (‘Company’, ‘we’) by a third-party provider (‘TFA Global Pte Ltd’). Please be reminded that you are solely responsible for the trading decisions on your account. Any information and/or content is intended entirely for research, educational and informational purposes only and does not constitute investment or consultation advice or investment strategy. The information is not tailored to the investment needs of any specific person and therefore does not involve a consideration of any of the investment objectives, financial situation or needs of any viewer that may receive it. Past performance is not a reliable indicator of future results. Actual results may differ materially from those anticipated in forward-looking or past performance statements. We assume no liability as to the accuracy or completeness of any of the information and/or content provided herein and the Company cannot be held responsible for any omission, mistake nor for any loss or damage including without limitation to any loss of profit which may arise from reliance on any information supplied by TFA Global Pte Ltd.

NAS 2 MOON ?Ok so i made my oblivion call
where i expect incomprehensible shorting wothon the us stock market however i see one last impulse cooking up might react at the red levels and tank there before it goes my way idk but my bias is bullish and $27295 is my target
weekly timeframe keeps making higher highs if it breaks structure well game over


Bullish signalsThe price is bouncing from 100-day EMA and VWAP from late June low on US100 chart (not on NDX though). WXY correction structure looks complete. It can still go lower to test 0.618 fib from August 1 low to top or August 13 peak. RSI shows 2h bullish divergence on all Nasdaq and S&P500 charts. A reversal to new ATH is highly probable from this area (or atleast a high bounce to draw another right shoulder).

Nasdaq The #1 Fear Of Investors BuyingLet me tell you what i did
i searched google and then i type
fear and greed index of the stock market
A page appeared and i saw the link
it took me to a famous
news website
where i saw something very shocking.
The gauge was on extreme fear.
The last time this appeared was in April
of 2025.
Now look at this chart on top..
You will see the RSI
its in the buying channel
because its oversold
This channel is showing
you the right place to buy this stock at a affordable price.
The main stream media
and your favourite Guru
is not talking about this
market recovery
Because its not easy to see unless you
understand trading systems.
Am ready to buy this
are you?
Rocket boost this content to learn more
Disclaimer: Trading is risky please learn risk management and profit
taking strategies.Make sure
you use a simulation trading account before you
trade with real money.

NAS100 Trade Set Up Nov 26 2025Price remains in a bullish trend so as long as it stays closed above 1h swing low/London low i will look for internal SSL sweep to then target buys to higher BSL

Nasdaq 100 under pressureAfter the Nasdaq 100 fell by more than 3% in the week ending Friday 21 November, the index may extend those losses in the coming days. Recently, the Nasdaq 100 has been trading in a downtrend. Momentum has weakened, as indicated by the relative strength index (RSI), which formed a bearish divergence from mid-September when it began making a series of lower highs while the Nasdaq 100 itself made higher highs. Currently, the RSI is around 43, indicating that the Nasdaq 100 is not yet oversold and may have further downside potential.
However, after trading along its lower Bollinger Band last week, the Nasdaq 100 yesterday recovered some of its recent losses and rose above that lower band. The index broke above resistance at 24,500 early on Monday and went on to pierce the 10-day exponential moving average near 24,700 as it climbed to 24,870 by Monday’s close. Whether this proves to be a temporary rebound remains to be seen, but for now the next significant resistance level is around the trendline near 25,000, followed by the 20-day moving average near 25,250.
Despite yesterday’s bounce, there has been considerable technical damage to the Nasdaq that needs to be repaired if the index is to make further gains. In the near term, the prevailing trend is likely to remain bearish. A break below 24,000 could set the stage for a decline towards 22,700.
Written by Michael J. Kramer, founder of Mott Capital Management.
Disclaimer: CMC Markets is an execution-only service provider. The material (whether or not it states any opinions) is for general information purposes only and does not take into account your personal circumstances or objectives. Nothing in this material is (or should be considered to be) financial, investment or other advice on which reliance should be placed.
No opinion given in the material constitutes a recommendation by CMC Markets or the author that any particular investment, security, transaction, or investment strategy is suitable for any specific person. The material has not been prepared in accordance with legal requirements designed to promote the independence of investment research. Although we are not specifically prevented from dealing before providing this material, we do not seek to take advantage of the material prior to its dissemination.

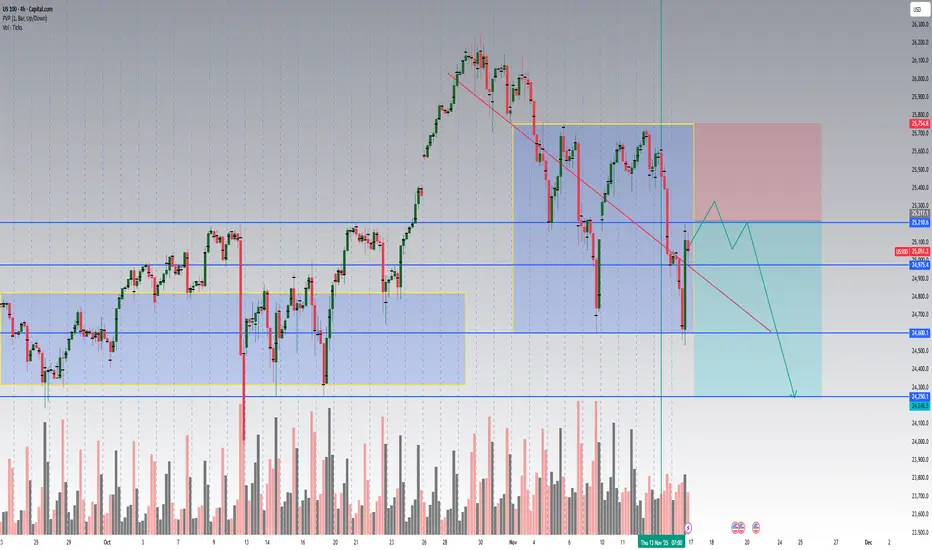
nas100 4h🔹 Overall Outlook and Potential Price Movements
In the charts above, we have outlined the overall outlook and possible price movement paths.
As shown, each analysis highlights a key support or resistance zone near the current market price. The market’s reaction to these zones — whether a breakout or rejection — will likely determine the next direction of the price toward the specified levels.
⚠️ Important Note:
The purpose of these trading perspectives is to identify key upcoming price levels and assess potential market reactions. The provided analyses are not trading signals in any way.
✅ Recommendation for Use:
To make effective use of these analyses, it is advised to manually draw the marked zones on your chart. Then, on the 15-minute time frame, monitor the candlestick behavior and look for valid entry triggers before making any trading decisions.

Nasdaq (sell)**Disclaimer (Smart Money Concepts Analysis)**
This analysis is based on Smart Money Concepts (SMC) and represents only the analyst’s personal perspective. All marked levels, scenarios, and the two potential entry points are provided strictly for educational purposes and should not be considered financial advice, investment guidance, or a buy/sell signal.
Any trade you choose to take is entirely your own decision and must be executed with proper risk management and full personal responsibility. Market conditions may shift at any time and may invalidate the outlined scenarios.
This analysis is not a substitute for professional financial or investment advice. It is recommended to:
* Always use a **stop-loss**
* Follow a **clear risk management plan**
* Verify setups with your own analysis
* Be aware that the market can move unpredictably
By using this analysis, you acknowledge that all trading decisions and outcomes are solely your responsibility.

NAS100 Professional Technical Analysis
Asset: NAS100 (CFD SPOT INDEX)
Current Price: 24,434.00
Date: November 24, 2025
Market Sentiment: The NAS100 is currently testing a critical psychological barrier at the 24,450 level. Volatility is expected to increase as we approach the US session open.
📊 Technical Indicators & Trend Analysis
Trend Direction: The primary trend remains BULLISH 🐂 on the 4H timeframe, though signs of exhaustion are appearing on the 15m chart.
Relative Strength Index (RSI): Currently reading at 72.5 , indicating overbought conditions. A divergence is forming, suggesting a potential short-term pullback before continuation.
Bollinger Bands: Price is hugging the upper band, with a "squeeze" formation likely resolving in a high-momentum breakout or rejection.
📐 Fibonacci & Harmonic Patterns
Fibonacci Retracement: Key support lies at the 0.382 level (24,380) and the Golden Pocket 0.618 level (24,310) from the recent swing low.
Harmonic Pattern: A potential Bearish Bat Pattern is completing near 24,460. This harmonic reversal zone (PRZ) aligns with our immediate resistance.
🛡️ Support and Resistance Levels
Resistance 1: 24,460 (Daily High / Harmonic Completion)
Resistance 2: 24,525 (Weekly Extension)
Support 1: 24,380 (0.382 Fib)
Support 2: 24,310 (Key Pivot Zone)
🎯 Trade Setup & Forecast
Scenario A: Reversal (Short)
If price rejects 24,460 with bearish engulfing candle:
Entry: Below 24,440
Target 1: 24,380
Target 2: 24,310
Stop Loss: 24,485
Scenario B: Breakout (Long)
If price closes above 24,465 on 1H volume:
Entry: Retest of 24,465
Target: 24,550
Stop Loss: 24,420
⚠️ Summary: Watch for a reaction at the 24,460 zone. The confluence of the Bearish Bat pattern and RSI overbought conditions favors a short-term correction, but the overall trend remains strong. Trade with caution. 📉📈

Nasdaq : 24,000 Holds Strong — Next Stop 25,800?Price action on the Nasdaq 100 is telling a clear story: 24,000 (AVWAP + HVN confluence + Round number) is acting like a magnet for institutional buyers.
This suggests that accumulation is happening at these levels, positioning for a potential run toward 25,800 if momentum holds.
Are we front-running a breakout, or should we wait for confirmation above 25,000 first?

Rising Expanding Wedge BreakdownI’ve spotted this expanding wedge pattern on the Nasdaq and there is probably more downside imminent for the Nasdaq. I'm sure this isn’t new to most of you. A bearish price target around 23,000 (for now) is highly likely. Long-term I remain bullish (see my other ideas), but right now the extreme fear is handing control to the bears for a while.

Why Markets Struggle After a Big Drop (NASDAQ Case Study)Understanding liquidity, distribution phases and market-maker behavior
After the NASDAQ fell sharply from 25 000 to 24 000, many traders were surprised why the market suddenly stopped moving and started to “chop” around the same area.
But this behavior is not random — it’s a structural problem inside the order-flow.
1️⃣ Markets can fall fast — but they cannot continue without liquidity
Every trade in the market has a counter-party.
If traders want to buy the dip, someone must sell to them.
After a large drop, fewer participants are willing to sell at the new low prices.
Institutions are often already hedged or already sold during the fall.
Market makers cannot force liquidity out of thin air — they must create it.
This leads to a distribution phase, where price stops trending and starts rotating around a key area.
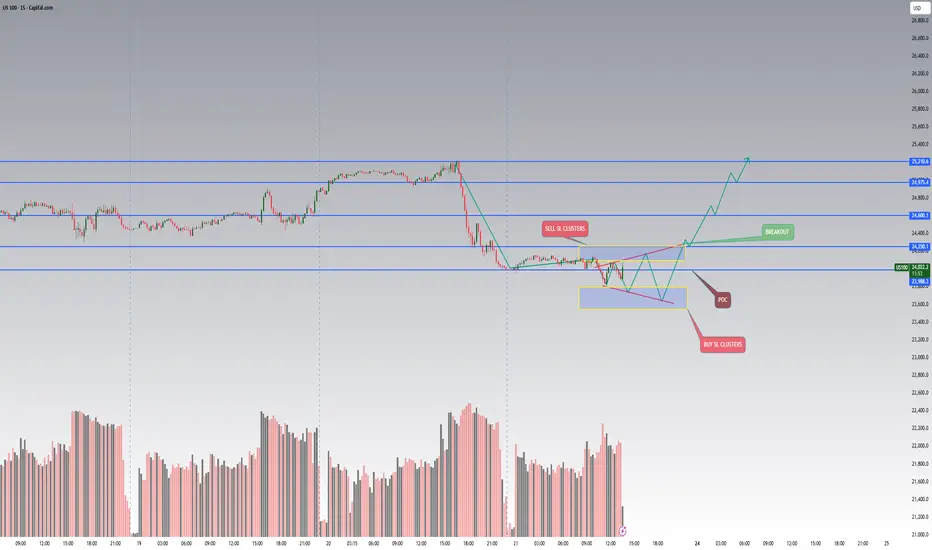
2️⃣ Why distribution forms around the Point of Control (POC)
When aggressive hedging is finished and volatility slows down, the market enters a phase where:
Price rotates around the Point of Control (POC)
Volume increases
Market makers attempt to rebuild liquidity on both sides of the range
This is not accumulation or re-accumulation — it is a liquidity-engineering phase.
Market makers need enough:
Buy-side liquidity above POC (stop losses of shorts, breakout traders, trapped buyers)
Sell-side liquidity below POC (stop losses of longs, late dip-buyers, liquidation clusters)
Without these pools, the market cannot initiate the next impulsive move.
3️⃣ The problem with sell-side liquidity after a big fall
When NAS dropped from 25k → 24k:
Most weak longs were already liquidated
Many sellers closed positions or took profit
Fresh shorts hesitate to enter at the lows
Institutions are waiting for better prices
This creates a liquidity vacuum.
To solve this vacuum, the market “mirrors” trades inside the range:
Price moves up → build stops above
Price moves down → build stops below
Repeated sweeps → fill both sides of liquidity
Only after enough stop-loss clusters form, the market is capable of moving again with real momentum.
4️⃣ What this means for traders
This is not a buy or sell signal.
It’s an explanation of why the market becomes extremely slow, sideways or manipulative after a big impulsive move.
In this phase:
Breakouts usually fail
Trend trading performs poorly
Range traps occur frequently
Market reacts strongly to liquidity pockets, not fundamentals
The key is to understand what the market is missing:
➡️ Not direction.
➡️ Not fundamentals.
➡️ But liquidity.
Until the liquidity pools are recreated, the next real directional move cannot start.
5️⃣ Final takeaway
A strong decline does not end because “buyers step in.”
It ends because no more sellers exist at those levels, forcing market makers to rotate price and rebuild the order-book.
Learning to identify these liquidity-reset periods helps traders avoid:
Chasing breakouts
Entering too early
Getting trapped during fake momentum
Misreading sideways distribution as a reversal
NasdaqBullish nasdaq as price went to restest the strong demand zone ans respected the price zone. Now more bullish momentum expected till our initial resistance.

US100 Bullish Bias! Buy!
Hello,Traders!
US100 is expanding from the demand zone after a clean mitigation and a shift in structure, with liquidity resting above the recent swing highs. Market is poised to draw toward the next premium target as inefficiencies get filled. Time Frame 5H.
Buy!
Comment and subscribe to help us grow!
Check out other forecasts below too!
Disclosure: I am part of Trade Nation's Influencer program and receive a monthly fee for using their TradingView charts in my analysis.
