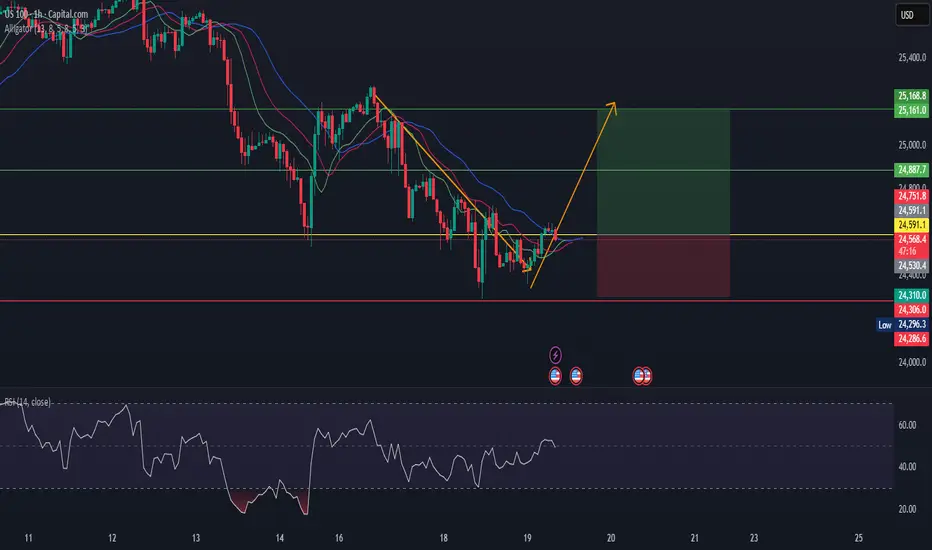
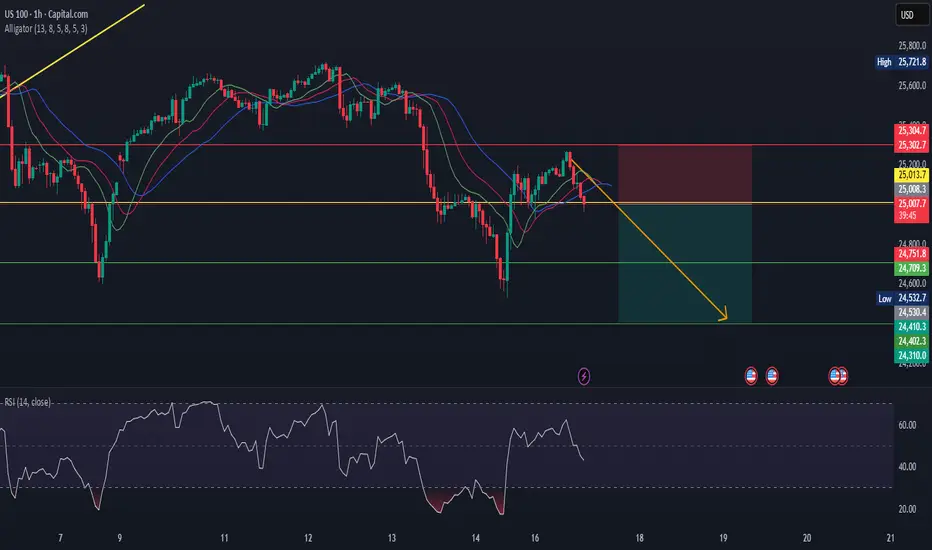
US100US100 is in reversal mode.
As per my analysis.
Alligator direction change to upward.
bullish divergence also made.
See here strong buy indicatin.
Buy at CMP.
Trade ideas
The Deeper Logic Behind Price Delivery (Nobody Talks About This)Most traders think some pairs are slow and others are fast.
But that belief is the reason they stay confused, lose trades, and can’t read delivery.
The truth is deeper, and once you see it, you can’t unsee it.
This is the real explanation behind timing, alignment, and phase delivery — the part nobody teaches.
Most traders think some markets “move fast” and other markets “move slow.”
That’s a surface-level observation. It sounds true, but it completely misses the deeper mechanics behind why price behaves the way it does.
The truth is this:
Markets don’t move fast or slow — markets move according to timing.
Every pair follows the same structural blueprint.
The only difference is where each pair is within its delivery cycle.
Price is always doing one of two things:
1. Delivering a continuation leg (impulsive, clean, fast movement)
2. Building the pullback leg (corrective, choppy, slower movement)
When a pair is fully aligned on the higher timeframe — when the trend, liquidity objectives, and structural breaks are all synchronized — the continuation phase will always look fast. It’s clean, directional, and decisive because the cycle is ready to deliver.
When a pair is still developing inducements, collecting liquidity, or forming the structure it needs for the next leg, it will naturally look slow or indecisive. Not because the pair is slow, but because the cycle is incomplete.
This is why one pair may be exploding while another is barely moving:
they’re simply in different phases of the same universal process.
Price is never random.
Price is never “lazy” or “weak.”
Price is simply obeying its timing.
Higher timeframes reveal that timing.
They show you:
• Whether continuation is ready
• Whether the pullback is still developing
• Whether liquidity has been engineered
• Whether the dominant leg is prepared to deliver
• Whether the cycle is aligned or still maturing
Lower timeframes only express what the higher timeframe already decided.
So the idea that “some pairs move fast and some move slow” is a misunderstanding. No pair is naturally fast or slow — every pair delivers exactly the same way, just not at the same time.
Fast movement = HTF alignment + continuation phase
Slow movement = HTF development + liquidity engineering phase
Once you understand timing, you stop comparing pairs by their speed and start reading them by their position in the cycle.
That’s when trading stops being guesswork and starts becoming recognition.
Because the deeper truth is simple:
Price isn’t unpredictable — traders are just unaware of what time it is.
-Do you view the market by timing or by “speed”?
Let me know — I read every comment.
#NAS100 #Education #SMC #MarketTiming #PriceAction #SmartMoney #Forex #Indices
NAS100 Trade Plan: Counter-Trend Opportunity Into Friday CloseI’m currently watching the NASDAQ NAS100 📊 and looking for a potential setup as we head into the Friday close. The market has pushed into the weekly low, and I’m anticipating the possibility of a retracement, which could offer a counter-trend opportunity during the New York session. 🚀📉📈 All details are broken down clearly in the video — this is not financial advice. ⚠️

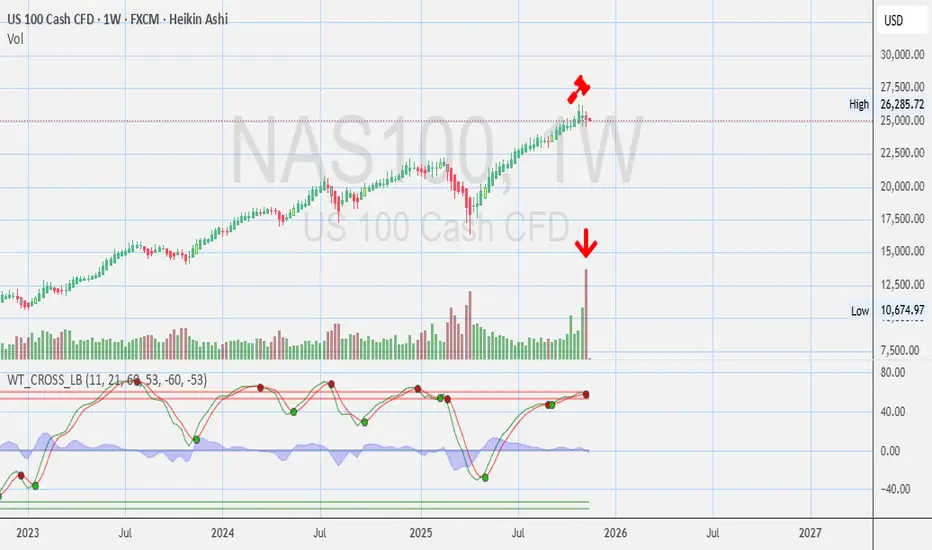
NASDAQ - Weekly Chart Opinions? Game Over ? or 🧠 Keep it on watch. Momentum shifting.
Any Opinions on HUGE VEEKLY VOLUME? Game Over? or?
⚠️ Disclosures :
This analysis is for informational purposes only and is not financial advice. It does not constitute a recommendation to buy, sell, or trade any securities, cryptocurrencies, or stocks. Trading involves significant risk, and you should consult with a qualified financial advisor before making any investment decisions. Past performance is not indicative of future results.
Daq buyWhat is up ma friends? Happy Government reopen! Price flushed straight into a demand pocket after a steady selloff. The long triggers right as the candle sweeps the previous lows and snaps back. classic liquidity grab followed by an immediate reclaim.

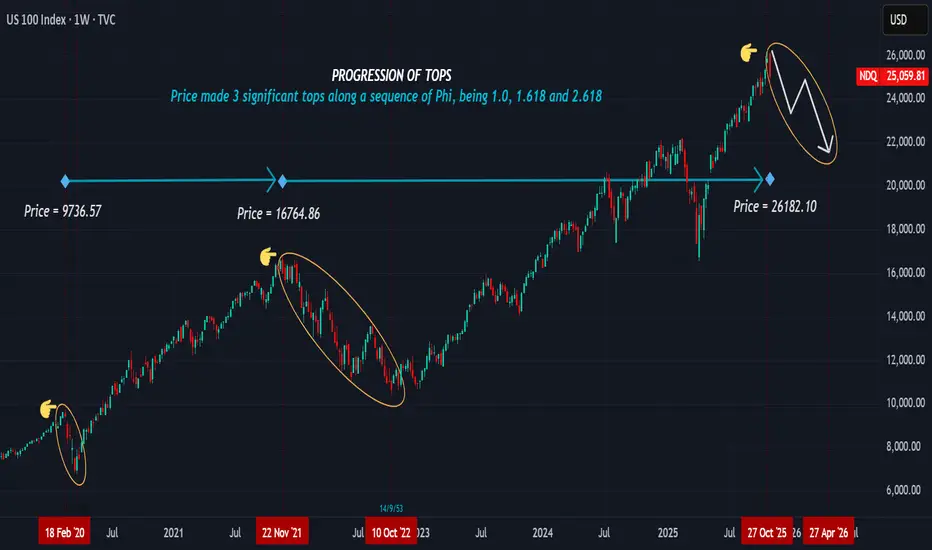
SHORT UNTIL LATE APRIL 2026OUR OBSERVATION
NASDAQ made three significant tops in its price action from 2009 to the present in a sequence of an expanding Phi.
February 2020 High = 9736.57 (This is the 1.0 growth level divided into a Log function)
(9736.57 / 10^4) = 0.973657 (Equivalent to 3/3 = 1.0)
November 2021 High = 16764.86
(16764.86 / 10^4) = 1.676486 ( This is the 5/3 Fibonacci sequence or a variation of 1.618)
Current High at 27th October 2025 = 26182.10
(26182.10 / 10^4) = 2.618210 (This level indicates the 8/3 growth sequence or 2.618 level)
TRADE PLAN
If we project a sequence of thirds, (1/3, 2/3, 3/3), then the three tops from 2009 made an expanding sequence along 3/3, 5/3, and 8/3 nodal points , at 9736.57, 16764.86 and 26182.10 levels respectively. Each node effected a correction, and by projection, we expect price to correct steadily until late April 2026. (1,2,3,5,8...) points form the price tops. The zone between 26182.1 and 26880.XX will be our confluence zone to expect a decline.
We projected the 27th October top as far back as April 2025, where we mentioned a broader cross assets decline. If we compare NASDAQ's price to SP-500 and DJIA, then we can create a larger sequence pattern. SP-500 top reached 6920.34 being 2/3 on the sequence while DJIA reached 48040.64, the 13/3 node. Several markets reaching tops at the same time cooks a sharp long decline. Therefore, we will keep short entries for all three markets until the tops break.
NOTE: We do not trade news effects, we only trade measurable facts the charts indicate. However, we look to the news for signals that add strength to our expectations.
Trade safe, good luck
NAS100 LONG SETUP Price continues to follow the uptrend on D1. After rejecting 26... price retraced to the 24... region meeting a stable support there to form a double bottom

NAS100 - Waiting for buy setup on 4hr timeframeTimeframes Used: Monthly → Weekly → Daily → 4H
Current Market Condition:
Nas 100 is a valid trade according to my system rules:
Monthly: Price is above the Cloud → Bullish
Weekly: Price is above the Cloud → Bullish
Daily: Price is above the Cloud → Bullish
----------------------------------------------------------------------------------------------------------------
What I’m Waiting For:
I’ll be watching for the next 4H breakout opportunity.
Price to break above the 4hr timeframe.
NAS100 H4 | Potential bullish reversalMomentum: Bearish
The price may experience a short-term pullback toward the identified buy-entry level, which aligns with a key pullback-support zone.
Buy Entry: 24,851.44
Pullback Support
Stop Loss: 24,362.73
Multi Swing-Low Support
Take Profit: 25,774.15
Pullback Resistance
High Risk Investment Warning
Stratos Markets Limited (tradu.com ), Stratos Europe Ltd (tradu.com ):
CFDs are complex instruments and come with a high risk of losing money rapidly due to leverage. 70% of retail investor accounts lose money when trading CFDs with this provider. You should consider whether you understand how CFDs work and whether you can afford to take the high risk of losing your money.
Stratos Global LLC (tradu.com ): Losses can exceed deposits.
Please be advised that the information presented on TradingView is provided to Tradu (‘Company’, ‘we’) by a third-party provider (‘TFA Global Pte Ltd’). Please be reminded that you are solely responsible for the trading decisions on your account. Any information and/or content is intended entirely for research, educational and informational purposes only and does not constitute investment or consultation advice or investment strategy. The information is not tailored to the investment needs of any specific person and therefore does not involve a consideration of any of the investment objectives, financial situation or needs of any viewer that may receive it. Past performance is not a reliable indicator of future results. Actual results may differ materially from those anticipated in forward-looking or past performance statements. We assume no liability as to the accuracy or completeness of any of the information and/or content provided herein and the Company cannot be held responsible for any omission, mistake nor for any loss or damage including without limitation to any loss of profit which may arise from reliance on any information supplied by TFA Global Pte Ltd.

Nasdaq 100: Bulls on the Back Foot as 50DMA Gives WayOur Nasdaq 100 contract is looking heavy. Very heavy.
The price action has been increasingly unconvincing for bulls in November, culminating on Monday with the price closing beneath the 50-day moving average for the first time since April. That’s a noticeable departure from what was seen when tested in the recent past, with the price often reversing higher immediately after. Not on this occasion.
Should the price remain below the 50-day moving average, the next focal point is uptrend support that’s been in place for over six months. In each of the past two sessions the price has traded through the level only to reverse higher, attracting buyers on dips beneath 24650—that’s the battleground to watch in the near term.
If the price were to close beneath uptrend support and 24650, it would bolster conviction that a deeper downside flush may be coming, allowing for shorts to be established with a stop above the uptrend to protect against reversal. 24000 provided support and resistance earlier this year, making it a potential initial target.
Of course, should the price remain above the uptrend, the setup could be flipped with longs set above it or the 50DMA, should the price reclaim it. 25200, downtrend resistance from the record highs, or 25715 are all potential targets. Given the unconvincing price action recently, an obvious bullish reversal signal would be preferable before considering long setups.
The message from RSI (14) and MACD is tilted lower when it comes to directional bias, with the former trending beneath 50, indicating building bearish pressure. MACD remains in positive territory, although having already crossed the signal line from above, at the very least it’s indicating waning topside strength. Given its trajectory, it may soon confirm the bearish signal.
Good luck!
DS

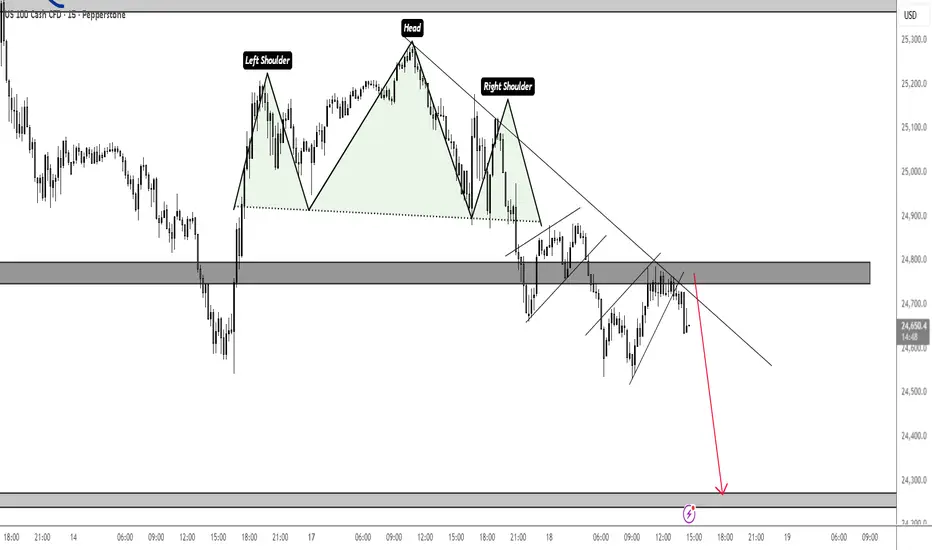
US100 - BEARISHEvening all!
Keeping it simple and short, the dollar is undervalued, and everything (indexes, crypto, precious metals) all melting up at the same time - im anticipating an end to 2025 that see's the dollar rise, and the melt up, melt down!
For US 100 - Target/draw on liquidity is the Weekly STL overall.
NDQ Short catching the sweet double topChart says it all , attempt to catch a double top on NDQ.
Tight stop loss is a must.

nasdaq buyhi evryone the nasdaq index can rise to the specifed target. please don't forget capital managment

NAS100 Trade Set Up Nov 17 2025Price swept PDH and is pushing down towards 1h FVG which i will want to see tested before looking for a reversal back up. There is a daily FVG that will need to be filled this week at 25,800

NASDAQ Can the 1D MA50 give one more rally??Nasdaq (NDX) has been trading within a 6-month Channel Up and Friday saw the price breaking below its 1D MA50 (blue trend-line) and the pattern, but managed to close back above it for the 2nd time in a week (blue circles).
This resembles the September 02 break, which eventually also closed above it and initiated a +9.59% Bullish Leg. With the 1D RSI also testing a similar Support Zone with September's, we expect the index to initiate the new Bullish Leg, as long as it continues to close its daily candles above the 1D MA50.
Our Target is 26900 (+9.59%).
---
** Please LIKE 👍, FOLLOW ✅, SHARE 🙌 and COMMENT ✍ if you enjoy this idea! Also share your ideas and charts in the comments section below! This is best way to keep it relevant, support us, keep the content here free and allow the idea to reach as many people as possible. **
---
💸💸💸💸💸💸
👇 👇 👇 👇 👇 👇

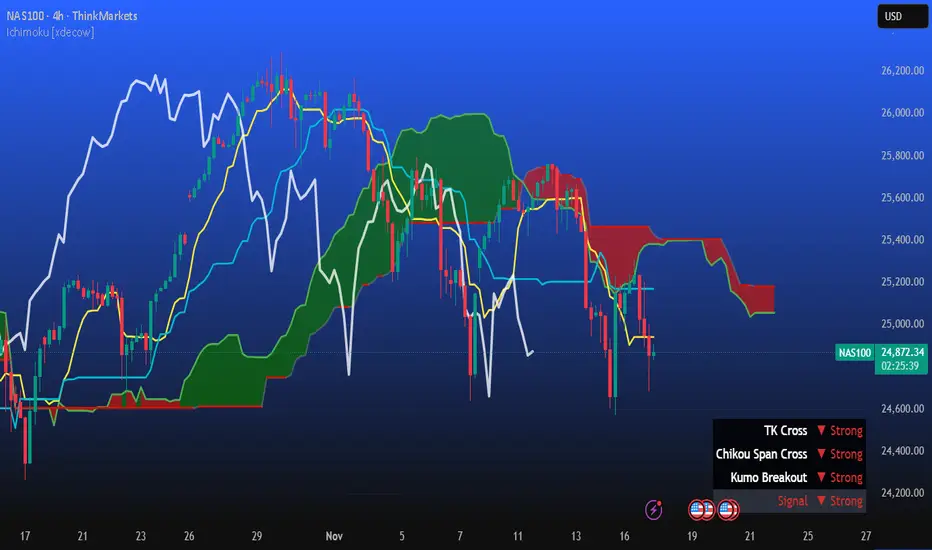
US100US100 is in bearish trend.
No sign of divergence here.
Alligator also indicates price will go down .
We sell at CMP
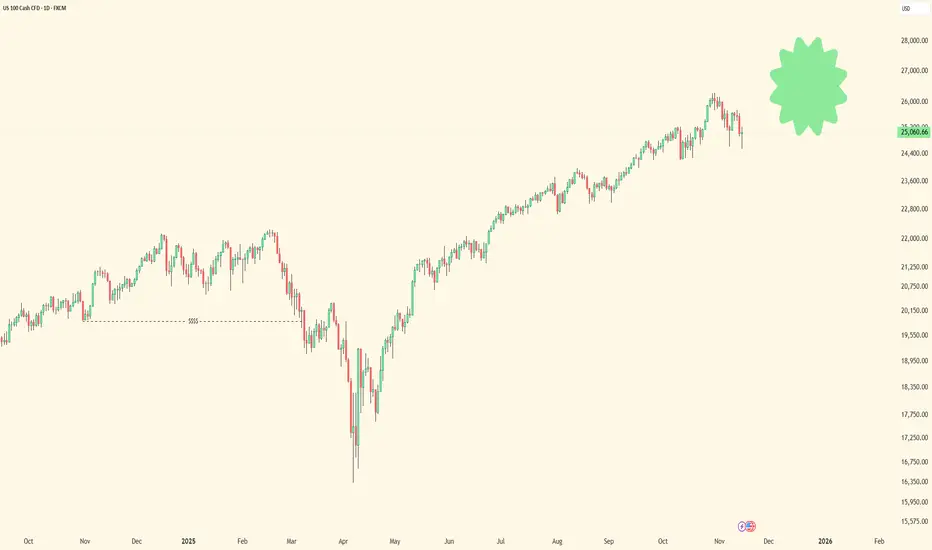
NDX today is the day.🚀 Today is the day that marks a before and after. ⚡️🔥
We haven’t even tasted true tech-sector FOMO yet — not even close.
Right now we’re sitting in the same extreme fear zone we saw back in early April…
and you know exactly what happened next. 😉
Google is leading the charge, showing the path the entire index is meant to follow.
And tonight, NVIDIA provides the fuel ⛽🔥
The rest of the market will move to its rhythm — like an orchestra waiting for the conductor.
Make no mistake:
🎄🚀 A massive Christmas rally is coming.
The kind that leaves you speechless.
The kind people remember for years.
The kind that turns disbelief into FOMO… and FOMO into vertical candles.
Buckle up.
The real move is just beginning. 😉
🔥🚀📈
#TechRally #NVIDIA #GoogleLeading #FearToFOMO #SantaRally #MarketShift #NextLegUp

Long Opportunity on NAS100Any thought on this NAS100 setup? The double bottom was formed on 1hr timeframe and broke the neckline. Looking for the long opportunity after any confirmation of this retest at the neckline

NAS100 Trade Set Up Nov 19 2025Price is still overall bearish on the 4h and daily but price just broke structure on the 1h so i would want to see a sweep of SSL, close above and internal IFVG/CISD to target PDH/BSL

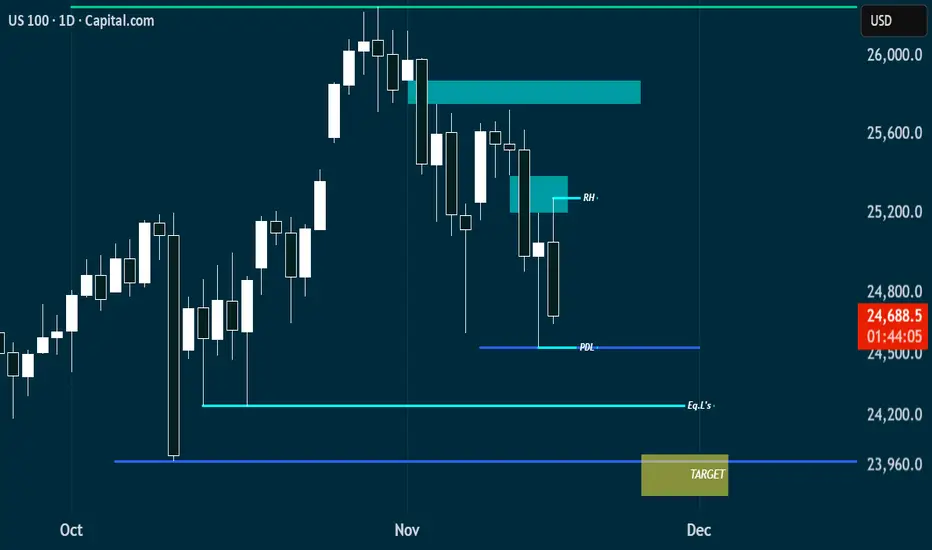
US100 DAILY CHARTNASDAQ100 has a tendency to make a new low. We can see how price has been bearish for couple of days now. I expect price to drop lower therefore, a sell opportunity is envisaged
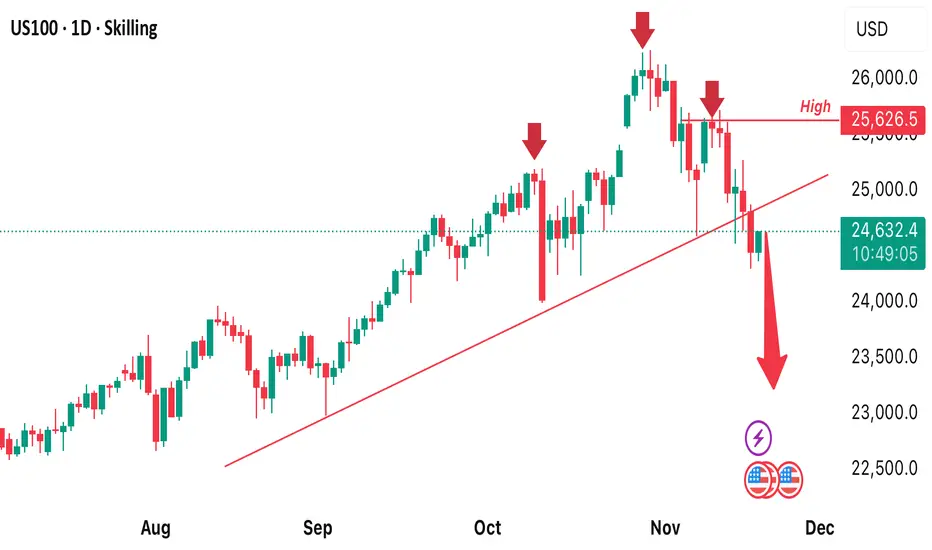
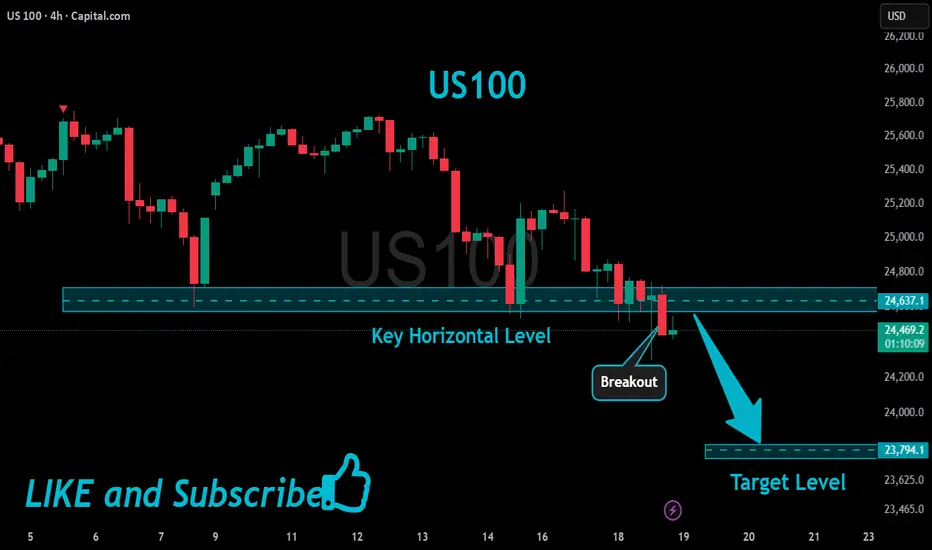
US100 Will Keep Falling!
HI,Traders !
#US100 keeps falling down
And made a strong
Bearish breakout of the key
Horizontal key level of 24637.1
And the breakout is confirmed
So we are bearish biased and
We will be expecting a further
Bearish move down !
Comment and subscribe to help us grow !
US100 Resistance Cluster!
HI,Traders !
#US100 made a bullish
Rebound But has now Near hit a resistance
Cluster of the horizontal and
Falling resistance lines
Around 25395.4 area From where we will be
Expecting a bearish move down !
Comment and subscribe to help us grow !
