Nasdaq 100 Under PressureNasdaq 100 Under Pressure
As the chart shows, the Nasdaq 100 index fell today (point 3) to its lowest level in a month, making it the weakest performer among the major US indices. The sell-off in the technology sector has been driven by a double blow:
→ A reassessment of expectations for the Federal Reserve’s next rate move. According to market observers, the probability of a Fed rate cut on 10 December continues to decline and now stands at 43%, compared with 62% a week earlier.
→ Growing scepticism about the valuations of companies linked to artificial intelligence. A Bank of America fund managers’ survey revealed heavy overcrowding in tech: 54% cited “long Magnificent 7” as the most crowded trade, while 45% viewed an AI bubble as the biggest tail risk.
Technical Analysis of the Nasdaq 100 Chart
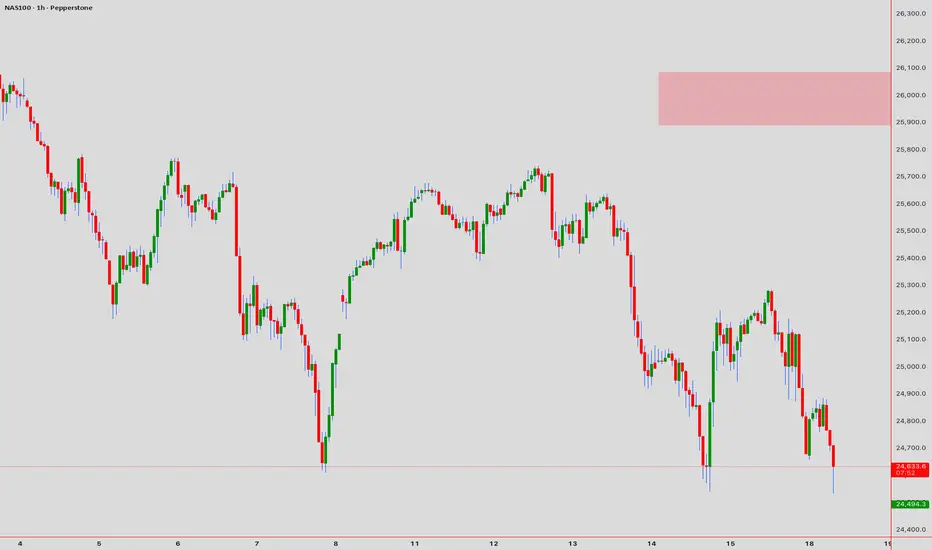
When analysing the hourly chart of the Nasdaq 100 on 10 November, we identified an ascending channel. However, mounting selling pressure has resulted in:
→ the channel being extended downwards;
→ its former lower boundary (which acted as support) now acting as the median line and serving as resistance.
From the demand perspective:
→ The lower boundary of the expanded channel may prevent a deeper bearish move.
→ The chart shows a sequence of false bearish breakouts (1–2–3), where the price dips slightly below the previous low only to reverse sharply upward — signs of a Liquidity Grab pattern that may indicate buyer aggression.
From the supply perspective:
→ The 25220–25415 zone appears to be a confirmed FVG area, where a clear market imbalance emerged and sellers strongly dominated.
Bulls may attempt to push the Nasdaq 100 back into the ascending channel, but whether this scenario plays out will largely depend on Nvidia’s quarterly earnings report — a key event for the technology sector, scheduled for release tomorrow.
This article represents the opinion of the Companies operating under the FXOpen brand only. It is not to be construed as an offer, solicitation, or recommendation with respect to products and services provided by the Companies operating under the FXOpen brand, nor is it to be considered financial advice.
Trade ideas

SIGNS OF WEAKNESS ON NASNAS100 1H - This pair is showing signs of weakness, it looks as though price is respecting these areas of Supply and is continuing to trade us lower. We have also been delivered with a higher timeframe break to the downside.
This is indicating further bearishness in this market, I would personally be looking for short temporarily with this pair, as you can see price is approaching an area of Supply now, this could act as an entry point.
We need to wait for price to trade in, clear this area and give us some kind of entry confirmation before getting involved. We would need to see price break structure to the downside before taking us lower.
I have set an alert and will keep you all updated on whether or not I vet a valid short entry for this pair moving forward, its important we treat this pair with caution.

NAS100 Intraday Market Structure AssessmentActionable Trading Framework
Bullish Scenario (Probability: 60%)
Entry: 24,595-24,620 (consolidation breach confirmation)
Target 1:24,680 (+$62 risk/reward)
Target 2: 24,750 (+$132 profit extension)
Stop Loss: 24,550 (-$45)
Trigger: Break above 24,650 with volume confirmation on 5/15-min charts
Bearish Scenario (Probability: 40%)
Entry: 24,680-24,710 (rejection candle formation)
Target 1: 24,600 (-$80 to +$30 range)
Target 2: 24,520 (-$160 reversal)
Stop Loss: 24,760 (+$50)
Trigger: Failed breakout attempt + RSI divergence on 1-hour chart
Key Technical Confluences
✓ EMA 20/50 Crossover Zone → Dynamic support (1-hour timeframe)
✓ VWAP Alignment → Acts as pivot point at 24,635
✓ Harmonic Pattern → Potential bullish AB=CD completion near current zone
✓ Ichimoku Tenkan-sen → Resistance pressure at 24,705
Execution Rules
1. Entry Confirmation: Engulfing or Pin Bar + Volume Spike on 5-min chart
2. Risk Management: Maximum risk per trade = 1% account size
3. Time Window: Optimal trading 08:00-15:00 UTC+4 (high liquidity period)
4. Exit Protocol: Trail stop at 15-pips after Target 1 achievement
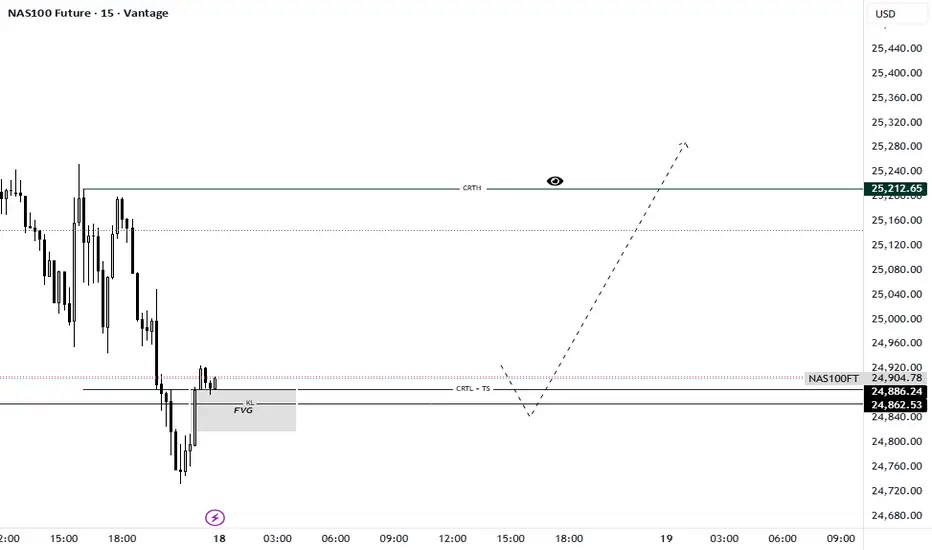
NAS100 Future: The Model #1 Bounce at CRTL SupportTimeframe: 15M | Model: CRT Model #1 / Turtle Soup Reversal
The Nasdaq Index is presenting a high-probability Candle Range Theory (CRT) setup after an aggressive drop. The price action perfectly encapsulates the Manipulation (Candle 2) phase and is setting up for the explosive Distribution (Candle 3) move.
The market has completed a textbook Turtle Soup (TS), aggressively pushing below the structural support to liquidate short-term positions. This hunt was contained by the confluence of the CRTL (Candle Range Theory Low) and a strong underlying Fair Value Gap (FVG).
Here’s the step-by-step breakdown (The CRT Checklist):
Liquidity Sweep: The deep wick confirms the Turtle Soup, clearing the stops below the previous support area around 24,862.53.
Confluence: The reversal attempt is happening right off the FVG area, giving high confidence to the long thesis, as outlined in the CRT Secrets Series (Episode 5: Key Levels).
The Trigger: We are now waiting for the final confirmation—the bullish Model #1 candle close. This candle must reverse the market structure and close decisively above the manipulation low (back into the range).
Targets:
Primary Objective (CRTH): The target is the CRTH (Candle Range Theory High) at 25,217.65, aiming to fill the liquidity above the initial range high.
Mindset: As the chart suggests, this reversal setup has the potential for a swift expansion move, seeking higher liquidity pools.
Discipline: Avoid the temptation to enter early. We must wait for the Model #1 candle to close and confirm the shift in control from sellers back to buyers. Trade what you see, not what you think!
Trade Smart. Trust the Candle Close.
Greetings,
MrYounity
The BreakDown ClubThis is a minimalistic setup that we are seeing for today, an expansion expected. We analyse we wait and see

NASDAQ NASDAQ can start a bullish move from the price zones of 24,767 or 24,682 toward 25,200. However, the 24,530 level is highly critical. NASDAQ:NDX

US 100 Index – NVIDIA Earnings and September Payrolls To Keep TrNovember has been a choppy and volatile period for the US 100 index. After opening the month with a push to a high of 26154 on November 1st concerns about lofty valuations of AI companies, more hawkish than expected Federal Reserve speakers and a US government shutdown have all combined to weaken prices which has seen the index twice dip and recover from support at 24608 (more on this in technical update below).
Now looking forward, sentiment towards technology stocks is going to face potentially its toughest test so far with the release of AI bellwether NVIDIA’s earnings after the close on Wednesday, which is closely followed by the delayed September US Non-farm Payrolls report on Thursday.
Expectations for NVIDIA’s results are high, with Reuters reporting analysts on average expecting the company to post a 54% year-on-year rise in Q3 earnings per share, with optimism for future revenue being driven higher by recent chip supply deals the company has announced with a string of companies such as Samsung. NVIDIA carries a huge 10% weighing in the US 100 index so these results could have a big impact on the direction of prices into the weekend, perhaps even further.
The reopening of the US federal government last Thursday has restarted the release of key economic data updates on the labour market and inflation. The Bureau of Labor Statistics (BLS) has confirmed the September Non-farm payrolls report, originally due in early October, will now be released on Thursday November 20th at 1330 GMT. This update could be important for traders as they try and work out whether the US labour market has weakened enough for Federal Reserve policymakers to be swayed to cut interest rates by 25bps (0.25%) again at their final meeting of the year on December 10th. Recent commentary from Fed speakers has been more hawkish than expected by markets only a month ago, so there may be an extra level of US 100 price sensitivity to the outcome of this release on Thursday.
US 100 Index Technical Update: 24608 Support Holds Again
Last week’s US 100 activity began with price strength on Monday, but this quickly reversed, seeing a retreat of nearly 5% into Friday’s low at (24542, November 14th). Importantly, that decline tested support at 24608, which is the 50% Fibonacci retracement of the August to October advance. This level holding last week maintains potential for prices to stabilise to begin the new week.
Interestingly, a similar rally emerged the previous Friday (November 7th) following tests of the same 24608 retracement support, reinforcing the possibility that buyers are currently still active around this area. While not a guarantee of future price strength, with this level now limiting selling pressure on 2 occasions, this may be viewed as the first important support level for traders to focus on this week.
Potential Support Levels:
With 24608 established as a potential support, closing breaks below this level might be needed to suggest renewed downside pressure, leading to a further phase of price weakness.
A close below 24608 if seen, could then turn the focus toward 24221, which is the deeper 61.8% Fibonacci retracement, with the possibility for extension of price declines to 24004, which is the October 10th session low, increasing if this 24221 support level were to give way.
Potential Resistance Levels:
If 24608 continues to hold selling pressure, fresh attempts at price strength might result. However, it could prove to be the still rising Bollinger mid‑average at 25490 that marks an initial resistance level, with a close above this level needed to suggest risks for the possibility of fresh upside momentum.
If the 25490 mid‑average does give way to the upside on a closing basis, renewed price strength could be the result. Such moves may then open scope for tests of 25742, the November 12th session high, and possibly toward 26277, the October 30th all‑time high.
The material provided here has not been prepared accordance with legal requirements designed to promote the independence of investment research and as such is considered to be a marketing communication. Whilst it is not subject to any prohibition on dealing ahead of the dissemination of investment research, we will not seek to take any advantage before providing it to our clients.
Pepperstone doesn’t represent that the material provided here is accurate, current or complete, and therefore shouldn’t be relied upon as such. The information, whether from a third party or not, isn’t to be considered as a recommendation; or an offer to buy or sell; or the solicitation of an offer to buy or sell any security, financial product or instrument; or to participate in any particular trading strategy. It does not take into account readers’ financial situation or investment objectives. We advise any readers of this content to seek their own advice. Without the approval of Pepperstone, reproduction or redistribution of this information isn’t permitted.


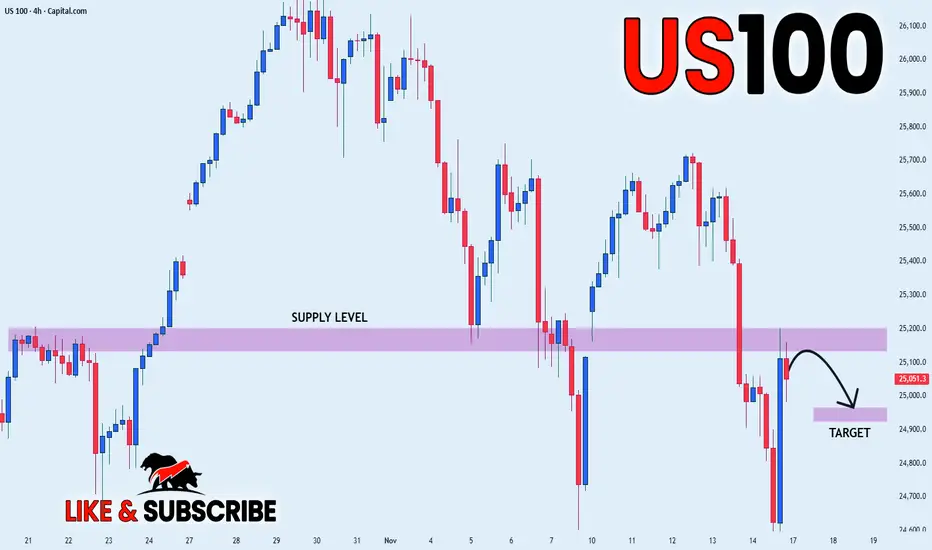
US100 LOCAL SHORT|
✅US100 price rejects the supply block and forms a clean displacement lower, hinting at a draw on liquidity toward the inefficiency below. A corrective retrace before targeting the marked zone is likely. Time Frame 4H.
SHORT🔥
✅Like and subscribe to never miss a new idea!✅
DECODED ANALYSIS OF NDX (NASDAQ) DECODED ANALYSIS OF NDX (NASDAQ)
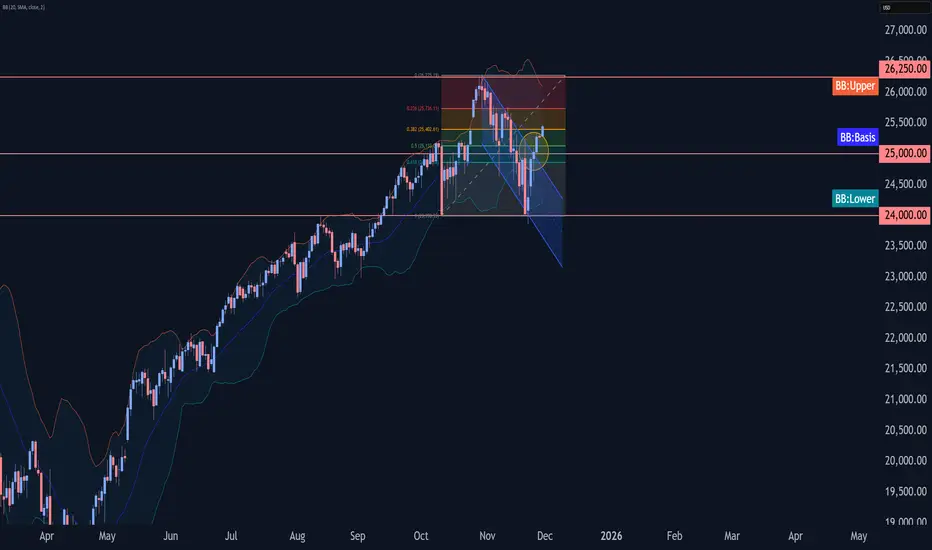
The quarterly first grand pattern is currently in its second last stage, a dip is required, after which a significant upward move will follow.
The key decoded support level is $14,717 in Q4 2026.
Once this grand pattern completes, approx 70% correction will occur, initiating a new grand pattern.That final cycle takes decades to complete it's uptrend.
This message is for educational purposes only, always DYOR.

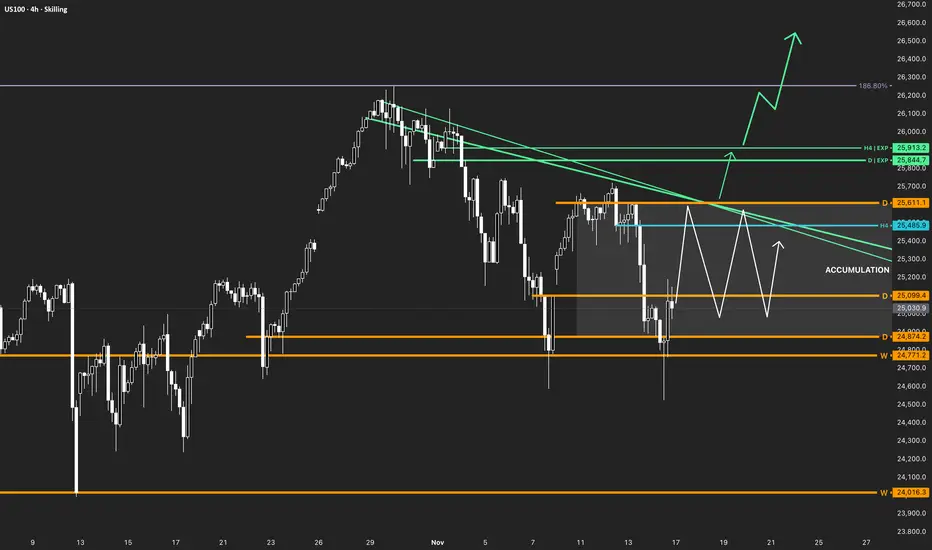
NASDAQ100 (US100) | Accumulation Phase in the Bullish trendHey Traders,
This is a zone where the market usually changes direction a lot, so be careful.
Trend: Primary Bullish
Weekly: 🟢
Daily: 🔴
H4: ⚪️
Phase: Accumulation
Bullish: D Close > 25,611.1 | → 25,844.7 → 25,913.2
Bearish: W Close < 24,016.3
Be Patient!
Peter
NAS1001. HTF crt forming + key level
2. LTF crt + csd
Entry on the second candle of a crt (AMD) Manipulating waiting for distribution

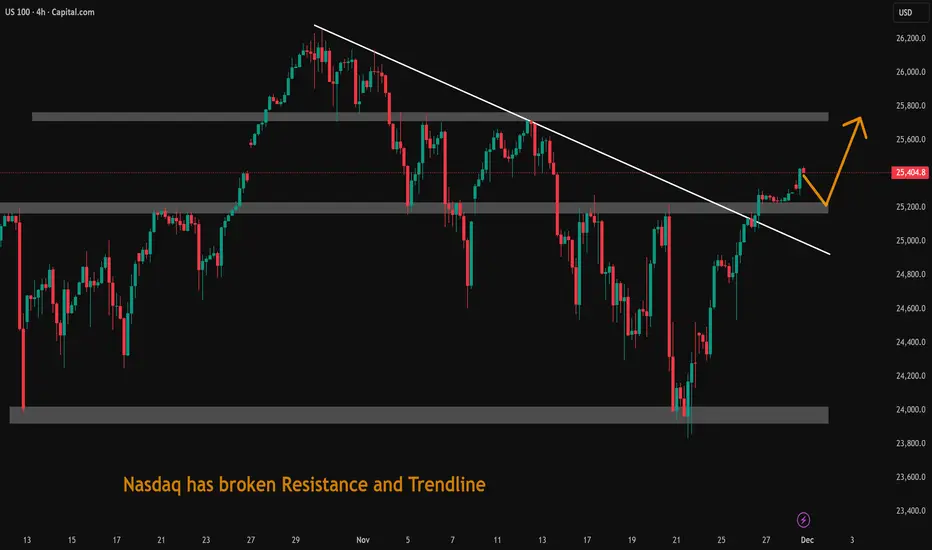
Nasdaq has broken Resistance and TrendlineNasdaq has broken Resistance and Trendline. US economy is doing well. Uptrend may continue.
Nasdaq-100 Wave Analysis – 28 November 2025
- Nasdaq-100 broke resistance zone
- Likely to rise to resistance level 0.3000
Nasdaq-100 index recently broke the resistance zone between the round resistance level 25000.00 and the resistance trendline of the daily down channel from October (which encloses the previous primary ABC correction 2).
The breakout of this resistance zone accelerated the active short-term impulse wave 1 of the intermediate impulse wave (1) from November.
Given strong daily uptrend, Nasdaq-100 index can be expected to rise to the next resistance level 26250.00 (former top of wave (5) from October).
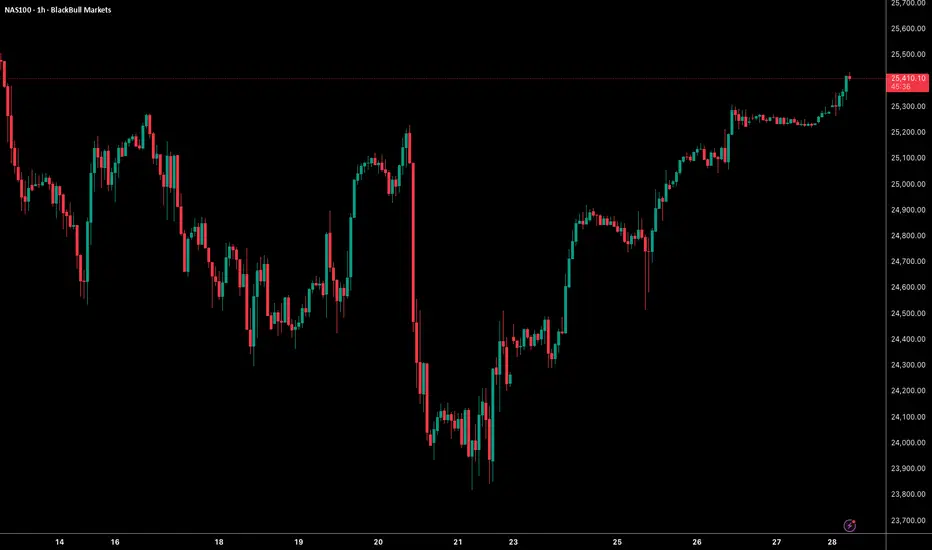
NAS100 – Quick Technical OutlookNAS100 continues its strong rebound after the sharp drop from the 21st. Price has now broken above the 25,350 level, showing sustained bullish momentum with higher highs and higher lows forming throughout the week.
If buyers maintain control, the next resistance sits around 25,500–25,550. A failure to hold above 25,300 could trigger a pullback toward 25,150 before any continuation.
Momentum favors the upside as long as structure remains above the recent breakout zone.
NAS100 Trade Set Up Nov 28 2025Price remains bullish making HH/HL on the 1h. I will want to see a tap in the 4h gap followed but 1m-5m IFVG/CISD to continue higher BSL

Heading into a 2026 bear market ? Tracking NDX, SPX and NIKKEII just want to track the major indices over the next couple of months. There are some signs that could point to a potential major market top around October 30th 2025.
Looking at big US tech, the development of the stock prices over the last 7 months are what you would usually expect in many years. And the market did that despite all the political uncertainty and chaos caused by Washington street. So fundamentals and news don't matter that much.
I'll stick to simple charts without any fancy indicators.
Here is the first one of NDX (US100). Many traders where quite surprised by the move since last Thursday, myself included. But looking at this chart, it makes a lot of sense. Might get invalidated tomorrow, we will see.

Pre market analysis for NAS 27/11/2025No strong set ups showing pre market. Leaning towards a Bullish move. Price comes down after open, tests the previous H4 origin on the topside, deep dives to the Hourly, then bullish move to the H1 polarity above.
Bearish case. Price taps into the hourly break level at the top of the current range before moving down

Nas 100 ready to buy zone Nas 100 ready to buy zone
Entry ( 25240 )
TP 1 ( 25280 )
TP 2 ( 25320 )
SL ( 25220 )

NQ 100 Direction and indicationsWaiting for another indication or reversal from NQ.
Key Levels need to be broken or rejected to tell direction. Generally it is looking like NQ is bearish. Just need to wait for the right time to enter. No trading NQ for the rest of the week due to holidays and lack of Gov data.

Nasdaq Outlook – Accumulation, Early Close & Two Key ScenariosThe Nasdaq is repeating yesterday’s market structure: Asia has accumulated once again, and London is likely to provide the manipulation phase before setting the day’s direction. Today we must also factor in reduced liquidity, as the New York session will close early due to Thanksgiving—this typically increases intraday volatility and can exaggerate moves in either direction.
Technical Setup:
Price is consolidating tightly, showing clear signs of preparation for a breakout. The bullish momentum remains intact as long as the index holds above the 25,000 region, supported by expectations of a potential Fed rate cut in the coming weeks, which continues to fuel risk-on sentiment across equities.
Scenario 1 (Most interesting):
If price breaks the current accumulation to the downside, I will look for long entries in the 25,090–25,020 zone, aiming for a continuation of the bullish rally.
Scenario 2:
If price breaks upward directly from the range, the next bullish target sits around 25,600.
SP:SPX TVC:DXY TVC:VIX CAPITALCOM:US100
NAS100 Trade Secured 1500 PipsTrade played out perfectly, trading above PDH, broke structure to the upside, came down to sweep SSL then engulf and CISD on the 5m-15m to target BSL and higher fib levels

Looking at nas100 today Wednesday 26I will be interested in longs today but there could be a reversal potential
