NASDAQ 100
Sells
The market is showing clear signs of bearishness, evidenced by consecutive breaks of previous lows and sustained higher-timeframe downside momentum. With the daily timeframe continuing to push lower—breaking both the previous weekly low and the current daily low—the broader structure supports further selling pressure.
On the 4-hour (240) timeframe, momentum remains bearish, and price continues to form lower highs, reinforcing the downside bias. Although the market is currently ranging, this consolidation appears corrective rather than reversal-based. Because of this, I anticipate the market will likely continue selling, targeting lower pricing levels on the asset.
Trade ideas

US100 – Missed Entry, but the Structure Was Perfect. Market Structure
The overall trend remains bearish. Price broke strongly below the previous Order Block, confirming sellers are still in control.
2. Order Block + Volume
The bearish OB was formed by a strong impulsive candle with high volume — a clear footprint of smart money. Price retraced but missed the entry zone by just a few points.
3. Liquidity
Before the major drop, price swept the liquidity above and instantly reversed. A classic pattern: liquidity grab → OB retest → sell-off.
4. Retest Logic
Even though the entry was missed, the V-Shark OB structure remained perfectly valid. When you follow the right logic, another opportunity always comes — no need to FOMO.
Conclusion
A missed entry doesn’t mean a bad analysis. It simply means the market didn’t offer the exact fill. Discipline over impulse — always.
Disclaimer
For educational purposes only. Not financial advice.
#VNShark #VSharkOB #OrderBlock #SmartMoneyConcept #PriceAction #Volume #Liquidity #US100 #NASDAQ #TradingView

Market Watch: NASDAQ at a Critical JunctureToday, all eyes are on the NASDAQ as we head into a key earnings release. The index is approaching a pivotal short-term level — the 55-day moving average at 24,091, which aligns closely with the August high of 23,969. With the daily RSI nearing oversold territory around 30, there's a strong chance this level could hold on the initial test.
But here's the catch: the weekly chart is flashing warning signs.
🔍 The weekly RSI has already topped out, suggesting momentum is fading. If the 55-day MA doesn't hold, we could see a deeper pullback toward the 55-week moving average at 22,035, which also aligns with the late 2024 high of 22,222.
This level could be the litmus test for the broader bull trend. A weekly close below it would be a major technical breakdown — and let’s not forget, the NASDAQ often leads the S&P.
Stay sharp. The next few sessions could be decisive.
Not trading advice

NAS100 – Bullish Shift After LL → HL Structure Change (15M)
Price created a final Lower Low (LL) followed by a clean Higher Low (HL), signaling the start of a trend shift.
Market broke short-term structure with a fresh Higher High, confirming bullish intent.
EMAs are compressing and starting to fan upward, showing building momentum.
RSI is trending above the mid-line, supporting continued upside pressure.
A small FVG (Fair Value Gap) below may act as support if price retests.
Trade Plan
Buy Zone: 24,600 – 24,630
Take-Profit (TP): 24,783.3
Stop-Loss (SL): 24,548 – 24,566 (below FVG + EMA cluster)
Why This Setup Makes Sense
Clear structure transition from bearish to bullish.
Fresh HH confirms continuation potential.
EMAs aligned upward with improving momentum.
Clean upside liquidity target at 24,783.
Invalidation
Break and close below 24,548 invalidates the bullish structure.

NAS100 Algo-Driven Breakout & Volatility Matrix# 🚀 NAS100 19th Nov 2025: 🐂 Algo-Driven Breakout & Volatility Matrix 📊
Asset Class: NAS100 (CFD SPOT) | Price: 24,472 | Time: 10:25 AM UTC+4
Executive Summary
Bias: 🐂 Bullish Continuation / Momentum Breakout
Signal: 🟢 Long on Consolidation Break
Confidence: ⭐ High (Volume Confirmation)
Technical Analysis Methodology
Trend: The macro structure remains strongly bullish with price action respecting the ascending channel on the 4H timeframe. Intraday (15m/1H) reveals a Bullish Pennant contracting near all-time highs. 📈
Momentum: RSI (14) hovers at 58.0, indicating room for upside expansion before reaching overbought territory. ⚡
Volatility: Bollinger Bands are squeezing on the 1H chart, a precursor to a high-volatility expansion. VWAP is currently at 24,450, acting as dynamic support. 🌊
Patterns: A Cup and Handle formation is visible on the 1H chart, with the handle currently testing the 24,450 support zone. A successful breakout targets the 24,600 psychological barrier. ☕
Key Levels
🛑 R2: 24,650 (Fib Extension 1.618)
🚧 R1: 24,580 (Recent Swing High)
📍 Pivot: 24,472 (Current Price / POC)
🛡️ S1: 24,420 (EMA 50 / Handle Low)
🧱 S2: 24,350 (Key Structural Support)
Actionable Trade Plan
Strategy: Momentum Breakout & Trend Continuation 🚀
Entry 1 (Breakout): Buy > 24,510 (Volume Confirmation)
Entry 2 (Pullback): Buy @ 24,425 - 24,440
Stop Loss: 24,380 (Below S1/Invalidation Point)
Take Profit 1: 24,580 🎯
Take Profit 2: 24,640 🎯
Disclaimer: Trading involves risk. This analysis is for educational purposes only.
AI-bubble fears dragged USTEC lower.
Alphabet (GOOGL) CEO Sundar Pichai added to the cautious mood, noting that the current AI boom shows signs of irrationality and warning that no company would be immune if the bubble bursts.
Meanwhile, ADP data showed private-sector jobs falling by roughly 2.5k per week over the four weeks to Nov 1, fueling worries about a labor-market slowdown. Fed Governor Waller reiterated his support for a December rate cut, citing ongoing softness and stagnation in the labor market.
This week’s NFP release may shape expectations for further Fed easing and add to market volatility.
USTEC extended its downtrend, breaking below 24525. The diverging bearish EMAs indicate a potential expansion of the bearish structure.
If USTEC breaks below 24300, the index could decline further toward the next support at 24000.
Conversely, if USTEC closes back above 24525, the index may advance toward the next resistance at 25200.

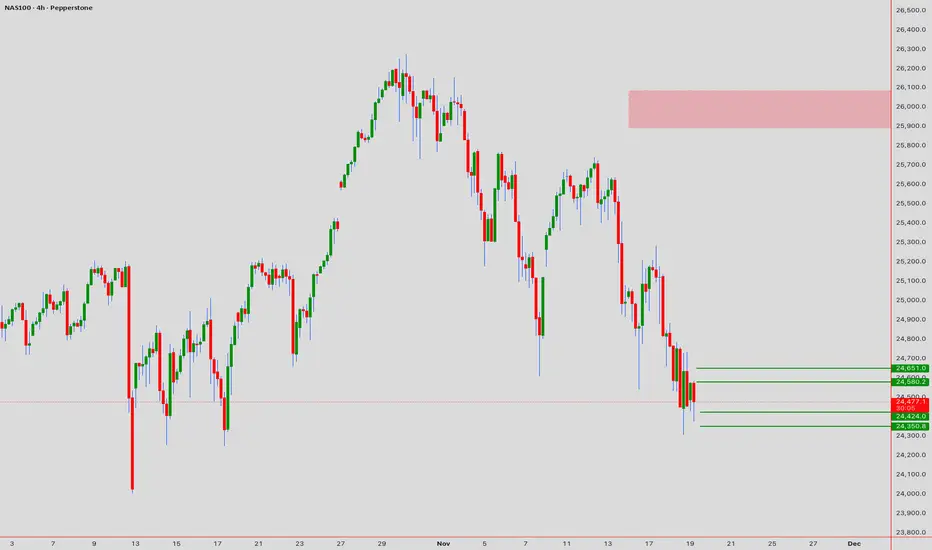
NASDAQ 100 Buy Bias 18/11/2025.
Price is currently trading on the Previous Week Lows, 240 TF low, and Daily Low.
With rejection on the hourly timeframe, break of structure on the 15M and equal lows we can anticipate for a buy.

US100 SELL ANTICIPATIONUS100 has shown the willlingness of going lower. Price has violated the H1 Bullish +FVG making it an inversion. We have lots of liquidity around 24541.7 making it the most probable draw.

NASDAQBased on the current situation, the NASDAQ continue in bearish movement and try to break the support as marked in the chart. Looking forward to find a sell setup and seeing what happens on the next movement.

Bullish move for NasDaqI'm buying for NasDaq tomorrow, but I have 2 Key Levels that I'm eyeing. But looking at the daily time frame I'm leaning more towards the 2nd area to enter the market tomorrow.


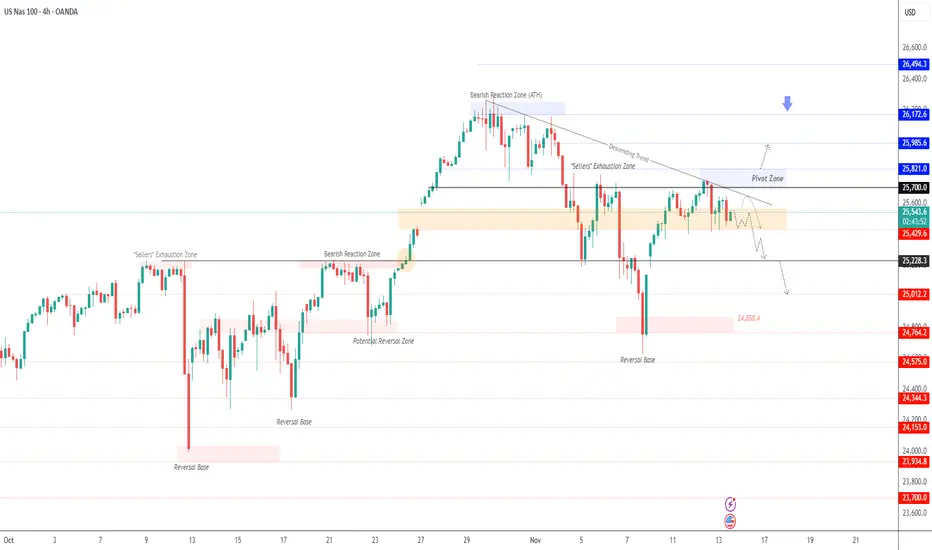
Tech Sector Pauses|USNAS100 Awaits Direction Between 25430–25700USNAS100 | Overview
The price is currently consolidating between 25430 and 25570, showing a slight bearish bias as momentum weakens near resistance.
As long as the index trades below 25570 and 25700, the outlook remains bearish, with downside potential toward 25430 and 25220.
A confirmed break below 25220 would accelerate losses toward 25010.
However, if the price closes a 4H candle above 25700, it would signal a bullish reversal, opening the path toward 25820 and 25985.
Pivot Line: 25570
Resistance: 25700 · 25820 · 25985
Support: 25430 · 25230 · 25010
NASDAQ Pressure Still to The DownsideI know many a people are anticipating new ATHs here but I beg to differ.
I think pressure to the downside will likely resume. I am just waiting patiently to see how far up the bullish correction goes so I can continue to short. Or alternatively, a break and retest of the current H1 support if price does not pull back up.
My overall bias is still bearish here.

NAS100 INTRADAY TECHNICAL ANALYSIS ═════════════════════════════════════════════════════════════════════
NAS100 INTRADAY TECHNICAL ANALYSIS & MARKET OUTLOOK
November 17, 2025 | 10:30 AM UTC+4 | Current Level: 25,187.5
═════════════════════════════════════════════════════════════════════
CRITICAL SUPPORT & RESISTANCE LEVELS
RESISTANCE ZONES (Sell Targets):
R1: 25,245.80 (First Profit Zone - 58.3 points) | RSI 65-70 zone
R2: 25,335.40 (Intermediate Target - 147.9 points) | EMA 20 confluence + Rising Wedge apex
R3: 25,445.20 (Strong Resistance - 257.7 points) | Weekly pivot + Gann 1x1 angle
SUPPORT ZONES (Buy Opportunities):
S1: 25,115.20 (Initial Support - 72.3 points) | 15m Bollinger Band lower band
S2: 25,010.60 (Intermediate Support - 176.9 points) | SMA 50 daily + Gann angle
S3: 24,885.40 (Strong Support - 302.1 points) | Harmonic AB=CD node
CURRENT PRICE ACTION
Index rallying after Wyckoff accumulation completion. Price above EMA 20/50 on 4h = bullish confirmation. Bollinger Bands expanding—breakout phase active. RSI at 62 (bullish) on 1h suggesting momentum continuation. Rising Wedge pattern on 30m approaching apex breakout. Volume surging into US session. Ichimoku cloud bullish alignment below price.
═════════════════════════════════════════════════════════════════════
ENTRY & EXIT SETUPS - INTRADAY EXECUTION
═════════════════════════════════════════════════════════════════════
BULLISH SETUP (Optimal on 5m/15m continuation):
ENTRY: 25,210.40 (Break above 25,200 resistance + candle close confirmation)
STOP LOSS: 25,140.00 (Beneath S1 by 0.20 risk buffer)
TARGET 1: 25,245.80 (35.4 points) | Scale 50% profits
TARGET 2: 25,335.40 (125 points) | Scale 30% profits
TARGET 3: 25,445.20 (234.8 points) | Hold 20% to runner with trailing stop at 25,380
RISK/REWARD: 1:6.2 ratio | Risk 70.40 to win 437.25
BEARISH SETUP (Optimal on 1h wedge apex rejection):
ENTRY: 25,160.50 (Break below support + rejection candle formation)
STOP LOSS: 25,235.00 (Above R1 by 0.20 risk buffer)
TARGET 1: 25,115.20 (45.3 points) | Scale 50% profits
TARGET 2: 25,010.60 (149.9 points) | Scale 30% profits
TARGET 3: 24,885.40 (275.1 points) | Hold 20% with trailing stop at 24,935
RISK/REWARD: 1:3.8 ratio | Risk 74.50 to win 283.25
═════════════════════════════════════════════════════════════════════
TIMEFRAME-SPECIFIC TACTICS
═════════════════════════════════════════════════════════════════════
5-MIN SCALPING: Monitor Rising Wedge squeeze. Target 15-22 points on wedge breakout. Tactical range 25,175-25,210. Volume surge = apex confirmation.
15-MIN SWING: Head & Shoulders potentially forming on rejection. RSI divergence at 25,245 = sell signal. Hold 45-65 points per trade.
30-MIN POSITION: Rising Wedge apex critical—breakout within 60 minutes. EMA 9/21 bullish cross validated. Harmonic ratios at R2 confluence.
1-HOUR MACRO: Gann 1x1 angle support at 25,010. Price must hold above 25,160 for continued upside. Ichimoku Tenkan-sen/Kijun-sen bullish alignment. Wyckoff markup phase accelerating.
4-HOUR BIAS: Daily pivot at 25,115 institutional support. Close above 25,245 = sustained rally to R3. Gann Square of 9 confluences: 24,885 (S3), 25,187.5 (current), 25,445 (R3). Below 25,160 = triangle breakout to downside.
═════════════════════════════════════════════════════════════════════
SESSION EXECUTION RULES
═════════════════════════════════════════════════════════════════════
✓ ENTRY ONLY on candle close confirmation (not wick touch)
✓ STOP always 0.20-0.40 points BEYOND level (never AT exact level)
✓ SCALE profits: Take 50% at R1/S1, 30% at R2/S2, trail 20% to R3/S3
✓ Rising Wedge apex breakout = directional confirmation signal
✓ IF price closes below 25,115 or above 25,245 = trend acceleration likely
✓ Maximum 3 trades per session. Exit after 2 consecutive losses
✓ Volume confirmation mandatory—low volume = false breakout likely
✓ Gann angle violation = position review trigger
═════════════════════════════════════════════════════════════════════
Risk Disclaimer: Analysis is educational. Past performance ≠ future results.
═════════════════════════════════════════════════════════════════════

US Tech 100 Cash (NAS100 / NASDAQ) Recorded: 11/17 – 1:52Thesis:
Price swept prior liquidity and printed aggressive delta absorption at the demand zone. Despite selling imbalance, buyers continued to lift the offer, signaling passive accumulation rather than continuation selling. This aligns with the current higher-timeframe trend structure.
Footprint Evidence:
Large negative delta absorbed at the lows (2.9K → 3.3K stacked).
No follow-through selling despite footprint imbalance.
Subsequent candle printed trapped sellers and initiated responsive buy programs.
Cumulative delta failed to make a lower low → bullish divergence.
Market Context:
NASDAQ remains in a trending environment with controlled pullbacks. Current positioning shows willingness from larger participants to defend the zone rather than liquidate. As long as price remains above the absorption block, bullish continuation remains the higher-probability play.
Trade Logic:
Entered on absorption confirmation. If price reclaims the imbalance above, I expect continuation toward liquidity at the previous session high.
Invalidation is below the absorption block, where passive buyers failed.
Summary:
Smart money absorbed sell pressure at demand, trapped shorts, and rotated the auction higher. Bias remains long until structural invalidation.


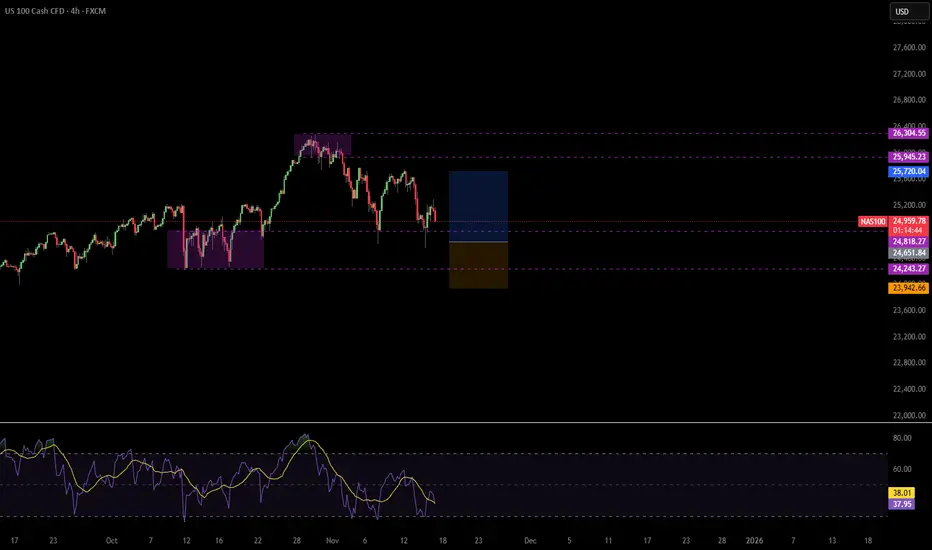
US100 | Bullish Reversal From Demand Zone — Targeting 25,200 LiqUS100 has reacted strongly from the 24,400–24,900 major demand zone, showing a sharp rejection and reclaiming structure. Price is now building momentum toward the 25,200 buy-side liquidity level.
A clean consolidation + breakout pattern is forming just below liquidity, indicating potential continuation to the upside.
Market Breakdown:
HTF Bias: Bullish
Demand Zone: 24,400 – 24,900
Intraday Target: 25,201 liquidity zone
Extended Target: 25,722 (major buy-side liquidity)
Confirmation: Break & retest above 25,100
Invalidation: Clean break below 24,950

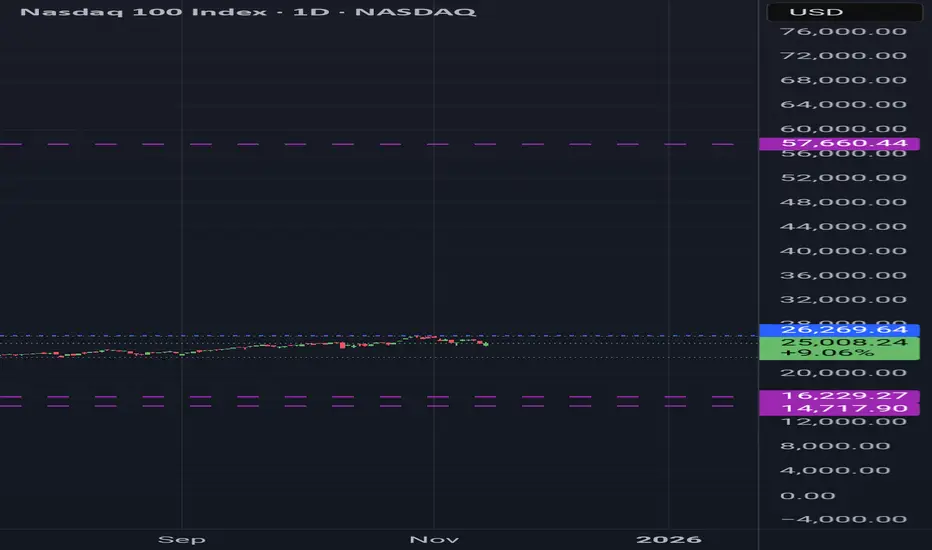
DECODED RESISTANCE ANALYSIS NDX (NASDAQ)DECODED RESISTANCE ANALYSIS NDX (NASDAQ)
After testing the support at $14,717 in Q4 2026 (as mentioned yesterday in my post), the stock market will rise to reach a new high over the next four years, with the DECODED resistance at $57,660, marking the end of the first Grand cycle.
Once the first Grand cycle ends, a huge correction will occur. The market will turn bearish and decline over the next 19 years, forming lower highs. During this period, the market will drop to the support level $16,229.
The second Grand pattern will form around 2050/2051.
I see what others call impossible, every support and resistance I draw is already written. I do not predict, I decode, even in uncharted areas.
This message is for educational purposes only. Always DYOR.
NAS100US100 4H CHARTUS100 4H — Price reacting near 0.382 Fib (25,484) after impulsive move. Current zone may act as inducement for deeper liquidity sweep into 0.5/0.618 (25,394–25,304). Watching for displacement and BOS above 25,741 to confirm bullish intent. If price sweeps 0.618 and leaves bullish PA, that’s my POI for long setups.

$QQQ: Doubtful Low The QQQ is currently showing a lower high and a lower low, indicating a likely corrective Zig Zag pattern, with wave C only slightly longer than wave A. The 1x1 Extension is positioned at 586. Last Friday's promising bounce was halted at the horizontal resistance level of 613.
The RSI has reached the same area where previous bounces occurred during the rally from the April low. The bulls need to demonstrate that last Friday's low can serve as a springboard for a recovery.

BULLISH ON NASThe 4HR tf had a break of the low, created a new low with a morning star that gave us a change of character toward the upside and pulled back with 2 bearish rejecting candles and now is starting to push up without a bullish engulfing candle. Details are more visible on the 2Hr tf.
