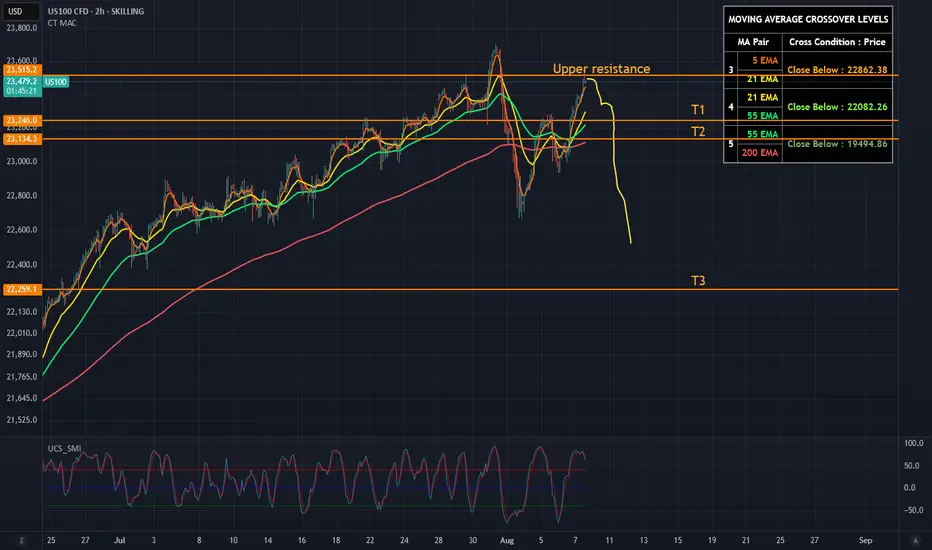
US100: Near All Time Highs, Weak FoundationThe Nasdaq 100 (US100) is hovering near all-time highs (~23,500), but signs of exhaustion are mounting. Momentum is fading, RSI is overstretched, and volume has been declining - all classic symptoms of a tired rally.
From a technical perspective, the index is pressing against upper trendline resistance after an aggressive multi-week run. Price action shows weakening follow-through on each new high, hinting at buyer fatigue. Best example was the huge sell-out last week.
Fundamentally, the rally is losing its foundation:
- Earnings surprises from Big Tech (Apple, Shopify) are already priced in.
- AI hype is cooling off, and valuation multiples remain extreme.
- Macro data (ISM Services, jobs) suggest economic softness.
- Fed rate cut hopes are baked in — any disappointment could trigger a sharp repricing.
Conclusion for me:
The Nasdaq looks ripe for a pullback.
We may possibly see a short spike above my drawn "upper resistance line" but I'm pretty convinced we won't see new ATH, - in my opinion it would be just a stop hunt.
If 23,000 then breaks, watch for acceleration toward 22,500 and beyond. The air is thin up here.
T1: 23250
T2: 23100
And if we get the break - I see T3 - 22250
One unpredictable variable, though? The world’s leaders.
Their "creative" decision-making has the power to nuke any technical setup.
Markets may follow charts and earnings - until a politician wakes up and chooses chaos.
No trading advice, just my ideas. :)
NAS100FT trade ideas
NasdaqAs said before, nasdaq going down, can take out highs then plummet, but time will tell. PS: my previous posts got removed. View auto supply and demand zones indicator. Dm me free for a month free. (It draws snd zones).

NQ ATHYou can see as clear as possible that we are in an uptrend and we're getting a NEW ATH BABYYYY!!! <3
Nasdaq Pumping High, We Might Ride The WavePrice today(Wed) is recovering from yesterday's (Tue) dumping. Our bullish direction is still intact.
Entries should be taken once, price has entered within our Area of Opportunity.
Targets with their success rate have been outlined on the charts.

NASDAQ Potential UpsidesHey Traders, in today's trading session we are monitoring NAS100 for a buying opportunity around 23,300 zone, NASDAQ is trading in an uptrend and currently is in a correction phase in which it is approaching the trend at 23,300 support and resistance area.
Trade safe, Joe.

A Structure-Based Pattern FormationWe have 2 things happening on the NASDAQ. 1) Price ended the week retesting the zone of our previous highs & 2), in doing so it's also formed a completed bearish bat pattern.
If you have any questions or comments, please leave them below.
Akil

Nasdaq Week 33 Possible OutlookAre we ready to drop this coming week? Lookout for reversal/continuation pattern under smaller TF.

NAS100 – Eyeing 23,700.0 ResistanceNAS100 continues its bullish momentum, breaking above the 23,480.0 zone after a strong rally. Price is now approaching the 23,700.0 resistance, with short-term support building near 23,480.0. A retest of support before another push higher remains likely.
Support at: 23,480.0 🔽 | 23,280.0 | 22,960.0 | 22,720.0
Resistance at: 23,700.0 🔼 | 23,850.0
🔎 Bias:
🔼 Bullish: Holding above 23,480.0 and breaking 23,700.0 could extend gains toward 23,850.0.
🔽 Bearish: Failure to hold 23,480.0 may lead to a deeper pullback toward 23,280.0.
📛 Disclaimer: This is not financial advice. Trade at your own risk.

Strong sell us100Pair overbought on H1 and h4 tine frame
Strong selling area reached
We expecting the big drop from this level when market open

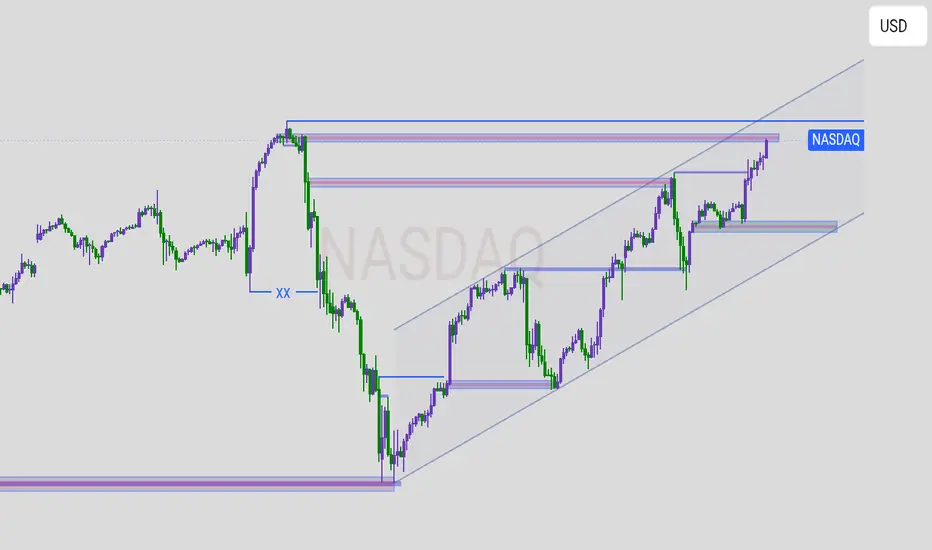
NASDAQ (US Tech 100) chart
Here’s the simple breakdown:
* Price is moving upward inside a rising channel
* This means NASDAQ is currently bullish.
* The price is **near the top resistance** of the channel.
* There’s a **horizontal blue resistance zone** where price has struggled before — it’s testing that level again.
* If price **breaks above** this zone, it could continue climbing toward the upper channel line.
* If price **fails** to break, it may drop back to the **nearest support zone** (the lower rectangle).
Resistance:
The top horizontal blue zone — price must break and hold above it for more upside.
* **Support:** Two blue rectangles below show where price might bounce if it drops.
* The middle support is also in line with the **channel’s lower trendline** — a strong bounce area.
* **Bullish bias**
while inside the channel.
* Watch for a **break above resistance** for a big push up, or a **rejection** for a short-term pullback to support.
NASDAQ-100| Bullish Bias📌 Higher Time Frame (4H/2H) Context
• Market remains bullish, currently in push phase toward 4H highs.
• No sweep or mitigation at the previous 4H order block — price pushed higher with strong momentum.
• 4H Demand Zone: 22,576 – 22,376
• Liquidity at 22,955 cleared → room for continuation to higher targets.
⸻
⏳ Lower Time Frame (30M/5M) Confirmation
• 30M structure refined, bullish order flow intact.
• Current liquidity resting near 23,400.
• Watching 30M OB: 23,322 – 23,222 for a pullback, liquidity sweep & inducement.
⸻
🎯 Execution Plan
• Entry Zone: 23,321 – 23,221 (refined OB)
• Stop-Loss: 23,225
• TP1: 5M + 30M structural highs
• 30M Structural High Target: 23,714
⸻
🧠 Mindset Note
Patience is key — wait for price to pull back into the OB zone and give lower time frame confirmation. No chasing. Let liquidity sweep first, then execute.

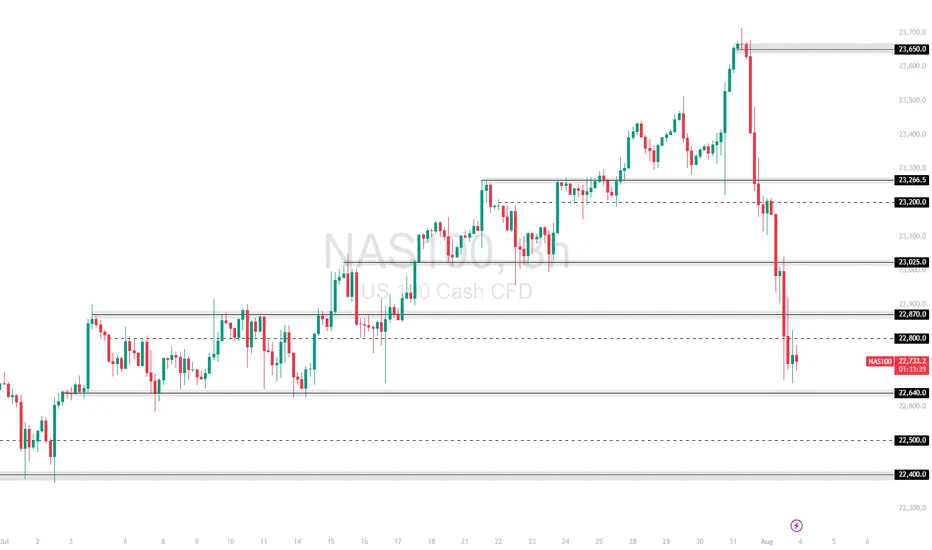
NAS100 Slammed by Fed Data and Trump Trade Remarks Can 22,640 ?The NAS100 plunged after strong US economic data fueled expectations of tighter Fed policy, and Trump's renewed push for aggressive trade deals rattled tech sentiment. After rejecting the 23,665 🔼 resistance, the index dropped sharply through multiple support levels.
Price is now consolidating just above the 22,640 🔽 zone, a key near-term support.
Support: 22,800 🔽, 22,640 🔽, 22,500 🔽
Resistance: 23,025 🔼, 23,277 🔼, 23,332 🔼
Bias:
🔽 Bearish: A breakdown below 22,640 could trigger a move toward 22,500. If that fails, 22,400 becomes the next target.
🔼 Bullish: A reclaim of 23,025 would be the first sign of bullish recovery.
📛 Disclaimer: This is not financial advice. Trade at your own risk.
US100 Local Long!
HI,Traders !
#US100 made a retest
Of the horizontal support
Level of 23266.0 from where
We are already seeing a
Local bullish rebound so
We will be expecting a
Further bullish move up !
Comment and subscribe to help us grow !

NAS100 Reversal Confirmed: Is the Rally Over?The NASDAQ 100 (NAS100) may have just hit its ceiling. In this video, I break down the technical evidence pointing to a confirmed reversal—including key candlestick formations and indicator signals that suggest the recent rally is losing steam.
The bearish engulfing candle on both the daily and weekly, along the monthly RSI divergence is signaling a deeper correction. Our initial target for this week is the previous high with a bounce for a much deeper correction which will be analyzed next week so stay tuned to all my updates and new publications. Thank you and have a great trading week. Cheers!!

Strong sell NAS100We are looking for a drop on H1 time frame
H1 , H30 ,h4 already overbought pair
Selling area looking strong enough to change the trend shortly

Nasdaq may consolidate in channalNasdaq may consolidate in channal. Waiting some big news to trigger.

NDX & SPX , Stay heavy on positionsNDX & SPX , Stay heavy on positions. (QLD, TQQQ)
Despite the rebound, the market remains tilted toward hedging and caution.
In stay light on positions zones, I hold QQQ and reduce exposure.
In stay heavy on positions zones, I increase allocation using a mix of QLD and TQQQ.

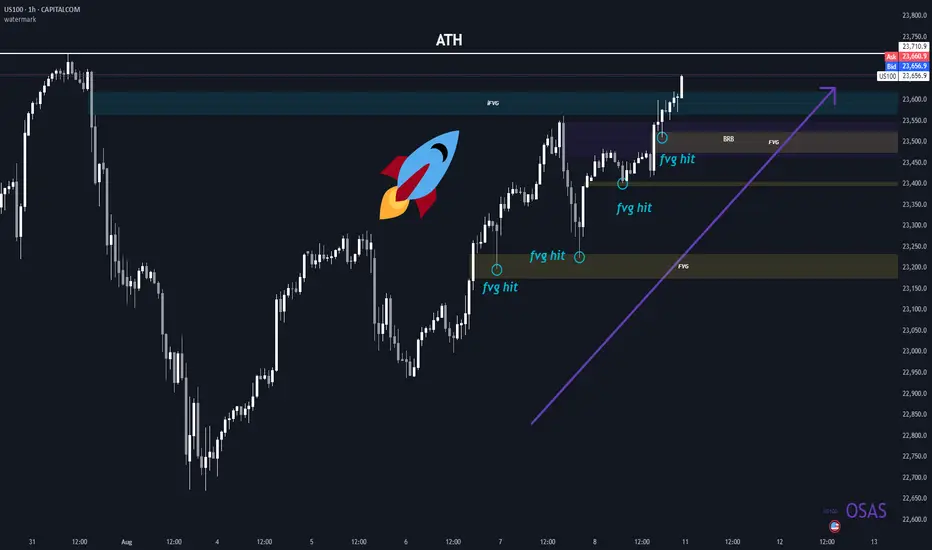
Sunday pre market analysistake the liQ from Junes high then
possible hit the 4H FVG if not just continue
upwards into September

when to change your session bias and Take profit, YM! Long1. This video demonstrate when you should change you bias for the session, sometimes before session price action quite confusing but when you add SMT and strength switch concept to you bias you will see true price intention where it will go.
2. Always take entry or profit one level to another level, price always go from one level to another level.
3. This video I try to demonstrate how to take profit when you have to level to target, always look for the correlated instruments to build bias

Nasdaq long position Nasdaq long position update. Nasdaq is still going as predicted and is about to hit the set target of 24,000. Recently Nasdaq retested a support of break-out and retest and continued with the bullish momentum. Nasdaq is set to thrive even higher to a price of 25,000.

NSDQ100 sideways consolidation support at 23045Nasdaq 100 Market Summary – August 8
Markets remain cautious, with a mix of corporate and macro developments driving sentiment.
Gold futures surged after the US unexpectedly imposed tariffs on one-kilo and 100-ounce gold bars. The move surprised traders and added fresh uncertainty to the metals market. Oil prices stabilized following a recent decline, as attention shifts to potential diplomatic developments, including a possible Trump-Putin meeting.
In the tech sector, Tesla scrapped its Dojo supercomputer project, a blow to its in-house AI and self-driving ambitions. This comes just weeks after Elon Musk said he was doubling down on the effort. The departure of the project’s lead adds to investor concerns. Meanwhile, Intel’s CEO responded to political pressure by reaffirming his board’s support, as Trump called for his resignation over alleged conflicts of interest.
On the economic front, the latest jobless claims data brought some relief after last week’s soft payrolls report. Initial claims rose slightly to 226,000, just above the 222,000 forecast. However, continuing claims came in higher at 1.974 million, with most of the increase seen in California—likely due to seasonal factors. Additionally, the New York Fed’s July survey showed a rise in both inflation expectations and concerns about the job market.
Conclusion for Nasdaq 100 Trading:
The tone remains cautious. Disruptions at major constituents like Tesla and Intel may drag on sentiment, while macro uncertainty—rising geopolitical tensions, new tariffs, and unstable commodity markets—adds to headwinds. Traders may rotate into defensives or software names with lower exposure to AI hardware or international trade risks. Expect range-bound trading with elevated volatility until clarity emerges on US-Russia diplomacy and the true extent of tariff impacts.
Key Support and Resistance Levels
Resistance Level 1: 23700
Resistance Level 2: 23900
Resistance Level 3: 24085
Support Level 1: 23045
Support Level 2: 22870
Support Level 3: 22675
This communication is for informational purposes only and should not be viewed as any form of recommendation as to a particular course of action or as investment advice. It is not intended as an offer or solicitation for the purchase or sale of any financial instrument or as an official confirmation of any transaction. Opinions, estimates and assumptions expressed herein are made as of the date of this communication and are subject to change without notice. This communication has been prepared based upon information, including market prices, data and other information, believed to be reliable; however, Trade Nation does not warrant its completeness or accuracy. All market prices and market data contained in or attached to this communication are indicative and subject to change without notice.

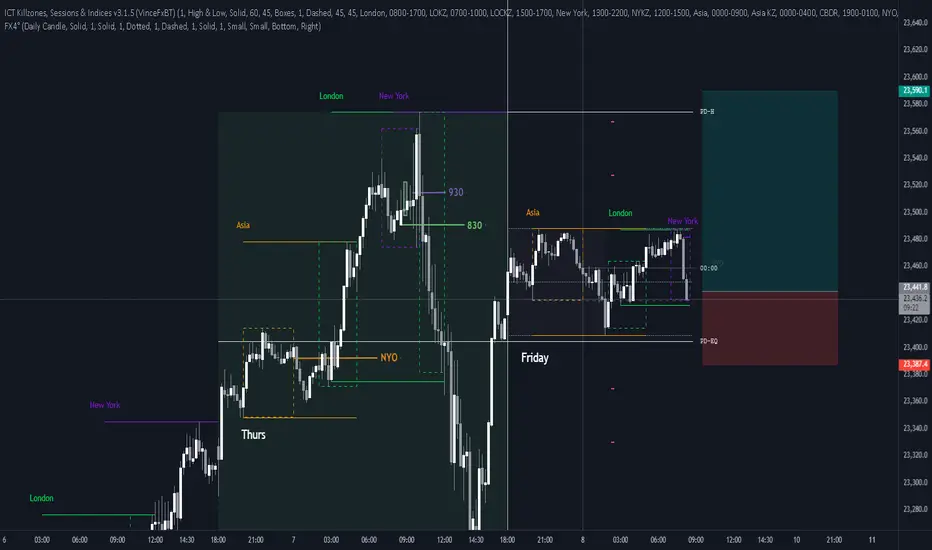
Long NQFriday so be ware
Asia and London left clean highs
We are on a down leg at OTE but it just looks to clean to sell
USNAS100 Volatile – Key Level at 23440 in FocusUSNAS100 – Market Overview
The indices market remains highly volatile following the latest developments regarding the Federal Reserve Chairman.
The situation remains tense, with the possibility of one rate cut this year still on the table.
Technical Outlook
Bullish Scenario:
Stability above 23440 will keep bullish momentum intact, targeting the All-Time High (ATH) at 23690, with further potential toward 23870.
Bearish Scenario:
A 1H close below 23430 would shift the bias to bearish, targeting 23295, and possibly lower.
Resistance: 23570 – 23690 – 23870
Support: 23295 – 23180 – 23045
