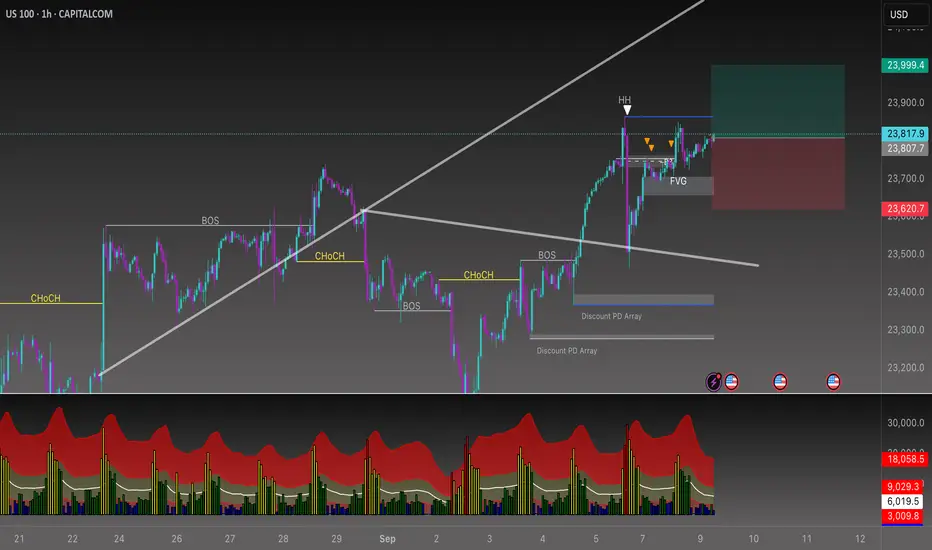
Beyond the Chart – NAS100 Through Technicals & Fundamentals📈 CAPITALCOM:US100 1H
• Strong bullish structure with HH in play.
• Liquidity grab above highs, now consolidating.
• Key support: 23,700 FVG – holds = next leg to 24K+.
• Failure = pullback into discount zones (23,400–23,200)
NAS100FT trade ideas
Nasdaq 100 Eyes New ATH if CPI Undershoots ExpectationsUSNAS100 – Overview
The Nasdaq will trade under CPI pressure today, with volatility expected around the release.
📉 Bearish scenario: While below 23,870, momentum favors a move toward 23,695, with further downside risk to 23,510 → 23,280.
📈 Bullish scenario: A reversal and stabilization above 23,870–23,940 would open the path toward 24,090 and a new ATH near 24,240.
⚠️ CPI impact:
Below 2.9% → supports bullish continuation for indices.
Above 2.9% → likely triggers bearish momentum.
Key Levels
Pivot: 23,870
Resistance: 24,090 – 24,240
Support: 23,695 – 23,510 – 23,280

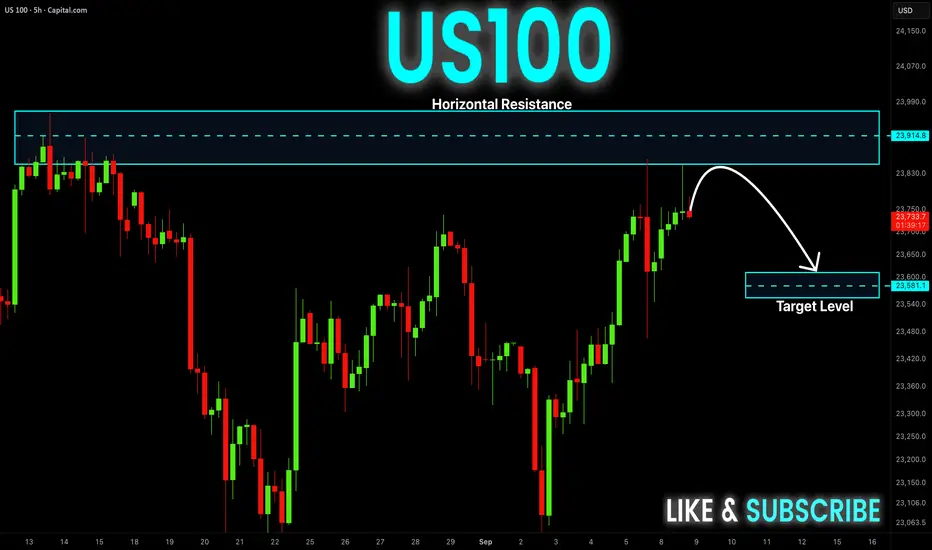
US100 Resistance Ahead! Sell!
Hello,Traders!
US100 keeps growing
In an uptrend but the
Index will soon hit the
Horizontal resistance
Of 23,970 from where
We will be expecting a
Local bearish correction
Sell!
Comment and subscribe to help us grow!
Check out other forecasts below too!
Disclosure: I am part of Trade Nation's Influencer program and receive a monthly fee for using their TradingView charts in my analysis.

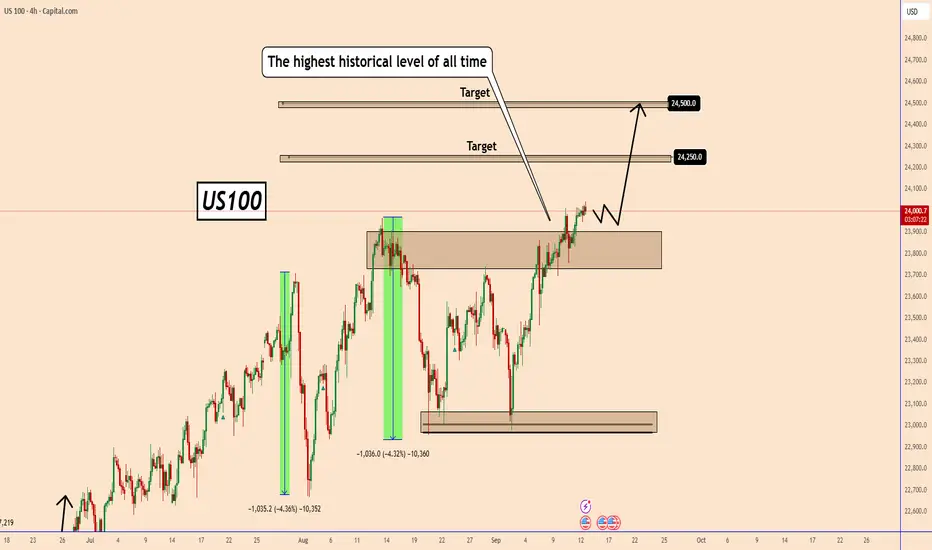
US100 Hits All-Time HighUS100 Hits All-Time High
Yesterday, US100 reached a new record high at 24040, confirming the strength of its bullish trend.
With U.S. inflation cooling, the market is now expecting the Federal Reserve to cut interest rates, possibly starting this cycle and continuing in the months ahead.
Lower rates tend to support stocks and indices, giving the economy room to breathe after a long period of tight monetary policy.
I expect US100 to continue rising toward 24500, with intermediate targets at 24250 and 24500 in the coming week.
You may find more details in the chart!
Thank you and Good Luck!
❤️PS: Please support with a like or comment if you find this analysis useful for your trading day❤️
NAS100 | Bearish DivergenceNAS100 has formed bearish divergence on 1hr TF as well as on 4 hr TF which is quite a strong signal that the due correction is around.

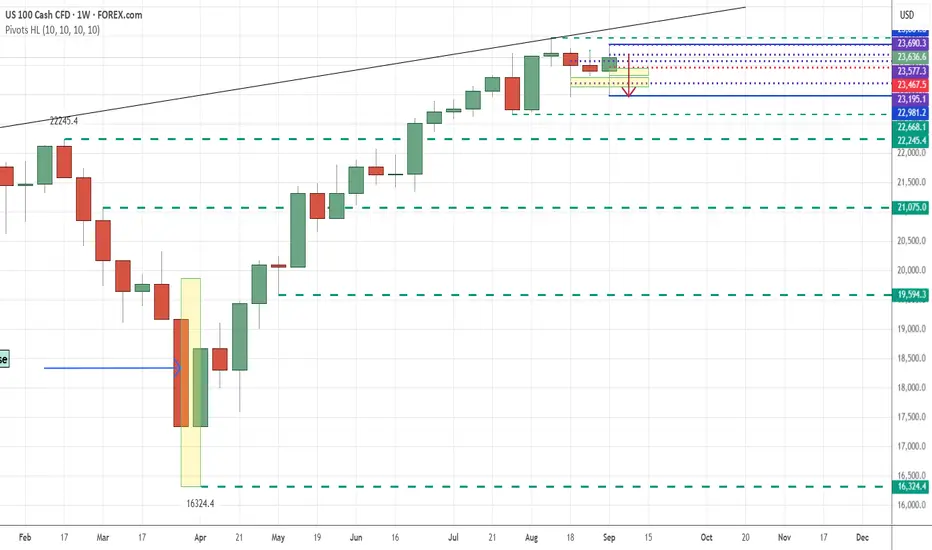
NAS100 Bearish Reversal from Supply Zone – Short SetupThe NAS100 (1H chart) is trading within a channel structure marked by a rejection line (resistance) and a support line. Price recently broke below the EMA (70 & 200), showing bearish momentum.
Supply Zone (POI): 23,524 – 23,637, where price may retest before further decline (potential short entry zone).
Trend: Current momentum is bearish after rejection from channel resistance.
Support/Target: Main downside target is 22,979 – 22,905, aligning with previous swing low and Fibonacci extension area.
EMA Strategy: Price below both 70 & 200 EMA indicates bearish trend continuation.
Structure Break: Breakdown of channel support suggests sellers are in control.
📌 Trading Plan:
Entry (Sell Zone): 23,524 – 23,637 (POI Supply Zone)
Stop Loss: Above 23,640 (channel resistance)
Target: 22,979 – 22,905
Conclusion:
Market is in bearish structure. Wait for pullback to supply zone for a high-probability short entry, targeting the lower support zone.

NAS100 Trend Analysis: From Higher Highs to a Potential Shift📊 NASDAQ 100 (NAS100) Analysis 📊
Someone recently asked me to cover the NAS100 🤔 as price action can look a little confusing right now. On the 4H chart ⏰, we’ve been trending strongly 🟢📈 throughout the week. However, as we head into the end of the week 📅, things are starting to shift.
Zooming into the 30M timeframe 🔍, price action is showing early signs of weakness ⚠️. We’ve had a high, then a higher high ⬆️, and now a lower high 🔽 — instead of a continuation of higher highs.
In the video, we take a deep dive 🎥 into market structure 🏗️, price action 💡, and the trend 📊, highlighting what to watch out for as institutions and big players wind up or unwind positions 💼 into the week’s close.
💬 Your thoughts and comments are welcome!
⚠️ This is educational only and not financial advice. 📚

short nassame strat, if price goes that order block, bullish small green candle or some red candle, looking to short this.
NASDAQ100 HIGH PROBABILITY SETUP SOON!!!🚨 NAS100 HIGH PROBABILITY SELL SETUP 🚨
* Here We Can See Clearly The Next Potential Move For US100 Coming Hours/Days.
* Keep Your Eyes Close On Your Trading Positions.
* Happy PIP Hunting Traders.
FXKILLA.


Nas100 Trade Set Up Sep 5 2025FX:NAS100
www.tradingview.com
Price switched to bullish structure yesterday and is now making HH/HL so i will be looking for a pullback into 15m FVG followed by a 1m IFVG to target higher BSL

NAS100 OUTLOOOKPrice is within August Range, therefore it can either take the buy side liquidity/sell side liquidity before it can actually give us a significant move.
Within this August's Range, it started taking out previous weekly Buy side liquidity, therefore the price is expected to go to the relevant equal lows

NASDAQ MARKET STRUCTURE , WHERE NAS GO ? Selling Nasdaq Now Price 2400
Reason Double Top
Takedown The Buy Side Liquidity
Target Sell Side Liquidity
Buying Nasdaq Pending
Buy Nasdaq Cisd ( 23,330)
Buy Nasdaq OB ( 23,10 )

NAS100 H4 | bullish momentum to extendNAS100 has reacted off the buy entry at 23,720.82, which is a pullback support and could bounce from this level to the take profit.
Stop loss is at 23,572.15, which is a pullback support.
Take profit is at 24,065.29, which lines up with the 61.8% Fibonacci projection and the 138.2% Fibonacci extension.
High Risk Investment Warning
Trading Forex/CFDs on margin carries a high level of risk and may not be suitable for all investors. Leverage can work against you.
Stratos Markets Limited (tradu.com ):
CFDs are complex instruments and come with a high risk of losing money rapidly due to leverage. 65% of retail investor accounts lose money when trading CFDs with this provider. You should consider whether you understand how CFDs work and whether you can afford to take the high risk of losing your money.
Stratos Europe Ltd (tradu.com ):
CFDs are complex instruments and come with a high risk of losing money rapidly due to leverage. 66% of retail investor accounts lose money when trading CFDs with this provider. You should consider whether you understand how CFDs work and whether you can afford to take the high risk of losing your money.
Stratos Global LLC (tradu.com ):
Losses can exceed deposits.
Please be advised that the information presented on TradingView is provided to Tradu (‘Company’, ‘we’) by a third-party provider (‘TFA Global Pte Ltd’). Please be reminded that you are solely responsible for the trading decisions on your account. There is a very high degree of risk involved in trading. Any information and/or content is intended entirely for research, educational and informational purposes only and does not constitute investment or consultation advice or investment strategy. The information is not tailored to the investment needs of any specific person and therefore does not involve a consideration of any of the investment objectives, financial situation or needs of any viewer that may receive it. Kindly also note that past performance is not a reliable indicator of future results. Actual results may differ materially from those anticipated in forward-looking or past performance statements. We assume no liability as to the accuracy or completeness of any of the information and/or content provided herein and the Company cannot be held responsible for any omission, mistake nor for any loss or damage including without limitation to any loss of profit which may arise from reliance on any information supplied by TFA Global Pte Ltd.
The speaker(s) is neither an employee, agent nor representative of Tradu and is therefore acting independently. The opinions given are their own, constitute general market commentary, and do not constitute the opinion or advice of Tradu or any form of personal or investment advice. Tradu neither endorses nor guarantees offerings of third-party speakers, nor is Tradu responsible for the content, veracity or opinions of third-party speakers, presenters or participants.

NQ Weekly Analysis!FA Analysis:
1- We know that the FED opened the door for a rate cut in September (Next week). The FED gave priority to address Employment Mandate issue and considered the higher inflation data as one time shot.
2- Hence, the Inflation (the second FED mandate) the most relevant data this week with both PPI and CPI to validate the FED view of one time shot. Another higher inflation will destroy this narrative and the FED might revise the way forward.
The story is simple: Higher Inflation data will send NQ down and vice-versa for inline and softer inflation.
TA Analysis:
Weekly TF:
The weekly close expresses really the incertitude regarding the direction. No clear direction; both direction are open; all will depend on inflation data.
Daily TF:
The daily close was bearish. NFP data provided an inline inflation data but a very negative employment data. As mentioned, bad data data is bad for NQ and vice-versa.
From daily perspective, price might retest Friday high or just NFP low (magenta dotted line) and continue down towards TP1, TP2 and TP3 particularly if Inflation data comes strong.
H4 TF:
H4 provided a break down. Inline with daily analysis, the least resistance is that price continues down after a short retrace up.
GL Everyone!

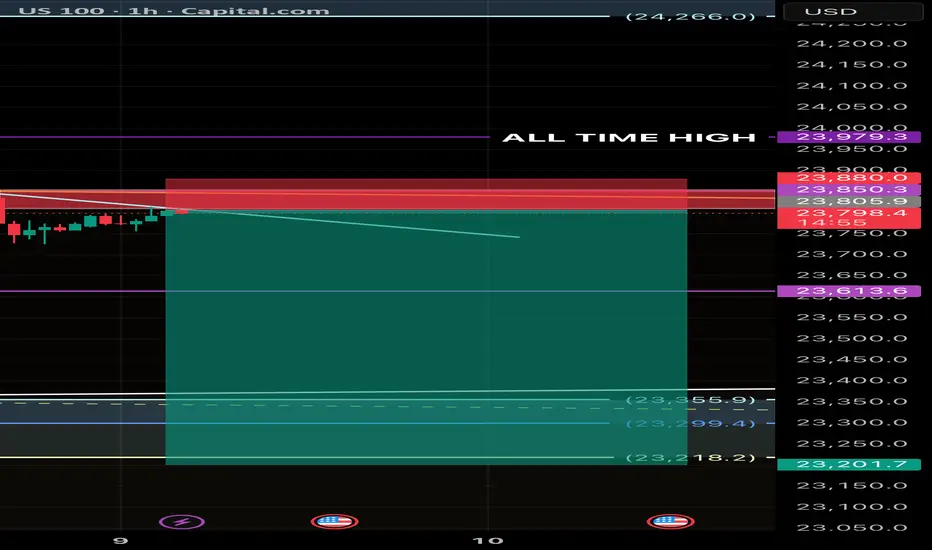
US100 – Short Setup Near All-Time High US100 – Short Setup Near All-Time High
Price is currently testing a critical resistance zone near the all-time high at 23,979. After rejecting from this level, I’ve identified a potential short opportunity with a favorable risk-to-reward ratio.
Price testing ALL-TIME HIGH (23,979) and rejecting from resistance zone.
🔴 Entry: 23,798 – 23,805
🛑 SL: 23,880
🎯 TP1: 23,613 | TP2: 23,355 | TP3: 23,201
⚡ Strong supply zone + rejection → high R:R setup (~1:5).
❌ Invalidation above 23,880.
#US100 #NASDAQ100 #indices #PriceAction #TradingSetup #SupplyDemand #ShortTrade
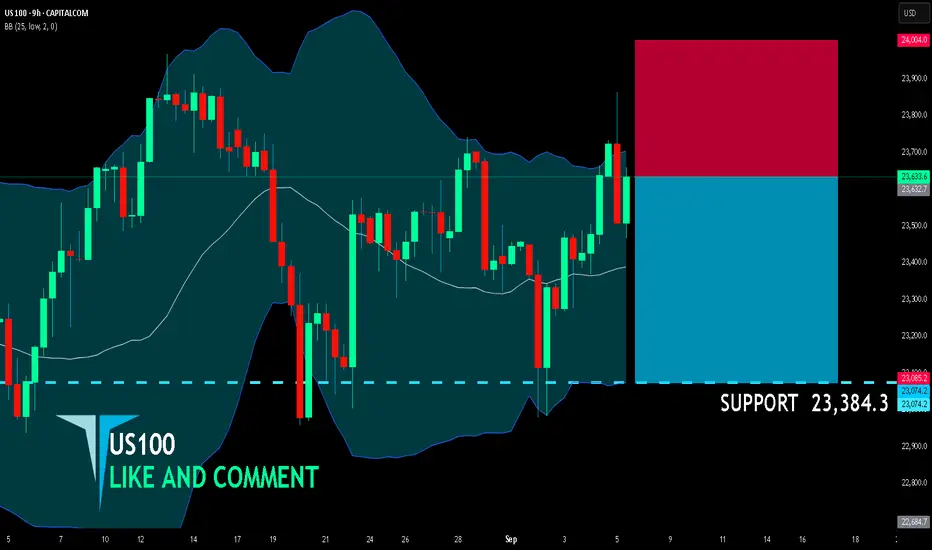
US100 SHORT FROM RESISTANCE
US100 SIGNAL
Trade Direction: short
Entry Level: 23,632.7
Target Level: 23,384.3
Stop Loss: 24,004.0
RISK PROFILE
Risk level: medium
Suggested risk: 1%
Timeframe: 9h
Disclosure: I am part of Trade Nation's Influencer program and receive a monthly fee for using their TradingView charts in my analysis.
✅LIKE AND COMMENT MY IDEAS✅
US100 Strong Bullish Bias! Buy!
Hello,Traders!
US100 keep trading in
A strong uptrend and
The index is now trying
To breakout the key
Horizontal level of 23,940
So IF the breakout is
Confirmed we will be
Expecting a further
Bullish move up
Buy!
Comment and subscribe to help us grow!
Check out other forecasts below too!
Disclosure: I am part of Trade Nation's Influencer program and receive a monthly fee for using their TradingView charts in my analysis.

NASDAQ - Bullish Flow into Highs
Bias: Bullish
HTF (4H Overview):
From the bird’s-eye view, structure remains bullish. Liquidity is being targeted across the 30M–4H multi-timeframe play, with strong bullish intent confirmed by volume printing to the upside.
LTF (30M / 5M Confirmation):
A proper CHoCH has been established. Once the trend shift occurs, we wait for the pullback before attending longs.
Entry Plan:
Look for entry after the courtyard liquidity is collected and demand is mitigated (slash zone).
Targets:
Initial: 5M highs
Extended: 30M highs, depending on market delivery.
Mindset Note:
Patience—let liquidity do its job before striking.

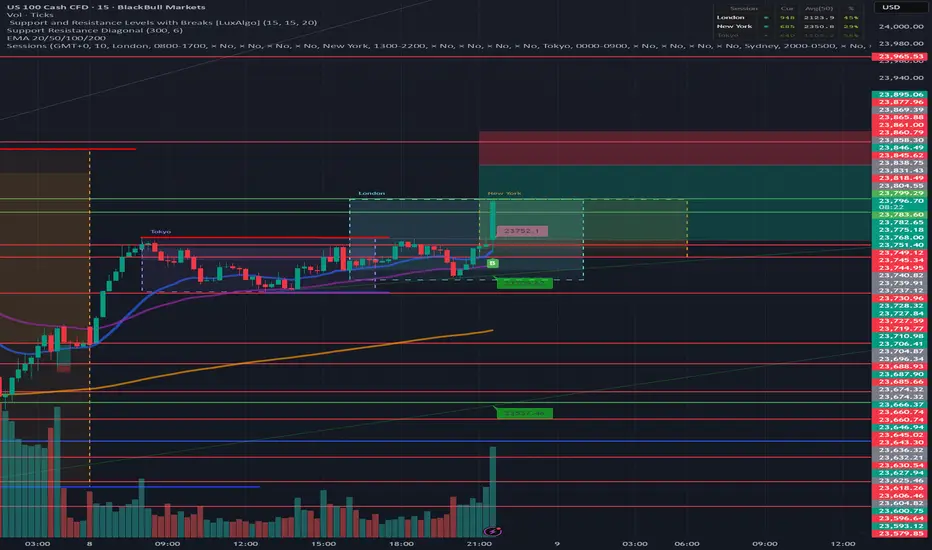
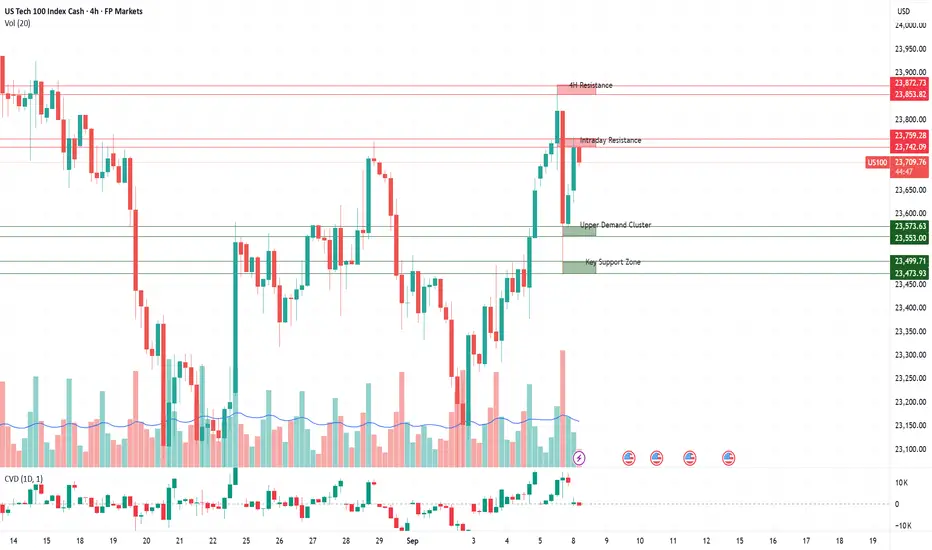
Nas100: Trading Levels in FocusSupply Zones (Red)
23,853 - 23,873
A strong supply zone near recent highs. Sellers are expected to defend aggressively here, making it a potential rejection area. A confirmed breakout and retest, however, could open the path toward new highs.
23,742 – 23,759
This zone reflects last week’s high-volume rejection. Acts as an intraday decision area: sharp rejections can trigger short setups, while a clean break and hold above would strengthen bullish momentum.
Demand Zones (Green)
23,553 – 23,573
A fresh demand zone aligned with recent breakout structure. Buyers may attempt to defend here for continuation longs. If broken, the zone flips into resistance, adding downside pressure.
23,473 – 23,500
Well-tested support area with prior absorption. Strong bounce potential, but multiple retests increase the risk of a breakdown. A failure here would likely accelerate bearish momentum.
Overall Sentiment: Cautiously Bullish on Fragile Ground
At its core, the market is cautiously optimistic right now. Positive momentum from Big Tech and expectations of looser monetary policy are fueling short-term upside potential. At the same time, consolidation and uncertainty around macro data keep sentiment restrained. Momentum is present but it relies on breakout moves holding.
Shall Nasdaq still keep bullish?After an long accumulation without a clear bullish, the Triangle pattern was shaped waiting an good break out in NY session with important News!
The most important level need to break out!
